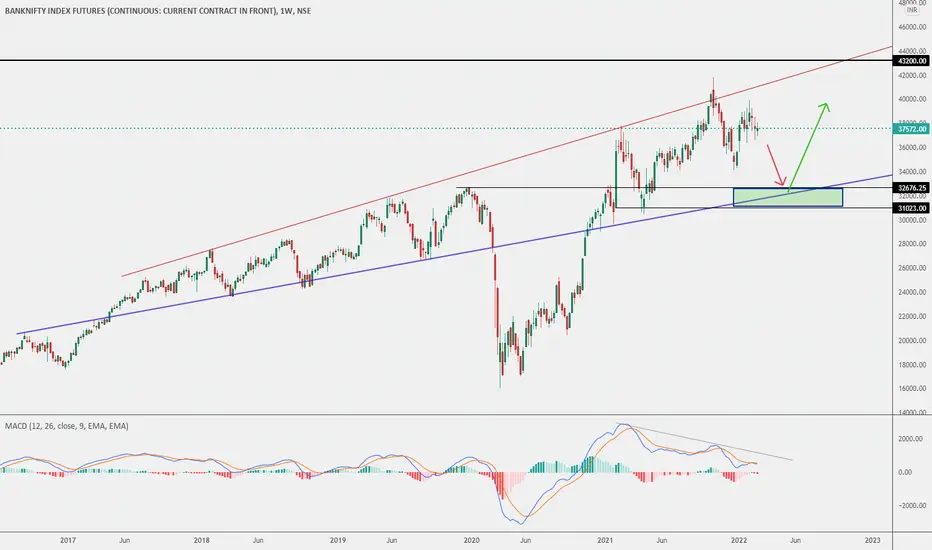
In the weekly chart of BNifty, price is clearly struggling to move up for last 12 months. It has been pretty volatile in last year, but has not moved significantly since Feb'21. Few points are noted down below which might help traders to be in the right direction in the year 2022.
1. MACD and histogram is showing clear bearishness in the weekly chart.
2. Historically price took support at a 5 yrs old trendline (drawn in blue) 4-5 times
3. The biggest candle with the largest volume in last one year was developed in last year Feb on the budget week at around 31000 level which will provide strongest support if the price falls at this level.
4. In last two months there is no weekly candle that has shown strength in the upside (all having long tails in both directions)
5. Unless there is a strong bullish candle that breaks the recent consolidation range and closes above 38500, no reason to go for a long trade (swing/positional)
NB. This view is for study purpose only.
Nota
as expected price is moving down towards its longer term trendline. Till it reaches the buyzone and shows strong sign of demand, only short trade opportunities should be consideredNota
price touched the buy zone as marked in the chart in green and took support. There could be a few weeks of consolidation before price can move further upAviso legal
As informações e publicações não devem ser e não constituem conselhos ou recomendações financeiras, de investimento, de negociação ou de qualquer outro tipo, fornecidas ou endossadas pela TradingView. Leia mais em Termos de uso.
Aviso legal
As informações e publicações não devem ser e não constituem conselhos ou recomendações financeiras, de investimento, de negociação ou de qualquer outro tipo, fornecidas ou endossadas pela TradingView. Leia mais em Termos de uso.