📊 Bank Nifty 1-Hour Time Frame Analysis
🔹 Current Market Snapshot
Closing Price (Sep 26, 2025): ₹54,389.35
Day's Range: ₹54,310.95 – ₹54,897.00
52-Week Range: ₹47,702.90 – ₹57,628.40
Trend: Neutral
🔹 Key Support and Resistance Levels
Opening Support/Resistance Zone: ₹54,935 – ₹54,971
Immediate Resistance: ₹55,167
Last Intraday Resistance: ₹55,368
Last Intraday Support: ₹54,698
Deeper Support: ₹54,545
🔹 Market Scenarios
Gap-Up Opening (200+ points):
A gap-up above ₹55,150–₹55,200 will immediately test the Opening Resistance at ₹55,167. Sustaining above this zone may extend the rally towards the last intraday resistance at ₹55,368.
A breakout above ₹55,368 could invite further bullish momentum.
However, if Bank Nifty fails to hold above ₹55,167, it may retrace back to the support zone around ₹54,971.
Educational Note: Gap-ups often invite early profit booking. Always confirm sustainability above resistance levels before initiating aggressive long trades.
Flat Opening (within ±200 points):
A flat start near ₹54,900–₹55,000 means Bank Nifty will trade directly around the Opening Support/Resistance Zone (₹54,935 – ₹54,971).
Holding above ₹54,971 will give buyers confidence to push towards ₹55,167 → ₹55,368.
A failure to sustain above this zone may drag the index down towards ₹54,698 and possibly ₹54,545.
Educational Note: Flat openings provide clearer setups as price tests both support and resistance zones naturally, giving traders better confirmation of direction.
Gap-Down Opening (200+ points):
A gap-down below ₹54,750 will put immediate pressure on Bank Nifty, exposing the Last Intraday Support at ₹54,698.
Use hourly candle close for stop-loss confirmation to prevent whipsaws.
Avoid naked options in high volatility; instead, use spreads (like Bull Call or Bear Put spreads) to limit premium decay.
Maintain a strict 1:2 risk-to-reward ratio.
Never chase trades out of emotion. Scale into trades gradually rather than going all-in at once.
📈 Technical Indicators Overview
Trend: Neutral
Moving Averages: Not specified
RSI (Relative Strength Index): Not specified
MACD (Moving Average Convergence Divergence): Not specified
Stochastic Oscillator: Not specified
Volume: Not specified
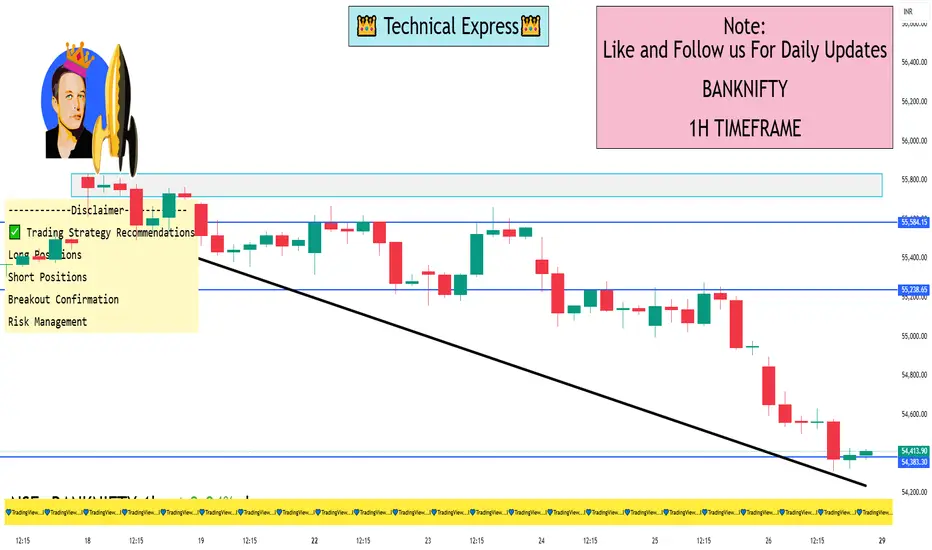
✅ Trading Strategy Recommendations
Long Positions: Consider initiating long positions if Bank Nifty sustains above ₹55,167, with a target towards ₹55,368.
Short Positions: Be cautious of short positions unless a clear breakdown below ₹54,698 is observed, with a subsequent target towards ₹54,545.
Breakout Confirmation: Always wait for confirmation (e.g., a 15-minute close) above or below key levels before entering trades.
Risk Management: Employ stop-loss orders to protect against adverse market movements.
🔹 Current Market Snapshot
Closing Price (Sep 26, 2025): ₹54,389.35
Day's Range: ₹54,310.95 – ₹54,897.00
52-Week Range: ₹47,702.90 – ₹57,628.40
Trend: Neutral
🔹 Key Support and Resistance Levels
Opening Support/Resistance Zone: ₹54,935 – ₹54,971
Immediate Resistance: ₹55,167
Last Intraday Resistance: ₹55,368
Last Intraday Support: ₹54,698
Deeper Support: ₹54,545
🔹 Market Scenarios
Gap-Up Opening (200+ points):
A gap-up above ₹55,150–₹55,200 will immediately test the Opening Resistance at ₹55,167. Sustaining above this zone may extend the rally towards the last intraday resistance at ₹55,368.
A breakout above ₹55,368 could invite further bullish momentum.
However, if Bank Nifty fails to hold above ₹55,167, it may retrace back to the support zone around ₹54,971.
Educational Note: Gap-ups often invite early profit booking. Always confirm sustainability above resistance levels before initiating aggressive long trades.
Flat Opening (within ±200 points):
A flat start near ₹54,900–₹55,000 means Bank Nifty will trade directly around the Opening Support/Resistance Zone (₹54,935 – ₹54,971).
Holding above ₹54,971 will give buyers confidence to push towards ₹55,167 → ₹55,368.
A failure to sustain above this zone may drag the index down towards ₹54,698 and possibly ₹54,545.
Educational Note: Flat openings provide clearer setups as price tests both support and resistance zones naturally, giving traders better confirmation of direction.
Gap-Down Opening (200+ points):
A gap-down below ₹54,750 will put immediate pressure on Bank Nifty, exposing the Last Intraday Support at ₹54,698.
Use hourly candle close for stop-loss confirmation to prevent whipsaws.
Avoid naked options in high volatility; instead, use spreads (like Bull Call or Bear Put spreads) to limit premium decay.
Maintain a strict 1:2 risk-to-reward ratio.
Never chase trades out of emotion. Scale into trades gradually rather than going all-in at once.
📈 Technical Indicators Overview
Trend: Neutral
Moving Averages: Not specified
RSI (Relative Strength Index): Not specified
MACD (Moving Average Convergence Divergence): Not specified
Stochastic Oscillator: Not specified
Volume: Not specified
✅ Trading Strategy Recommendations
Long Positions: Consider initiating long positions if Bank Nifty sustains above ₹55,167, with a target towards ₹55,368.
Short Positions: Be cautious of short positions unless a clear breakdown below ₹54,698 is observed, with a subsequent target towards ₹54,545.
Breakout Confirmation: Always wait for confirmation (e.g., a 15-minute close) above or below key levels before entering trades.
Risk Management: Employ stop-loss orders to protect against adverse market movements.
I built a Buy & Sell Signal Indicator with 85% accuracy.
📈 Get access via DM or
WhatsApp: wa.link/d997q0
Contact - +91 76782 40962
| Email: techncialexpress@gmail.com
| Script Coder | Trader | Investor | From India
📈 Get access via DM or
WhatsApp: wa.link/d997q0
Contact - +91 76782 40962
| Email: techncialexpress@gmail.com
| Script Coder | Trader | Investor | From India
Publicações relacionadas
Aviso legal
As informações e publicações não se destinam a ser, e não constituem, conselhos ou recomendações financeiras, de investimento, comerciais ou de outro tipo fornecidos ou endossados pela TradingView. Leia mais nos Termos de Uso.