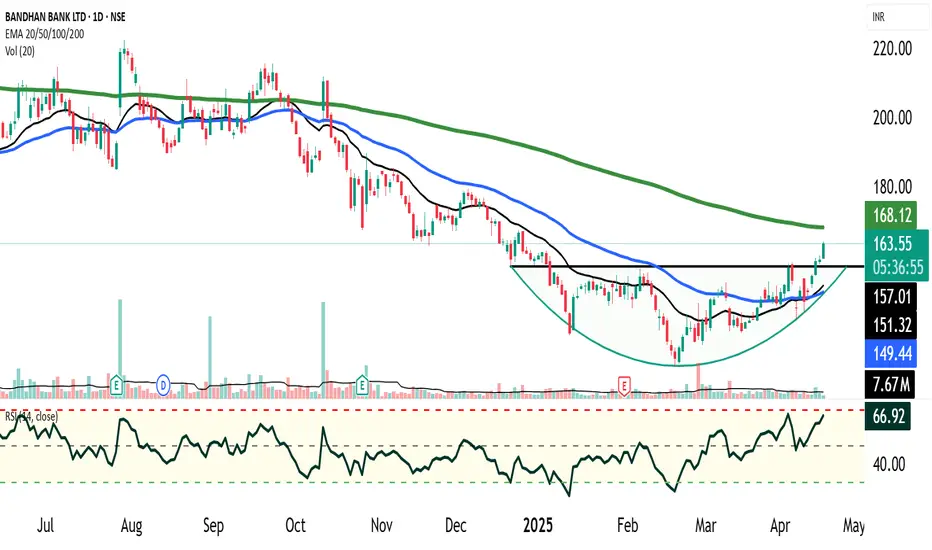
Bandhan Bank has recently formed a classic rounding bottom pattern after an extended long-term downtrend, indicating a potential shift in momentum from bearish to bullish. This basing structure suggests accumulation at lower levels and a possible trend reversal setup.
Pattern Activation: The rounding bottom pattern has triggered a breakout above the neckline resistance of ₹157, accompanied by a volume spike, confirming initial buyer interest and pattern validity.
Lack of Follow-Through Volume: Post-breakout, follow-through buying volume is missing, which raises caution. This could imply either a pause before further upside or an imminent retest of the breakout level around ₹157.
EMA Crossovers:
Bullish Crossover observed as the 20 EMA has crossed above the 50 EMA, suggesting improving short-to-medium term momentum.
However, price remains below the 200 EMA, signaling that the primary trend remains bearish. Sustained trading above the 200 EMA would be needed for confirmation of a longer-term trend reversal.
Risk Management & Strategy:
Cautious Optimism: While the breakout is promising, the stock remains under the long-term moving average and may face selling pressure at higher levels.
Retest Strategy: A pullback to ₹157 (neckline) could offer a low-risk entry point, especially if supported by bullish candlestick confirmation and renewed volume.
Staggered Investment Approach:
Do not park all your money in one go. : It is advised to invest in tranches, monitoring price action closely, especially near the 157–160 zone and at the 200 EMA level.
Conclusion:
Bandhan Bank is showing early signs of a technical base formation and potential trend reversal, but confirmation is pending due to lack of sustained volume and price being below the 200 EMA. The stock warrants close monitoring for a successful retest and possible breakout continuation. Investors should remain cautious, disciplined, and adopt a phased allocation strategy.
Trade fechado: objetivo atingido
100% Target AchievedAviso legal
As informações e publicações não se destinam a ser, e não constituem, conselhos ou recomendações financeiras, de investimento, comerciais ou de outro tipo fornecidos ou endossados pela TradingView. Leia mais nos Termos de Uso.
Aviso legal
As informações e publicações não se destinam a ser, e não constituem, conselhos ou recomendações financeiras, de investimento, comerciais ou de outro tipo fornecidos ou endossados pela TradingView. Leia mais nos Termos de Uso.