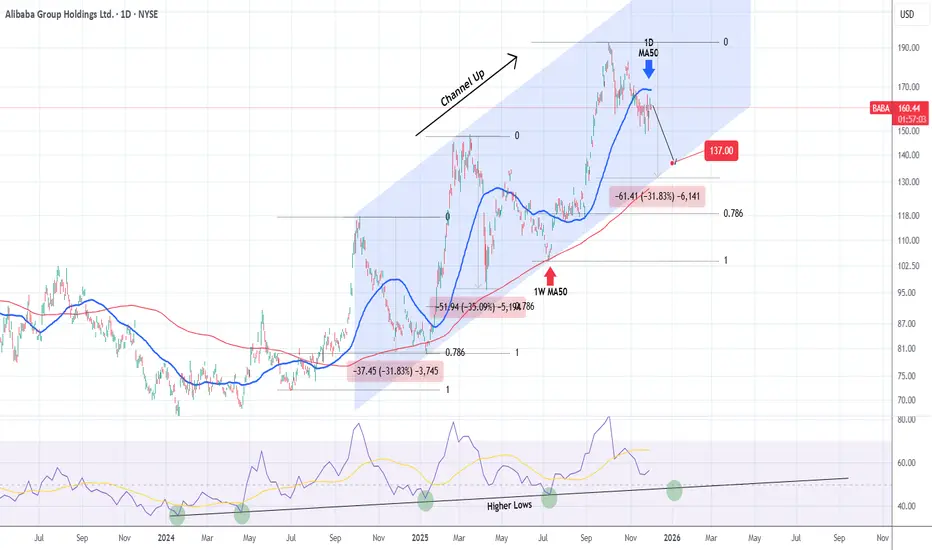
Alibaba (BABA) has been trading within a Channel Up since the October 07 2024 High. Right now it is on the 3rd Bearish Leg of this pattern, confirmed below the 1D MA50 (blue trend-line).
Both previous Bearish Legs touched the 1W MA50 (red trend-line) and the 1W RSI Higher Lows trend-line.
We expect that to happen at $137.00 (at least), which still puts the stock above both the 0.786 Fibonacci retracement level of the Bullish Leg and the -31.83% drop of the first Bearish Leg.
---
** Please LIKE 👍, FOLLOW ✅, SHARE 🙌 and COMMENT ✍ if you enjoy this idea! Also share your ideas and charts in the comments section below! This is best way to keep it relevant, support us, keep the content here free and allow the idea to reach as many people as possible. **
---
💸💸💸💸💸💸
👇 👇 👇 👇 👇 👇
👑Best Signals (Forex/Crypto+70% accuracy) & Account Management (+20% profit/month on 10k accounts)
💰Free Channel t.me/tradingshotglobal
🤵Contact info@tradingshot.com t.me/tradingshot
🔥New service: next X100 crypto GEMS!
💰Free Channel t.me/tradingshotglobal
🤵Contact info@tradingshot.com t.me/tradingshot
🔥New service: next X100 crypto GEMS!
Aviso legal
As informações e publicações não se destinam a ser, e não constituem, conselhos ou recomendações financeiras, de investimento, comerciais ou de outro tipo fornecidos ou endossados pela TradingView. Leia mais nos Termos de Uso.