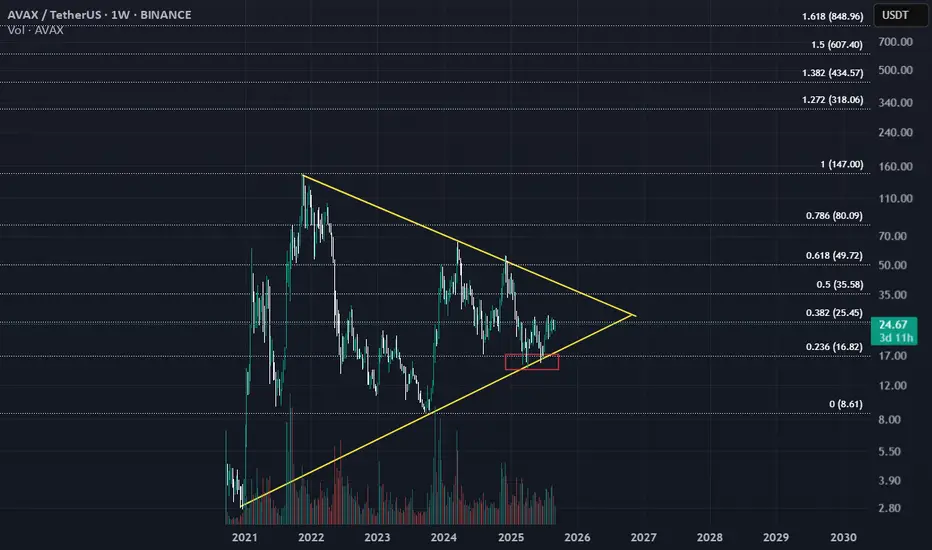
The current price of AVAX is $24.72, with a weekly high of $25.78 and a low of $22.67. The price has increased by 5.64% or $1.32 compared to the previous week's close.
The chart also displays several key technical indicators and levels:
Volume: The trading volume for the AVAX/USDT pair is shown at the bottom of the chart, with the current weekly volume at 12.03M.
Support and Resistance Levels: The chart appears to show a symmetrical triangle pattern, with the price consolidating between the support and resistance levels. The support level is around $16.82, while the resistance level is around $35.58.
Trend Lines: The chart shows along tterm triangle, indicating a potential exploding trend for the AVAX/USDT pair may be begin soon.
Note: dont forget put stop loss in each trade.
Aviso legal
As informações e publicações não se destinam a ser, e não constituem, conselhos ou recomendações financeiras, de investimento, comerciais ou de outro tipo fornecidos ou endossados pela TradingView. Leia mais nos Termos de Uso.
Aviso legal
As informações e publicações não se destinam a ser, e não constituem, conselhos ou recomendações financeiras, de investimento, comerciais ou de outro tipo fornecidos ou endossados pela TradingView. Leia mais nos Termos de Uso.