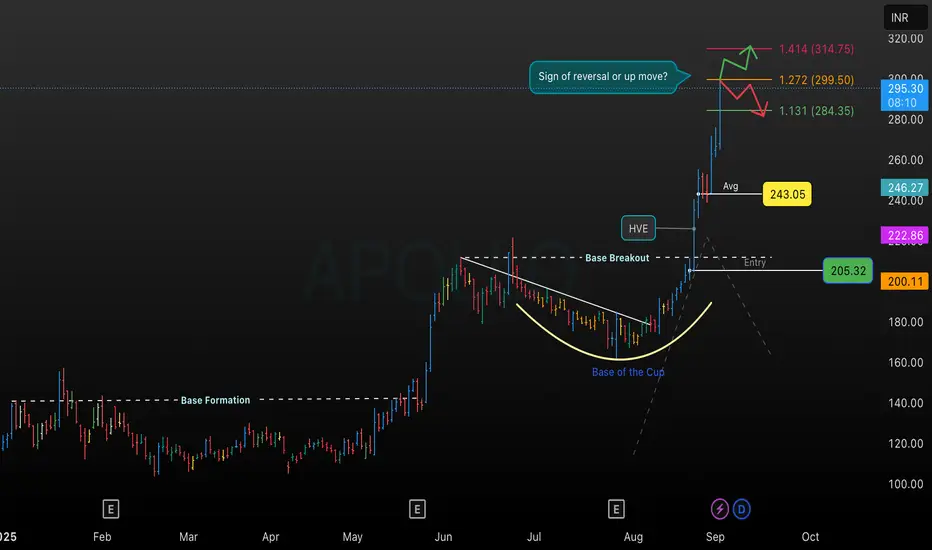
This chart highlights Apollo’s formation of a Cup and Handle pattern, followed by a decisive breakout above the base resistance. The “Base Formation” and “Base of the Cup” mark notable accumulation phases, culminating in a sharp bullish move post-breakout.
Price Action and Levels
• Entry Trigger: The breakout above the base (near ) signaled strong bullish momentum, confirmed by the surge in price and volume.
• Fibonacci Extensions: The current uptrend extends towards key Fibonacci projection levels: , , and . These serve as major profit booking zones and resistance levels.
• Support Zones: Immediate support lies at (average zone), while deeper supports rest at and the breakout level ().
Trading Plan
• Upside Scenario: Sustained momentum above could propel prices towards , validating the bullish breakout.
• Reversal Scenario: Failure to hold above resistance or Fibonacci zones could trigger a pullback towards support zones for retest and consolidation.
• Risk Management: Traders should monitor for reversal signs near extension zones and keep stop-losses below the breakout or next key support.
Summary
This setup presents a high-probability trend continuation pattern backed by clear breakout signals and target zones. Optimal entries lay near support on pullbacks, with potential upside towards the projected Fibonacci levels. Strong risk management is suggested, given the overextension and approaching resistance.
This analysis aims to guide both momentum traders and pattern specialists as Apollo approaches key inflection points after a textbook bullish breakout.
Aviso legal
As informações e publicações não devem ser e não constituem conselhos ou recomendações financeiras, de investimento, de negociação ou de qualquer outro tipo, fornecidas ou endossadas pela TradingView. Leia mais em Termos de uso.
Aviso legal
As informações e publicações não devem ser e não constituem conselhos ou recomendações financeiras, de investimento, de negociação ou de qualquer outro tipo, fornecidas ou endossadas pela TradingView. Leia mais em Termos de uso.