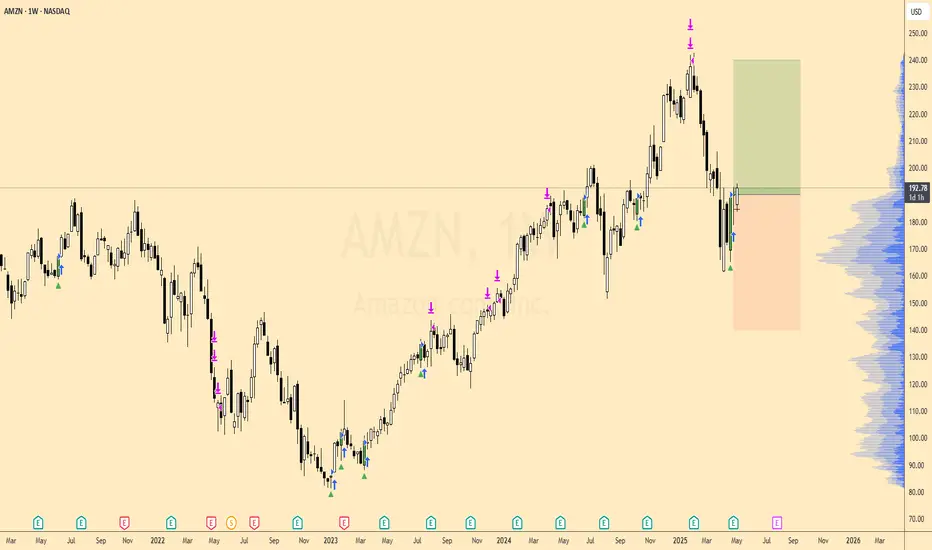
I’m looking to go long on Amazon (AMZN) on the weekly chart as the price that has acted this way has been a strong indicator for a swing trade in the past.
Since early 2023, AMZN has climbed from the mid-$70s to a peak above $245, carving out clear impulse moves followed by healthy pullbacks.
The current pullback has returned into the $185–195 region, which on the weekly VP shows the largest volume accumulation (HVN). Historically this zone has marked both places to buy into rallies and logical areas to defend.
We were in a 5 week range. Last week printed a bullish rejection candle (long lower wick), accompanied by my weekly “buy” arrow (green triangle). This mirrors 34 prior occurrences of the same pattern on AMZN’s weekly chart.
Targeting the $240 region, this is a 1:1 trade
Aviso legal
As informações e publicações não devem ser e não constituem conselhos ou recomendações financeiras, de investimento, de negociação ou de qualquer outro tipo, fornecidas ou endossadas pela TradingView. Leia mais em Termos de uso.
Aviso legal
As informações e publicações não devem ser e não constituem conselhos ou recomendações financeiras, de investimento, de negociação ou de qualquer outro tipo, fornecidas ou endossadas pela TradingView. Leia mais em Termos de uso.