Looking at the daily chart of AMGN, here’s the outlook:
📊 Short-Term Outlook (1–4 weeks)
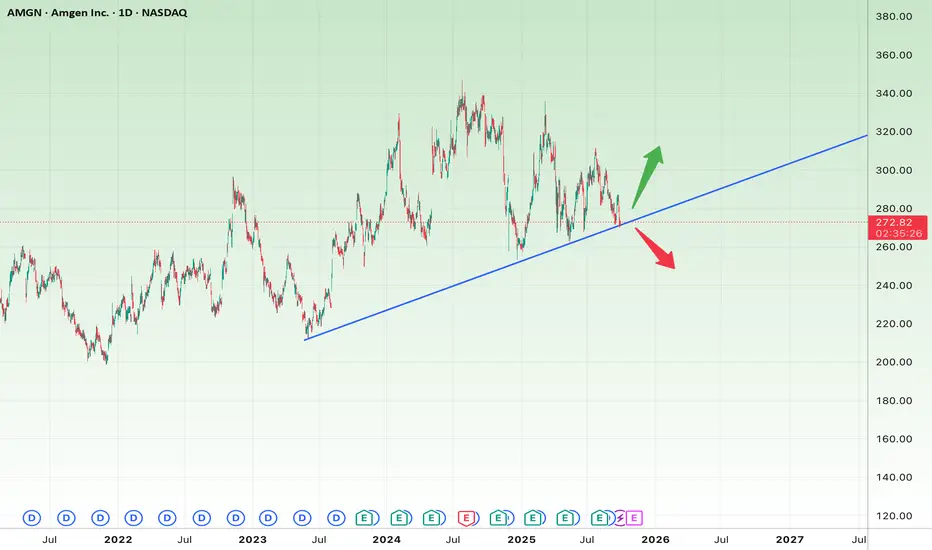
Price Structure: The stock is testing a long-term ascending trendline (blue line). This level has repeatedly acted as strong support since early 2023.
Risk: If buyers fail to defend the trendline, a breakdown could trigger further downside momentum.
Key Support: $270 (trendline + psychological level).
Short-Term Stop Loss: Below $265 on a confirmed daily close.
Short-Term Target: If support holds, a rebound toward $290–300 is likely.
➡️ As long as price stays above $270, the short-term bias favors a bounce.
📊 Long-Term Outlook (2–6 months)
Primary Trend: Long-term uptrend is intact, supported by the ascending trendline since 2022.
Major Support Zone: $265–260 (if broken, the structure weakens significantly).
Long-Term Stop Loss: Below $260 (confirmed close).
Long-Term Targets:
First target: $310 (previous swing highs).
Next target: $330–335 if momentum continues.
➡️ Long-term bullish as long as AMGN respects the $260 support area.
🎯 Summary
Short-Term Trade Idea: Buy near $270 support with a target of $290–300, stop loss at $265.
Long-Term Position: Hold above $260 with upside targets at $310 and $330–335.
Aviso legal
As informações e publicações não devem ser e não constituem conselhos ou recomendações financeiras, de investimento, de negociação ou de qualquer outro tipo, fornecidas ou endossadas pela TradingView. Leia mais em Termos de uso.
Aviso legal
As informações e publicações não devem ser e não constituem conselhos ou recomendações financeiras, de investimento, de negociação ou de qualquer outro tipo, fornecidas ou endossadas pela TradingView. Leia mais em Termos de uso.