Here’s the analysis of your chart for **Amber Enterprises Ltd (NSE)**:
---
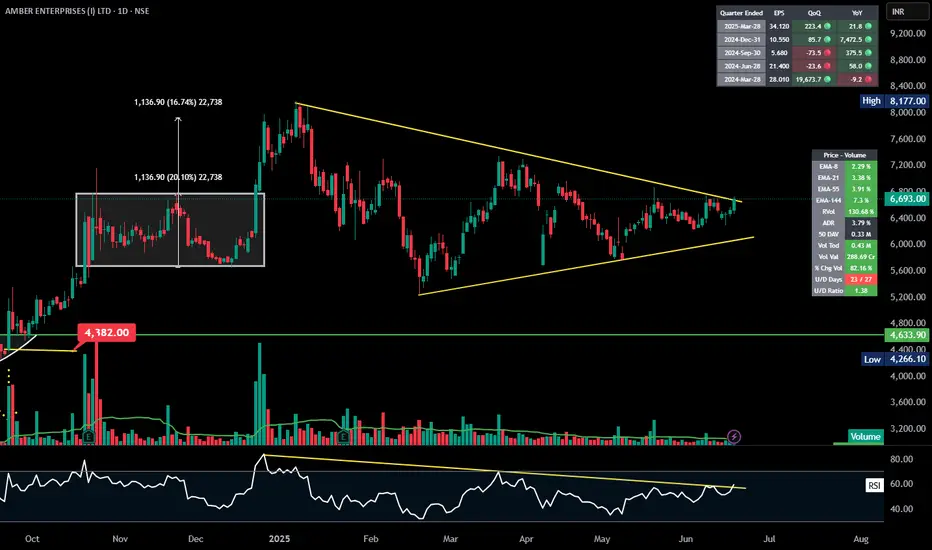
### 📊 **Price Action & Patterns**:
* The stock is forming a **symmetrical triangle** pattern, which is visible by the yellow trendlines.
* Recently, the price has **broken out** above the top trendline around ₹6,693.
* Prior to this triangle, there was a strong upward move — this often increases the probability of an upward continuation.
---
### 📈 **Volume Analysis**:
* Breakout is accompanied by an **increase in volume** (\~0.43M), suggesting strong participation.
* The volume profile also shows that current volume is **higher than average** (50-DMA Vol = 0.33M), reinforcing the breakout strength.
---
### 🔍 **Indicators**:
* **RSI** is breaking above its downward trendline (\~60 level), which indicates a **momentum shift to the upside**.
* Moving averages show short-term EMA (8 & 21) **crossing over** the longer-term averages — supportive of bullish strength.
---
### 🧠 **Key Levels**:
* 📈 **Resistance Breakout** around **₹6,693** — next psychological resistance could be around ₹7,200–7,400.
* 📉 **Support** lies at **₹6,400** (near breakout level) and then ₹6,000.
---
### 🧮 **EPS & Fundamentals**:
* Quarterly EPS (March-2025) at **34.120**, up strongly (223% QoQ, 21.8% YoY), so fundamentals support the move.
---
### ✅ **Summary**:
**Amber Enterprises Ltd** is showing a **technical breakout with strong volume** after consolidating in a symmetrical triangle pattern. Momentum looks positive — a **continuation toward the previous swing high (\~₹7,200)** is possible as long as price stays above ₹6,400.
---
### 📊 **Price Action & Patterns**:
* The stock is forming a **symmetrical triangle** pattern, which is visible by the yellow trendlines.
* Recently, the price has **broken out** above the top trendline around ₹6,693.
* Prior to this triangle, there was a strong upward move — this often increases the probability of an upward continuation.
---
### 📈 **Volume Analysis**:
* Breakout is accompanied by an **increase in volume** (\~0.43M), suggesting strong participation.
* The volume profile also shows that current volume is **higher than average** (50-DMA Vol = 0.33M), reinforcing the breakout strength.
---
### 🔍 **Indicators**:
* **RSI** is breaking above its downward trendline (\~60 level), which indicates a **momentum shift to the upside**.
* Moving averages show short-term EMA (8 & 21) **crossing over** the longer-term averages — supportive of bullish strength.
---
### 🧠 **Key Levels**:
* 📈 **Resistance Breakout** around **₹6,693** — next psychological resistance could be around ₹7,200–7,400.
* 📉 **Support** lies at **₹6,400** (near breakout level) and then ₹6,000.
---
### 🧮 **EPS & Fundamentals**:
* Quarterly EPS (March-2025) at **34.120**, up strongly (223% QoQ, 21.8% YoY), so fundamentals support the move.
---
### ✅ **Summary**:
**Amber Enterprises Ltd** is showing a **technical breakout with strong volume** after consolidating in a symmetrical triangle pattern. Momentum looks positive — a **continuation toward the previous swing high (\~₹7,200)** is possible as long as price stays above ₹6,400.
Aviso legal
As informações e publicações não se destinam a ser, e não constituem, conselhos ou recomendações financeiras, de investimento, comerciais ou de outro tipo fornecidos ou endossados pela TradingView. Leia mais nos Termos de Uso.
Aviso legal
As informações e publicações não se destinam a ser, e não constituem, conselhos ou recomendações financeiras, de investimento, comerciais ou de outro tipo fornecidos ou endossados pela TradingView. Leia mais nos Termos de Uso.