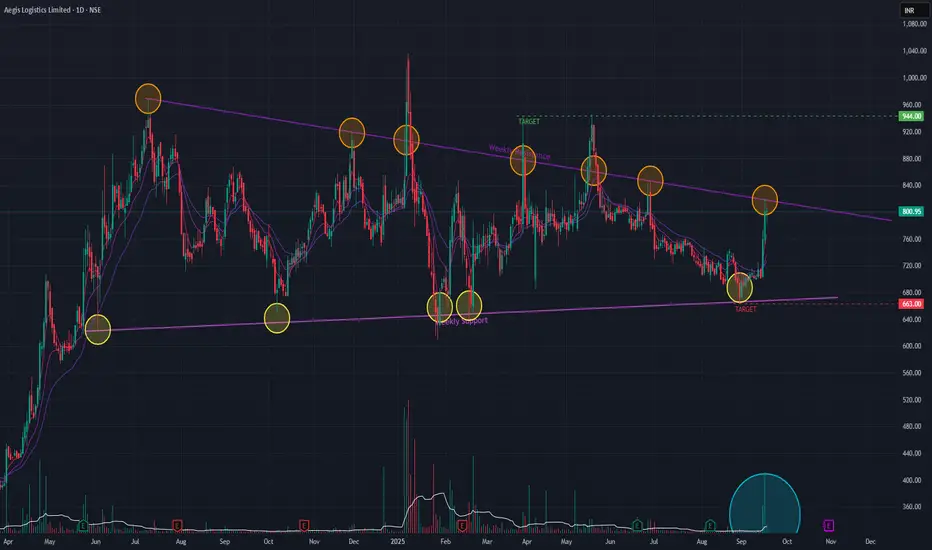
Following a strong uptrend that peaked in July 2024, Aegis Logistics entered a multi-month consolidation phase. Despite marking a new all-time high in January 2025, the stock lacked sustained upward momentum and has since formed a clear Symmetrical Triangle pattern. This pattern typically acts as a continuation signal, suggesting the prior uptrend is likely to resume.
Recent Bullish Momentum
This week, the stock has shown a significant surge in buying interest, rallying +14.05% on the back of very high trading volume. This powerful move towards the triangle's upper boundary indicates strengthening bullish sentiment and a potential impending breakout.
Indicator Analysis
On the daily chart, short-term Exponential Moving Averages (EMAs) have already registered a bullish crossover, confirming the immediate positive momentum. While the weekly EMAs are yet to confirm a similar crossover, they are aligning positively, suggesting a longer-term bullish signal may be forming.
Future Outlook & Key Levels
The direction of the next major move hinges on the resolution of this triangle pattern.
Bullish Scenario: A decisive breakout and close above the triangle's upper trendline would confirm the pattern's continuation. The primary upside target in this case is ₹944.
Bearish Scenario: If the stock fails to break out and instead breaches the lower trendline of the triangle, the bullish thesis would be invalidated. The key support level to watch on the downside would be ₹663.
Watchout for the Price-action !!
Disclaimer: This analysis is my personal view & for educational purposes only. They shall not be construed as trade or investment advice. Before making any financial decision, it is imperative that you consult with a qualified financial professional.
Aviso legal
As informações e publicações não se destinam a ser, e não constituem, conselhos ou recomendações financeiras, de investimento, comerciais ou de outro tipo fornecidos ou endossados pela TradingView. Leia mais nos Termos de Uso.