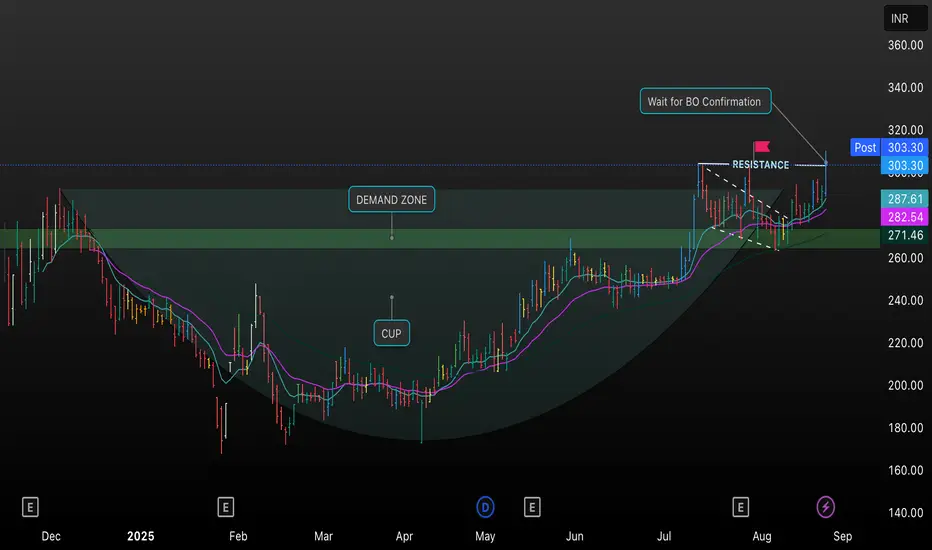
This TradingView chart analyzes ACME Solar, highlighting a classic Cup & Handle pattern forming since early 2025, with price action consolidating in a defined demand zone before recently breaking through resistance around INR 303.30.
Key elements include buying interest at support levels, the emergence of bullish momentum, and a breakout trigger that traders should confirm before entry. The setup suggests a potential trend reversal, with EMA overlays supporting the upward move while resistance acts as the next critical decision level.
Traders are advised to watch for sustained volume and closing above resistance for reliable breakout confirmation, as indicated on the chart.
Trade ativo
Out of tightness VCPAviso legal
As informações e publicações não devem ser e não constituem conselhos ou recomendações financeiras, de investimento, de negociação ou de qualquer outro tipo, fornecidas ou endossadas pela TradingView. Leia mais em Termos de uso.
Aviso legal
As informações e publicações não devem ser e não constituem conselhos ou recomendações financeiras, de investimento, de negociação ou de qualquer outro tipo, fornecidas ou endossadas pela TradingView. Leia mais em Termos de uso.