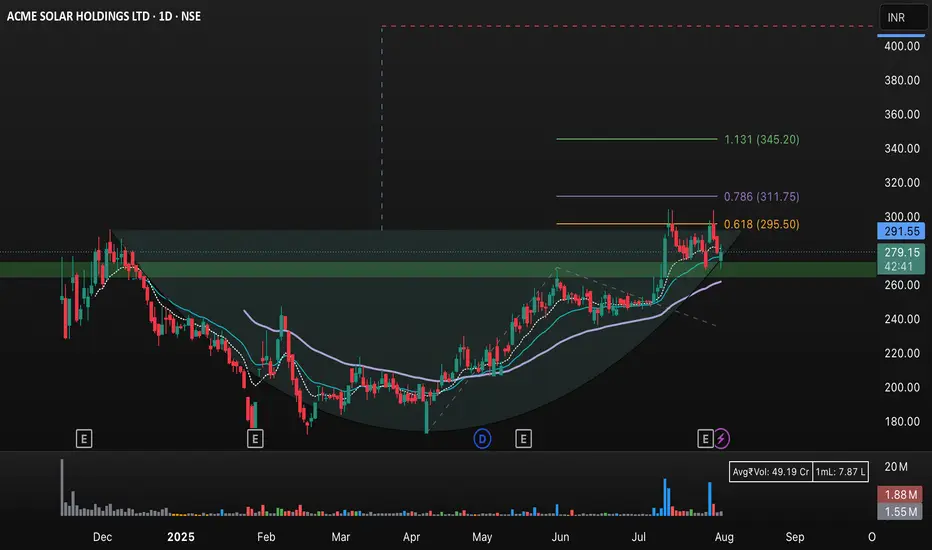
This image displays the daily candlestick chart of ACME Solar Holdings Ltd (NSE: ACMESO) on TradingView. The chart highlights key technical analysis indicators and chart patterns:
• Fibonacci retracement levels at 0.618 (₹295.50), 0.786 (₹311.75), and an extension to 1.131 (₹345.20).
• Support and resistance zones are shaded green, with significant activity around the ₹260–₹300 range.
• A potential cup-and-handle formation is visible, supporting the bullish momentum.
• The current price is ₹279.50, slightly above the 50- and 200-day moving averages (shown as blue lines).
• Volume bars at the bottom indicate substantial trading activity during recent movement.
• The chart suggests a bullish breakout if the price sustains above resistance, with targets at ₹295.50, ₹311.75, and ₹345.20 based on Fibonacci projections, while ₹260 acts as a critical support.
This setup can be used to monitor future price actions, possible breakouts, and key zones for traders and investors.
Aviso legal
As informações e publicações não devem ser e não constituem conselhos ou recomendações financeiras, de investimento, de negociação ou de qualquer outro tipo, fornecidas ou endossadas pela TradingView. Leia mais em Termos de uso.
Aviso legal
As informações e publicações não devem ser e não constituem conselhos ou recomendações financeiras, de investimento, de negociação ou de qualquer outro tipo, fornecidas ou endossadas pela TradingView. Leia mais em Termos de uso.