Directional ATROANDA:EURUSD
TLDR: A custom volatility indicator that combines Average True Range with candle direction.
The Directional ATR (DATR) is an indicator that enhances the traditional Average True Range (ATR) by incorporating the direction of the candle (bullish or bearish).
This indicator is designed to help traders identify trend strength, potential trend reversals, and market volatility.
Key Features:
Trend Confirmation: Positive and increasing DATR values suggest a bullish trend, while negative and decreasing values indicate a bearish trend. A higher absolute DATR value signifies a stronger trend.
Trend Reversal: A change in the direction of the DATR from positive to negative or vice versa may signal a potential trend reversal.
Volatility: Like the standard ATR, the DATR can be used to gauge market volatility, with larger absolute values indicating higher volatility and smaller values suggesting lower volatility.
Divergence: Divergence between the price and the DATR could signal a potential weakening of the trend and an upcoming reversal.
Overbought/Oversold Levels: Extreme DATR values can be used to identify overbought or oversold market conditions, signaling potential reversals or corrections.
Please note that the Directional ATR is just an indicator, and the interpretations provided are based on its underlying logic.
It is essential to combine the DATR with other technical analysis tools and test the indicator on historical data before using it in your trading strategy. Additionally, consider other factors such as risk management, and your own trading style.
Volatilidad
Mora's Compression IndicatorIntroducing Mora's Price Compression indicator.
One of the biggest challenges in trading strategies is to differentiate between zones in which price is consolidated (so called squeezed) and zones of price expansion. Zones of consolidation can indicate traders' indecision or the creation of order blocks, but regardless of their mechanism, most indicators behave differently in those areas as oppose to times when price is trending.
A traditional indicator of consolidation zones is the so call Squeeze, which combines Bollinger Bands and Keltner’s Channels.. although broadly used, its interpretation is not quite straightforward.
Here a new indicator is introduced to identify areas of consolidation or expansion based on current and historical volatility.
Ultimately we know the price is consolidated (current volatility) when it starts raging within a narrower band that we are use to see (Historical volatility), so the ratio of the current to historical volatility becomes a straightforward identification of consolidation zones and that is what this indicator provides.
The indicator is scaled such that values near zero mean price is compressed and values near 100 price is over-extended. The indicators is designed to allow different time-frames, while avoiding repainting.

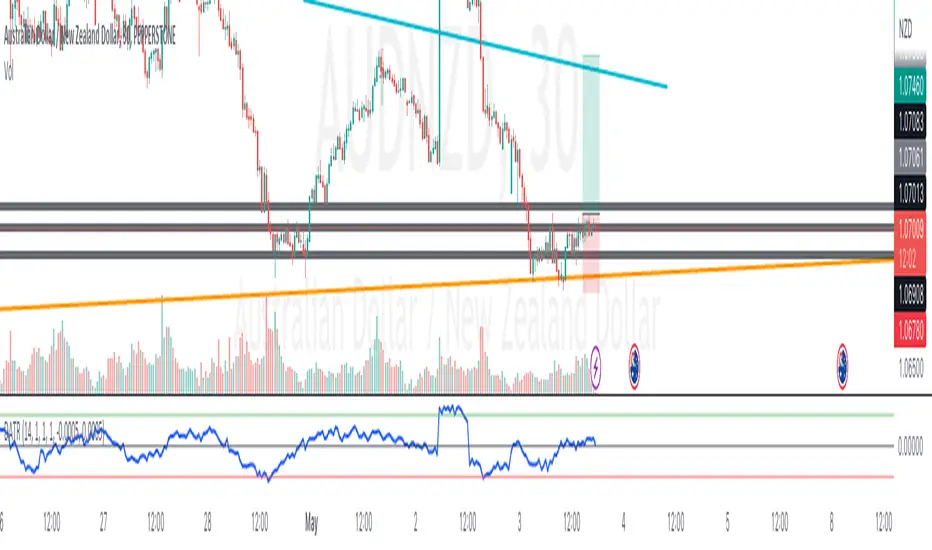
Volatility Trigger IndexThe script allows to assess the volatility of an asset.
It works by calculating the rate of change and the standard deviation.
The index is useful to determine the lowest volatility periods (could be useful to look strategies) and also it determine the highest volatility periods (maybe for exits or partial closes).
It has 3 iputs:
Lenght.
Low volatility value.
High volatility value.
The low and high values are set after a visual inspection. The values changes in each time frame. Usually when the timeframe is higher the value of the index is higher as well. So the low and high levels must be changed after each time frame set.
As an idea could be used in combination with any moving average to determine the market direction and the index used as a trigger.

3EMA + Boullinger + PIVOTTRES EMAS + BANDAS DE BOLLINGER + PIVOTE
INDICADOR 1: TRES EMAS (MEDIA MOVIL EXPONENCIAL)
Con este indicador puede visualizar el promedio de precios con mayor peso a los datos mas recientes.
Se calculan y dibujan tres medias móviles exponenciales: 8, 20 y 200 últimas velas.
-Rápida EMA1 = 8
-Media EMA2 = 20
-Lenta EMA 3 = 200
INDICADOR 2: BANDAS DE BOLLINGER
Con este indicador podrá ver la fuerza y la tendencia del mercado, es decir la mide la volatilidad del precio del activo.
Si el precio sobrepasa la banda superior, el activo está sobrecomprado.
Si el precio sobrepasa la banda inferior, el activo está sobrevendido.
Longitud tendencia - BASE = 20, paso = 1
Desviación Estándar - Multiplicador = 2, paso = 0.2
INDICADOR 3: PIVOTE
Este indicador etiqueta los puntos donde el precio es mínimo y máximo, en un rango de velas determinado en el parámetro "Distancia para el Pivote".
Estos 3 indicadores sirven para todo tipo de activos: FOREX, CRIPTO, CFD´s, ETC.
------------------------------------------------------------------------------------------------------------------
THREE EMAS + BOLLINGER BANDS + PIVOT
INDICATOR 1: THREE EMAS ( EXPONENTIAL MOVING AVERAGE )
With this indicator you can visualize the average of prices with greater weight to the most recent data.
Three exponential moving averages are calculated and drawn: 4, 20 and 200 last candles.
-Fast EMA1 = 8
-Average EMA2 = 20
-Slow EMA 3 = 200
INDICATOR 2: BOLLINGER BANDS
With this indicator you can see the strength and trend of the market, that is, it is measured by the volatility of the asset price.
If the price goes above the upper band, the asset is overbought.
If the price goes above the lower band, the asset is oversold.
Trend length - BASE = 20, step = 1
Standard Deviation - Multiplier = 2, step = 0.2
INDICATOR 3: PIVOT
This indicator labels the points where the price is minimum and maximum, in a range of candles determined in the parameter "Distance to Pivot".
These 3 indicators are used for all types of assets: FOREX, CRYPT, CFD's, ETC.

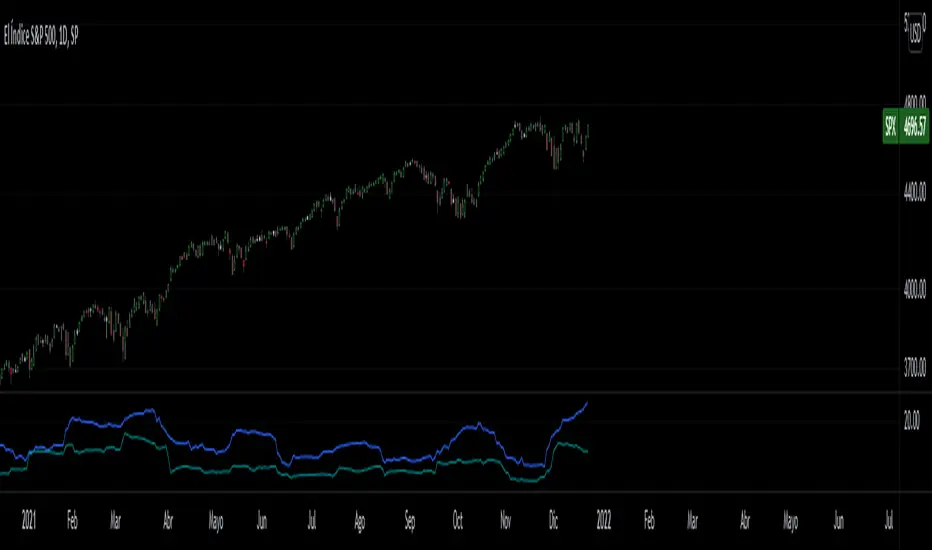
Historical Volatility Close to Close VS High to LowClose to Close Volatility VS high to low, to evaluate volatility regimes.
Both are Volatilities of 40 periods (Modifiable), calculated on 252 days (Average trading days in the American market) (Also modifiable in the case of cryptocurrency analysis).
The Moving Average is a 20 periods (Modifiable) Simple Moving Average of the average of both volatilities.
Blue = Close to Close Volatility
Green = High to Low Volatility
Orange = Moving Average
Volatilidad Close to Close VS High to Low, para evaluar regimenes de volatilidad historica.
Ambas son Volatilidades de 40 periodos (Modificable), calculadas sobre 252 dias (Promedio de dias operables en el mercado americano)(Tambien modificable para el caso de analisis de criptomonedas).
La Media movil, es una media movil Simple de 20 periodos del promedio de ambas volatilidades.
Azul = Volatilidad Close to Close
Verde = Volatilidad High to low
Naranja = Media Movil
Reditum SniperReditum Sniper synchronizes multiple time frames POC's (Point of Control) to a single graph, allowing its user to find valuable area's which may act as key levels to take educated decisions. Furthermore it uses custom made formulas to find the lookback period of previously mentioned values.
Reditum Sniper vs Reditum Scanner
Reditum Sniper aproaches the markets in a similar way as the Reditum Scan, yet it counts with several updates and overall a rebrand. The Reditum Sniper includes bug fixes, weekly poc has been added, the ability to fix the max_bars_back error in any security, less memory use which is required due to errors presented in later versions of the TradingView platform, functions which simplify the code and much more!
Components of Reditum Scan:
POC's (30 min, 60 min, 120 min, 240 min, daily, weekly)
How does it work?
The algorithm allows you to identify areas of strong support and resistance , based on where most of the trading activity takes place.
What are the strategies for considering placing a trade?
1.Cluster (agglomeration of multiple POC's) to cluster (by identifying two clusters, the price could go smoothly from one Cluster to the other).
2. From cluster (agglomeration of multiple POCs, each with unique color. Now, from this cluster important movements may begin).
3. Towards a cluster (like the “from cluster” pattern, we identify areas of high interest for institutional companies, in this pattern the cluster acts like a magnet, if price is near it may be fully attracted towards the agglomeration).
If you are a member of the mastermind tribe please contact the support team within the tribe to access the indicator (do not leave personal or subscription data in the comments on this page), if not, please visit the link located in our signature.
Thanks for taking a look!
---------------------------------------------------------------------------------------------------------------------------------------------------------------
Reditum Sniper sincroniza múltiples POC's (Puntos de Control) de distintos marcos de tiempo a un único grafico, permitiéndole al usuario encontrar áreas de alto valor que pueden actuar como niveles clave para tomar una decisión educada en su inversión. Además utiliza formulas propias para encontrar la cantidad de data utilizada para los valores previamente mencionados.
Reditum Sniper vs Reditum Scanner
Reditum Sniper enfrenta el mercado de una manera similar al Reditum Scan, aun así cuenta con una gran cantidad de cambios y sobre todo un cambio de marca. El Reditum Sniper incluye una gran cantidad de arreglos de bugs, el poc weekly ya esta incluido por default, la habilidad de solucionar el error max_bars_back que se presentaba en ciertos marcos de tiempo, menor uso de memoria el cual se requiere debido a que se presentaba este error en nuevas versiones de la plataforma, funciones que simplifican el código y mucho más!
Componentes de Reditum Scan:
POC´s (30 min, 60 min, 120 min, 240 min, diario, semanal)
¿Cómo funciona?
El algoritmo le permite identificar áreas de fuerte soporte y resistencia, según el lugar donde se lleva a cabo la mayor parte de la actividad comercial.
¿Cuáles son las estrategias para considerar una entrada?
1.Cluster (aglomeración de múltiples POC´s) a cluster (al identificar dos cluster el precio podría ir con fluidez desde uno al otro que lo recibe).
2.Desde cluster (lo identificamos con la aglomeración de múltiples POC identificados con colores que hacen fácil la lectura. Ahora, desde este cluster podrían iniciar movimientos importantes).
3.Hacia cluster (al igual que el patrón “desde cluster” identificamos zonas de alto interés para los institucionales, en este patrón el cluster actúa como un imán para el precio, de modo que cuando el precio está lejos de él, lo podría atraer con fuerza).
Para acceder a la herramienta, si usted es miembro de la tribu mastermind por favor comunicarse con el equipo de soporte dentro de la tribu (no dejar datos personales ni de suscripción en los comentarios de esta página), si no es miembro por favor visite el enlace a continuación en nuestra Firma.
Gracias por echarle un vistazo!.

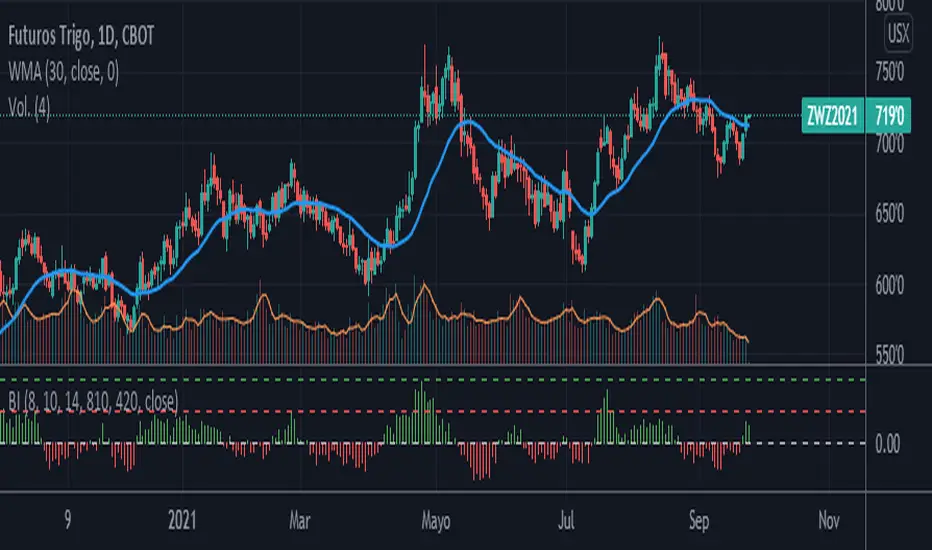
Bullish InertiaThe Bullish Inertia is an indicator that measures the strength of an asset with respect to its volatility, calculated as:
Strength / Volatility = Bullish Inertia (BI)
Parameters:
Len1 = Length of ROC1
Len2 = Length of ROC2
Len3 = Length of the ATR
//Spanish
La inercia alcista es un indicador que mide la fortaleza de un activo respecto a su volatilidad, calculado como:
Fortaleza / Volatilidad = Inercia Alcista (IA)
Parametros:
Len1 = Longitud de ROC1
Len2 = Longitud del ROC2
Len3 = Longitud del ATR
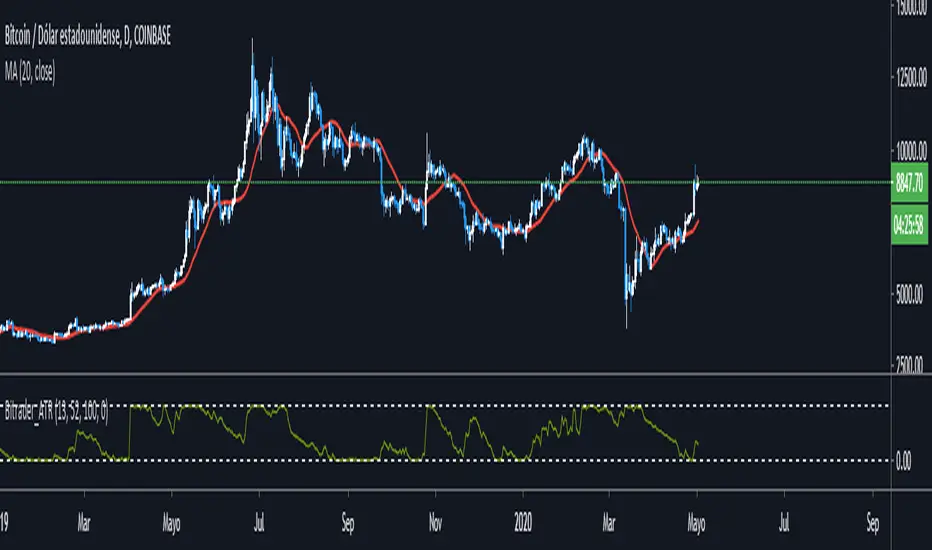
Bitrader_ATRUn verdadero rango normalizado de Larry Williams, es el Bitrader_ATR
La fórmula para el cálculo:
ATR_Normalize = 100 * MovingAvg (Cerrar - Bajo, período rápido) / (MovingAvg (Rango verdadero, período lento)
Esto es una indicación de que se puede definir con firmeza y claridad cuando el precio alcanza picos y cae a los fondos.
Cuando el indicador está en la zona alta, generalmente anuncia que el precio de la seguridad caerá, y cuando está en el área inferior, dice que los precios subirán.
***********************************************************
A normalized true range by Larry Williams, is the Bitrader_ATR
The formula for the calculation:
ATR_Normalize=100 * MovingAvg (Close – Low, fast period) / (MovingAvg (True Range , slow period)
This is an indication of that it can be firmly and clearly defined when the price reaches peaks an falls to bottoms.
When the indicator is in the high zone, it usually portends that the security price will fall, and when it is in the lower area – says that prices will rise.