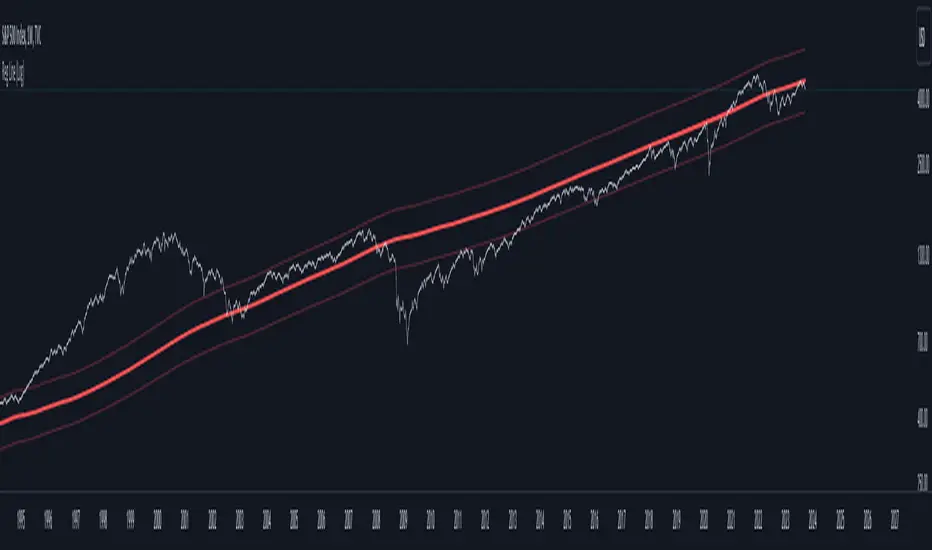
Regression Line (Log)This indicator is based on the "Linear Regression Channel (Log)," which, in turn, is derived from TradingView's "Linear Regression Channel."
The "Regression Line (Log)" indicator is a valuable tool for traders and investors seeking to gain insights into long-term market trends. This indicator is personally favored for its ability to provide a comprehensive view of price movements over extended periods. It offers a unique perspective compared to traditional linear regression lines and moving averages, making it a valuable addition to the toolkit of experienced traders and investors.
Indicator Parameters:
Before delving into the details, it's worth noting that the chosen number of periods (2870) is a personal preference. This specific value is utilized for the S&P 500 index due to its alignment with various theories regarding the beginning of the modern economic era in the stock market. Different analysts propose different starting points, such as the 1950s, 1970s, or 1980s. However, users are encouraged to adjust this parameter to suit their specific needs and trading strategies.
How It Works:
The "Regression Line (Log)" indicator operates by transforming the closing price data into a logarithmic scale. This transformation can make the linear regression more suitable for data with exponential trends or rapid growth. Here's a breakdown of its functioning and why it can be advantageous for long-term trend analysis:
1. Logarithmic Transformation : The indicator begins by applying a logarithmic transformation to the closing price. This transformation helps capture price movements proportionally, making it especially useful for assets that exhibit exponential or rapid growth. This transformation can render linear regression more suitable for data with exponential or fast-paced trends.
2. Linear Regression on Log Scale : After the logarithmic transformation, the indicator calculates a linear regression line (lrc) on this log-transformed data. This step provides a smoother representation of long-term trends compared to a linear regression line on a linear scale.
3. Exponential Reversion : To present the results in a more familiar format, the indicator reverts the log-transformed regression line back to a linear scale using the math.exp function. This final output is the "Linear Regression Curve," which can be easily interpreted on standard price charts.
Advantages:
- Long-Term Trend Clarity : The logarithmic scale better highlights long-term trends and exponential price movements, making it a valuable tool for investors seeking to identify extended trends.
- Smoothing Effect : The logarithmic transformation and linear regression on a log scale smooth out price data, reducing noise and providing a clearer view of underlying trends.
- Adaptability : The indicator allows traders and investors to customize the number of periods (length) to align with their preferred historical perspective or trading strategy.
- Complementary to Other Tools : While not meant to replace other technical indicators, the "Regression Line (Log)" indicator complements traditional linear regression lines and moving averages, offering an alternative perspective for more comprehensive analysis.
Conclusion:
In summary, the "Regression Line (Log)" indicator is a versatile tool that can enhance your ability to analyze long-term market trends. Its logarithmic transformation provides a unique perspective on price data, particularly suited for assets with exponential growth patterns. While the choice of the number of periods is a personal one, it can be adapted to fit various historical viewpoints. This indicator is best utilized as part of a well-rounded trading strategy, in conjunction with other technical tools, to aid in informed decision-making.
Trend
SIP SmartlyIntroduction:
The SIP Smartly indicator is designed to mimic the behavior of a systematic investment plan, a popular investment strategy where a fixed quantity of an asset is purchased at regular intervals, typically monthly. In this case, we're applying this concept to trading by specifying a start date, a fixed purchase quantity, and certain conditions for buying.
Indicator Components:
User Inputs:
1. Start Date Inputs:
startyear, startmonth, startday: These inputs allow you to specify the year, month, and day when the SIP strategy begins.
2. buyQty:
This input allows you to specify the quantity of the security to purchase in each SIP installment.
What is Standard SIP ?
A Standard Systematic Investment Plan (SIP) is an investment strategy where individuals consistently invest a fixed amount of money at regular intervals, such as monthly or quarterly, in mutual funds or stocks. This approach promotes disciplined and long-term investing, taking advantage of rupee-cost averaging, where more shares are purchased when prices are low and fewer when prices are high. SIPs are designed for individuals seeking gradual wealth accumulation over time while mitigating the impact of market volatility through consistent, automated investments.
Logic of the Smart SIP Indicator:
Dynamic Quantity: The Smart SIP indicator allows you to invest a fixed quantity of a security at regular intervals based on technical analysis conditions. This is different from a standard SIP, where you typically invest a fixed amount of money.
Technical Analysis Driven: The Smart SIP indicator employs technical analysis indicators, such as multiple moving averages and uses the crossover of a higher MA with a lower MA which indicates a possible trend reversal, to determine Buy signals based on price trends. In contrast, a standard SIP doesn't consider technical factors but rather involves regular investments regardless of market conditions.
Adaptability: Unlike a standard SIP, which follows a predetermined investment schedule, the Smart SIP can adapt to changing market conditions. It triggers Buy actions only when specific technical conditions are met, providing a more flexible and responsive approach to investing or trading.
Market Value Tracking: The Smart SIP continuously tracks the market value of the invested quantity in real-time. This allows you to monitor the performance of your SIP investments dynamically, considering market fluctuations. In a standard SIP, you typically track the overall portfolio value without real-time adjustments.
Alert Notifications: The Smart SIP can send alert notifications when Buy conditions are met. This feature ensures timely execution of trades when favorable market conditions align with the technical criteria. In a standard SIP, you usually follow a fixed investment schedule without real-time alerting.
In summary, the unique logic of the Smart SIP indicator lies in its adaptability, technical analysis-driven approach, and real-time tracking and alerting features, making it well-suited for trading in financial markets while still following the concept of a systematic investment plan.
How to Use the SIP Smartly Indicator:
Start Date Selection:
Input your desired start date using the startyear, startmonth, and startday parameters. This is the date when your SIP strategy will begin.
Buy Quantity Setting:
Set the buyQty input to the quantity of the security you want to purchase in each SIP installment.
Alerts:
The indicator can trigger alerts when Buy conditions are met. These alerts can be configured to notify you when it's time to make a SIP installment.
Risk Management and Considerations:
Confirmation: While the SIP Smartly indicator provides insights, use it alongside other technical and fundamental analysis tools for confirmation before making trading decisions.
Backtesting: Before using this indicator in live trading, conduct thorough backtesting on historical data to evaluate its performance under different market conditions.
Position Sizing: Determine your position size and risk management rules based on the quantity purchased in each SIP installment.
Market Awareness: Stay informed about market conditions and news events that could impact price movements. This indicator is a tool to aid your trading strategy, not a standalone solution.
Conclusion:
The SIP Smartly Indicator offers a systematic approach to trading by simulating a SIP strategy. By inputting your start date and desired buy quantity, you can follow a disciplined investment approach in your trading. Remember to customize the inputs to match your trading preferences and risk tolerance.
Disclaimer: This indicator is provided for educational purposes and should be used with caution. Trading involves risks, and you should thoroughly test any strategy before applying it in live trading.

GKD-C Trend Direction [Loxx]The Giga Kaleidoscope GKD-C Trend Direction is a confirmation module included in Loxx's "Giga Kaleidoscope Modularized Trading System."
█ GKD-C Trend Direction
Trend Direction relies both on the Average True Range (ATR) – a measure of market volatility – and the market's closing price. If ATR Smoothing is set to greater than 0, the ATR is smoothed using an Exponential Moving Average (EMA). This ATR is then multiplied by a factor to derive a threshold. Using this threshold and the market's close price, the code determines the position of the plotted line. The plotted line's color changes based on the close price's relationship to this derived value: green if the close price is above, and red if below, signifying the trend's upward or downward direction respectively.
█ Giga Kaleidoscope Modularized Trading System
Core components of an NNFX algorithmic trading strategy
The NNFX algorithm is built on the principles of trend, momentum, and volatility. There are six core components in the NNFX trading algorithm:
1. Volatility - price volatility; e.g., Average True Range, True Range Double, Close-to-Close, etc.
2. Baseline - a moving average to identify price trend
3. Confirmation 1 - a technical indicator used to identify trends
4. Confirmation 2 - a technical indicator used to identify trends
5. Continuation - a technical indicator used to identify trends
6. Volatility/Volume - a technical indicator used to identify volatility/volume breakouts/breakdown
7. Exit - a technical indicator used to determine when a trend is exhausted
8. Metamorphosis - a technical indicator that produces a compound signal from the combination of other GKD indicators*
*(not part of the NNFX algorithm)
What is Volatility in the NNFX trading system?
In the NNFX (No Nonsense Forex) trading system, ATR (Average True Range) is typically used to measure the volatility of an asset. It is used as a part of the system to help determine the appropriate stop loss and take profit levels for a trade. ATR is calculated by taking the average of the true range values over a specified period.
True range is calculated as the maximum of the following values:
-Current high minus the current low
-Absolute value of the current high minus the previous close
-Absolute value of the current low minus the previous close
ATR is a dynamic indicator that changes with changes in volatility. As volatility increases, the value of ATR increases, and as volatility decreases, the value of ATR decreases. By using ATR in NNFX system, traders can adjust their stop loss and take profit levels according to the volatility of the asset being traded. This helps to ensure that the trade is given enough room to move, while also minimizing potential losses.
Other types of volatility include True Range Double (TRD), Close-to-Close, and Garman-Klass
What is a Baseline indicator?
The baseline is essentially a moving average, and is used to determine the overall direction of the market.
The baseline in the NNFX system is used to filter out trades that are not in line with the long-term trend of the market. The baseline is plotted on the chart along with other indicators, such as the Moving Average (MA), the Relative Strength Index (RSI), and the Average True Range (ATR).
Trades are only taken when the price is in the same direction as the baseline. For example, if the baseline is sloping upwards, only long trades are taken, and if the baseline is sloping downwards, only short trades are taken. This approach helps to ensure that trades are in line with the overall trend of the market, and reduces the risk of entering trades that are likely to fail.
By using a baseline in the NNFX system, traders can have a clear reference point for determining the overall trend of the market, and can make more informed trading decisions. The baseline helps to filter out noise and false signals, and ensures that trades are taken in the direction of the long-term trend.
What is a Confirmation indicator?
Confirmation indicators are technical indicators that are used to confirm the signals generated by primary indicators. Primary indicators are the core indicators used in the NNFX system, such as the Average True Range (ATR), the Moving Average (MA), and the Relative Strength Index (RSI).
The purpose of the confirmation indicators is to reduce false signals and improve the accuracy of the trading system. They are designed to confirm the signals generated by the primary indicators by providing additional information about the strength and direction of the trend.
Some examples of confirmation indicators that may be used in the NNFX system include the Bollinger Bands, the MACD (Moving Average Convergence Divergence), and the MACD Oscillator. These indicators can provide information about the volatility, momentum, and trend strength of the market, and can be used to confirm the signals generated by the primary indicators.
In the NNFX system, confirmation indicators are used in combination with primary indicators and other filters to create a trading system that is robust and reliable. By using multiple indicators to confirm trading signals, the system aims to reduce the risk of false signals and improve the overall profitability of the trades.
What is a Continuation indicator?
In the NNFX (No Nonsense Forex) trading system, a continuation indicator is a technical indicator that is used to confirm a current trend and predict that the trend is likely to continue in the same direction. A continuation indicator is typically used in conjunction with other indicators in the system, such as a baseline indicator, to provide a comprehensive trading strategy.
What is a Volatility/Volume indicator?
Volume indicators, such as the On Balance Volume (OBV), the Chaikin Money Flow (CMF), or the Volume Price Trend (VPT), are used to measure the amount of buying and selling activity in a market. They are based on the trading volume of the market, and can provide information about the strength of the trend. In the NNFX system, volume indicators are used to confirm trading signals generated by the Moving Average and the Relative Strength Index. Volatility indicators include Average Direction Index, Waddah Attar, and Volatility Ratio. In the NNFX trading system, volatility is a proxy for volume and vice versa.
By using volume indicators as confirmation tools, the NNFX trading system aims to reduce the risk of false signals and improve the overall profitability of trades. These indicators can provide additional information about the market that is not captured by the primary indicators, and can help traders to make more informed trading decisions. In addition, volume indicators can be used to identify potential changes in market trends and to confirm the strength of price movements.
What is an Exit indicator?
The exit indicator is used in conjunction with other indicators in the system, such as the Moving Average (MA), the Relative Strength Index (RSI), and the Average True Range (ATR), to provide a comprehensive trading strategy.
The exit indicator in the NNFX system can be any technical indicator that is deemed effective at identifying optimal exit points. Examples of exit indicators that are commonly used include the Parabolic SAR, the Average Directional Index (ADX), and the Chandelier Exit.
The purpose of the exit indicator is to identify when a trend is likely to reverse or when the market conditions have changed, signaling the need to exit a trade. By using an exit indicator, traders can manage their risk and prevent significant losses.
In the NNFX system, the exit indicator is used in conjunction with a stop loss and a take profit order to maximize profits and minimize losses. The stop loss order is used to limit the amount of loss that can be incurred if the trade goes against the trader, while the take profit order is used to lock in profits when the trade is moving in the trader's favor.
Overall, the use of an exit indicator in the NNFX trading system is an important component of a comprehensive trading strategy. It allows traders to manage their risk effectively and improve the profitability of their trades by exiting at the right time.
What is an Metamorphosis indicator?
The concept of a metamorphosis indicator involves the integration of two or more GKD indicators to generate a compound signal. This is achieved by evaluating the accuracy of each indicator and selecting the signal from the indicator with the highest accuracy. As an illustration, let's consider a scenario where we calculate the accuracy of 10 indicators and choose the signal from the indicator that demonstrates the highest accuracy.
The resulting output from the metamorphosis indicator can then be utilized in a GKD-BT backtest by occupying a slot that aligns with the purpose of the metamorphosis indicator. The slot can be a GKD-B, GKD-C, or GKD-E slot, depending on the specific requirements and objectives of the indicator. This allows for seamless integration and utilization of the compound signal within the GKD-BT framework.
How does Loxx's GKD (Giga Kaleidoscope Modularized Trading System) implement the NNFX algorithm outlined above?
Loxx's GKD v2.0 system has five types of modules (indicators/strategies). These modules are:
1. GKD-BT - Backtesting module (Volatility, Number 1 in the NNFX algorithm)
2. GKD-B - Baseline module (Baseline and Volatility/Volume, Numbers 1 and 2 in the NNFX algorithm)
3. GKD-C - Confirmation 1/2 and Continuation module (Confirmation 1/2 and Continuation, Numbers 3, 4, and 5 in the NNFX algorithm)
4. GKD-V - Volatility/Volume module (Confirmation 1/2, Number 6 in the NNFX algorithm)
5. GKD-E - Exit module (Exit, Number 7 in the NNFX algorithm)
6. GKD-M - Metamorphosis module (Metamorphosis, Number 8 in the NNFX algorithm, but not part of the NNFX algorithm)
(additional module types will added in future releases)
Each module interacts with every module by passing data to A backtest module wherein the various components of the GKD system are combined to create a trading signal.
That is, the Baseline indicator passes its data to Volatility/Volume. The Volatility/Volume indicator passes its values to the Confirmation 1 indicator. The Confirmation 1 indicator passes its values to the Confirmation 2 indicator. The Confirmation 2 indicator passes its values to the Continuation indicator. The Continuation indicator passes its values to the Exit indicator, and finally, the Exit indicator passes its values to the Backtest strategy.
This chaining of indicators requires that each module conform to Loxx's GKD protocol, therefore allowing for the testing of every possible combination of technical indicators that make up the six components of the NNFX algorithm.
What does the application of the GKD trading system look like?
Example trading system:
Backtest: Multi-Ticker CC Backtest
Baseline: Hull Moving Average
Volatility/Volume: Hurst Exponent
Confirmation 1: Advance Trend Pressure as shown on the chart above
Confirmation 2: uf2018
Continuation: Coppock Curve
Exit: Rex Oscillator
Metamorphosis: Baseline Optimizer
Each GKD indicator is denoted with a module identifier of either: GKD-BT, GKD-B, GKD-C, GKD-V, GKD-M, or GKD-E. This allows traders to understand to which module each indicator belongs and where each indicator fits into the GKD system.
█ Giga Kaleidoscope Modularized Trading System Signals
Standard Entry
1. GKD-C Confirmation gives signal
2. Baseline agrees
3. Price inside Goldie Locks Zone Minimum
4. Price inside Goldie Locks Zone Maximum
5. Confirmation 2 agrees
6. Volatility/Volume agrees
1-Candle Standard Entry
1a. GKD-C Confirmation gives signal
2a. Baseline agrees
3a. Price inside Goldie Locks Zone Minimum
4a. Price inside Goldie Locks Zone Maximum
Next Candle
1b. Price retraced
2b. Baseline agrees
3b. Confirmation 1 agrees
4b. Confirmation 2 agrees
5b. Volatility/Volume agrees
Baseline Entry
1. GKD-B Baseline gives signal
2. Confirmation 1 agrees
3. Price inside Goldie Locks Zone Minimum
4. Price inside Goldie Locks Zone Maximum
5. Confirmation 2 agrees
6. Volatility/Volume agrees
7. Confirmation 1 signal was less than 'Maximum Allowable PSBC Bars Back' prior
1-Candle Baseline Entry
1a. GKD-B Baseline gives signal
2a. Confirmation 1 agrees
3a. Price inside Goldie Locks Zone Minimum
4a. Price inside Goldie Locks Zone Maximum
5a. Confirmation 1 signal was less than 'Maximum Allowable PSBC Bars Back' prior
Next Candle
1b. Price retraced
2b. Baseline agrees
3b. Confirmation 1 agrees
4b. Confirmation 2 agrees
5b. Volatility/Volume agrees
Volatility/Volume Entry
1. GKD-V Volatility/Volume gives signal
2. Confirmation 1 agrees
3. Price inside Goldie Locks Zone Minimum
4. Price inside Goldie Locks Zone Maximum
5. Confirmation 2 agrees
6. Baseline agrees
7. Confirmation 1 signal was less than 7 candles prior
1-Candle Volatility/Volume Entry
1a. GKD-V Volatility/Volume gives signal
2a. Confirmation 1 agrees
3a. Price inside Goldie Locks Zone Minimum
4a. Price inside Goldie Locks Zone Maximum
5a. Confirmation 1 signal was less than 'Maximum Allowable PSVVC Bars Back' prior
Next Candle
1b. Price retraced
2b. Volatility/Volume agrees
3b. Confirmation 1 agrees
4b. Confirmation 2 agrees
5b. Baseline agrees
Confirmation 2 Entry
1. GKD-C Confirmation 2 gives signal
2. Confirmation 1 agrees
3. Price inside Goldie Locks Zone Minimum
4. Price inside Goldie Locks Zone Maximum
5. Volatility/Volume agrees
6. Baseline agrees
7. Confirmation 1 signal was less than 7 candles prior
1-Candle Confirmation 2 Entry
1a. GKD-C Confirmation 2 gives signal
2a. Confirmation 1 agrees
3a. Price inside Goldie Locks Zone Minimum
4a. Price inside Goldie Locks Zone Maximum
5a. Confirmation 1 signal was less than 'Maximum Allowable PSC2C Bars Back' prior
Next Candle
1b. Price retraced
2b. Confirmation 2 agrees
3b. Confirmation 1 agrees
4b. Volatility/Volume agrees
5b. Baseline agrees
PullBack Entry
1a. GKD-B Baseline gives signal
2a. Confirmation 1 agrees
3a. Price is beyond 1.0x Volatility of Baseline
Next Candle
1b. Price inside Goldie Locks Zone Minimum
2b. Price inside Goldie Locks Zone Maximum
3b. Confirmation 1 agrees
4b. Confirmation 2 agrees
5b. Volatility/Volume agrees
Continuation Entry
1. Standard Entry, 1-Candle Standard Entry, Baseline Entry, 1-Candle Baseline Entry, Volatility/Volume Entry, 1-Candle Volatility/Volume Entry, Confirmation 2 Entry, 1-Candle Confirmation 2 Entry, or Pullback entry triggered previously
2. Baseline hasn't crossed since entry signal trigger
4. Confirmation 1 agrees
5. Baseline agrees
6. Confirmation 2 agrees

Market TrendMarket Trend by Trading Ninjaa
Description:
The "Market Trend" indicator is designed to provide traders with a clear visual representation of the prevailing market direction. By utilizing a higher timeframe moving average, this tool offers insights into the broader market trend. The indicator identifies:
Uptrends: When the price is above the higher timeframe moving average, the background is shaded green.
Downtrends: When the price is below the higher timeframe moving average, the background is shaded red.
Sideways Markets: Recognized by decreased volatility, these periods are shaded in gray.
Usage:
Green Background: Indicates bullish market conditions. Traders might consider long entries or avoiding short trades.
Red Background: Suggests bearish market conditions. Might be used as a signal to consider short entries or avoid long positions.
Gray Background: Highlights potential sideways or consolidating market conditions. Traders might exercise caution, considering range-bound strategies.
Tips:
This indicator is best used in conjunction with other technical tools for confirmation. Always backtest any new strategy involving this indicator before considering it for live trading.

Hybrid EMA AlgoLearner⭕️Innovative trading indicator that utilizes a k-NN-inspired algorithmic approach alongside traditional Exponential Moving Averages (EMAs) for more nuanced analysis. While the algorithm doesn't actually employ machine learning techniques, it mimics the logic of the k-Nearest Neighbors (k-NN) methodology. The script takes into account the closest 'k' distances between a short-term and long-term EMA to create a weighted short-term EMA. This combination of rule-based logic and EMA technicals offers traders a more sophisticated tool for market analysis.
⭕️Foundational EMAs: The script kicks off by generating a 50-period short-term EMA and a 200-period long-term EMA. These EMAs serve a dual purpose: they provide the basic trend-following capability familiar to most traders, akin to the classic EMA 50 and EMA 200, and set the stage for more intricate calculations to follow.
⭕️k-NN Integration: The indicator distinguishes itself by introducing k-NN (k-Nearest Neighbors) logic into the mix. This machine learning technique scans prior market data to find the closest 'neighbors' or distances between the two EMAs. The 'k' closest distances are then picked for further analysis, thus imbuing the indicator with an added layer of data-driven context.
⭕️Algorithmic Weighting: After the k closest distances are identified, they are utilized to compute a weighted EMA. Each of the k closest short-term EMA values is weighted by its associated distance. These weighted values are summed up and normalized by the sum of all chosen distances. The result is a weighted short-term EMA that packs more nuanced information than a simple EMA would.

TTP SuperTrend ADXThis indicator uses the strength of the trend from ADX to decide how the SuperTrend (ST) should behave.
Motivation
ST is a great trend following indicator but it's not capable of adapting to the trend strength.
The ADX, Average Directional Index measures the strength of the trend and can be use to dynamically tweak the ST factor so that it's sensitivity can adapt to the trend strength.
Implementation
The indicator calculates a normalised value of the ADX based on the data available in the chart.
Based on these values ST will use different factors to increase or reduce the factor use by ST: expansion or compression.
ST expansion vs compression
Expanding the ST would mean that the stronger a trends get the ST factor will grow causing it to distance further from the price delaying the next ST trend flip.
Compressing the ST would mean that the stronger a trends get the ST factor will shrink causing it to get closer to the price speeding up the next ST trend flip.
Features
- Alerts for trend flip
- Alerts for trend status
- Backtestable stream
- SuperTrend color gets more intense with the strength of the trend

Machine Learning Regression Trend [LuxAlgo]The Machine Learning Regression Trend tool uses random sample consensus (RANSAC) to fit and extrapolate a linear model by discarding potential outliers, resulting in a more robust fit.
🔶 USAGE
The proposed tool can be used like a regular linear regression, providing support/resistance as well as forecasting an estimated underlying trend.
Using RANSAC allows filtering out outliers from the input data of our final fit, by outliers we are referring to values deviating from the underlying trend whose influence on a fitted model is undesired. For financial prices and under the assumptions of segmented linear trends, these outliers can be caused by volatile moves and/or periodic variations within an underlying trend.
Adjusting the "Allowed Error" numerical setting will determine how sensitive the model is to outliers, with higher values returning a more sensitive model. The blue margin displayed shows the allowed error area.
The number of outliers in the calculation window (represented by red dots) can also be indicative of the amount of noise added to an underlying linear trend in the price, with more outliers suggesting more noise.
Compared to a regular linear regression which does not discriminate against any point in the calculation window, we see that the model using RANSAC is more conservative, giving more importance to detecting a higher number of inliners.
🔶 DETAILS
RANSAC is a general approach to fitting more robust models in the presence of outliers in a dataset and as such does not limit itself to a linear regression model.
This iterative approach can be summarized as follow for the case of our script:
Step 1: Obtain a subset of our dataset by randomly selecting 2 unique samples
Step 2: Fit a linear regression to our subset
Step 3: Get the error between the value within our dataset and the fitted model at time t , if the absolute error is lower than our tolerance threshold then that value is an inlier
Step 4: If the amount of detected inliers is greater than a user-set amount save the model
Repeat steps 1 to 4 until the set number of iterations is reached and use the model that maximizes the number of inliers
🔶 SETTINGS
Length: Calculation window of the linear regression.
Width: Linear regression channel width.
Source: Input data for the linear regression calculation.
🔹 RANSAC
Minimum Inliers: Minimum number of inliers required to return an appropriate model.
Allowed Error: Determine the tolerance threshold used to detect potential inliers. "Auto" will automatically determine the tolerance threshold and will allow the user to multiply it through the numerical input setting at the side. "Fixed" will use the user-set value as the tolerance threshold.
Maximum Iterations Steps: Maximum number of allowed iterations.

Colored VWAP and BarcolorThis indicator plots the Volume Weighted Average Price (VWAP) as well as changes the bar color if the current price is above or below VWAP, for quick visual reference.
Background Information
Straight from TradingView, "Volume Weighted Average Price (VWAP) is a technical analysis tool used to measure the average price weighted by volume. VWAP is typically used with intraday charts as a way to determine the general direction of intraday prices. It's similar to a moving average in that when price is above VWAP, prices are rising and when price is below VWAP, prices are falling. VWAP is primarily used by technical analysts to identify market trend."
About the Indicator
This indicator changes the VWAP line color and bar color based on the current price.
Bar Color
Bullish Up Candle Color = Current price is above VWAP and the close of the candle was greater than the open.
Bullish Down Candle Color = Current price is above VWAP and the close of the candle was less than the open.
Bearish Up Candle Color = Current price is below VWAP and the close of the candle was greater than the open.
Bearish Down Candle Color = Current price is below VWAP and the close of the candle was less than the open.

TICK Strength Background ShadeThis indicator shades the background of each candle based on the strength off the current TICK.US chart. User can define the strength levels, which are by default set to 1-299 (lightest), 300-599, and 600+ (darkest). Best used on lower timeframe charts to help identify whether or not to remain in a trend, or if a trend is possibly reversing when you start to see the opposite color begin to appear following a trend.

TEWY - Magic Momentum IndicatorMy goal is to equip every trader and investor with the essential tools necessary to confidently navigate the complexities of the financial markets, enabling them to consistently identify opportunities and maintain a position of strength on the winning side of their trades. This indicator stands as a potent tool, offering the capability to effectively assess longer-term momentum trends.
Allow me to provide some context regarding the genesis of this indicator. By keenly observing the pattern of momentum loss preceding each trend reversal, coupled with the notable decrease in the rate of price change, I've formulated this indicator. This design is rooted in the understanding that these dynamics hold key insights into the market's shifting trends.
So, I've developed this indicator with the purpose of granting you the ability to select and construct optional combinations of up to two comparable symbols. Through this, you gain a comprehensive and insightful perspective on the ever-evolving dynamics of the market.
This indicator acts like an oscillator and momentum line serves as a key determinant. When the line is positioned above 0, it signifies a positive momentum; conversely, if it rests below 0, it indicates a sideways to negative trend. This mechanism offers a clear and intuitive means of gauging prevailing market conditions.
Should you have any inquiries or require further clarification regarding this indicator, please do not hesitate to reach out to me via direct message. I am here to provide you with the necessary guidance and support to ensure your experience with this tool is both seamless and enriching. Your understanding and satisfaction remain my utmost priority.
By TEWY - Trade Easy With Yogesh
I am Yogesh

OrderBlock [kyleAlgo]The principle of this indicator
ATR (Average True Range) Setting: The code uses ATR to help calculate the Supertrend indicator.
Supertrend Trend Direction: Identify bullish and bearish trends with the Supertrend method.
Order Block Recognition: This part of the code recognizes and creates order blocks, visualizing them as boxes on the chart. If the number of blocks exceeds the maximum limit, old blocks will be deleted.
Function to prevent overlapping: check whether the new order block overlaps with the existing order block through the isOverlapping function.
Order block color setting: The code sets the color according to whether the block is bullish or bearish, and whether it breaks above or below. Afterwards the color of the existing order blocks will be updated.
Sensitivity settings: Through the input settings of factor and atrPeriod, the sensitivity of Supertrend and the detection of order blocks can be affected.
Visualization: Use TradingView's box.new function to draw and visualize order blocks on the chart.
Practicality:
Support and Resistance Levels: Order blocks may represent areas of support and resistance in the market. By visualizing these areas, traders can better understand when price reversals are likely to occur.
Trading Signals: Traders may be able to identify trading signals based on the color changes of blocks and price breakouts. For example, if the price breaks above a bullish block, this could be a signal to buy.
Risk Management: By using ATR to adjust the sensitivity of Supertrend, the symbol helps traders to adjust their strategies according to market volatility. This can be used as a risk management tool to help identify stop loss and take profit points.
Multi-timeframe analysis: Although the code itself does not implement multi-timeframe analysis directly, it can be done by applying this indicator on different timeframes. This helps to analyze the market from different angles.
Flexibility and Customization: Through sensitivity settings, traders can customize the indicator according to their needs and trading style.
Reduced screen clutter: By removing overlapping order blocks and limiting the maximum number of order blocks, this code helps reduce clutter on charts, allowing traders to analyze the market more clearly.
Overall, this "Pine Script" can be a powerful analytical tool for trend traders and those looking to improve their trading decisions by visualizing key market areas. It can be used alone or combined with other indicators and trading systems for enhanced functionality.

Intraday Direction Finder For Indices (Based On VWAP) Happy Independence Day..!!
------------------------------------------------------------------------
This indicator is based on the concept shared by "learntotrade365" to Find Intraday Direction for Index.
To decide the direction of Index we check whether the constituent Stocks are trading above VWAP or below VWAP.
Lets Consider Banknifty Example.
Banknifty Constituents are:
HDFC Bank
ICICI Bank
KOTAK Bank
SBI
AXIS Bank
IndusInd Bank
Based on concept, where above stocks are trading decides the direction as follows
Ratio Concept (Color)
6:0 Super Bullish (Lime)
5:1 Bullish(Green)
4:2 Mild Bullish (Aqua)
3:3 Sideways(Blue)
2:4 Mild Bearish ( Orange)
1:5 Bearish (Fuchsia)
0:6 Super Bearish (Red)
-------------------------------------------------------------------------
Features :-
1) Screener
In this Screener, we can clearly see which stock is trading above VWAP
& which is trading below VWAP along with ratio.
2) Chart Candle Colors
One can able to project candle colors according to Ratio colors.
3)Chart Background Color
One can set background color of chart if he is required.
------------------------------------------------------------------------
Same this can be used with other indices also like Nifty, Finnifty etc.
-------------------------------------------------------------------------
Thanks For Reading Till here...!!
------------------------------------------------------------------------
Kindly share your feedback or any suggestions.
------------------------------------------------------------------------

Fibo Levels with Volume Profile and Targets [ChartPrime]The Fib Levels With Volume Profile and Targets (FIVP) is a trading tool designed to provide traders with a unique understanding of price movement and trading volume through the lens of Fibonacci levels. This dynamic indicator merges the concepts of Fibonacci retracement levels with trading volume analytics to offer predictive insights into potential price trajectories.
Features:
1. Fibonacci Levels: The FPI showcases three prominent Fibonacci levels on both sides of the current price, offering an intricate picture of potential support and resistance levels.
2. Support and Resistance Recognition: Harnessing the power of Fibonacci levels, the FPI provides traders with potential areas of support and resistance, aiding in informed decision-making for entries, exits, and stop placements.
3. Customizable Timeframe Settings: In order to cater to different trading strategies and styles, users can manually select their preferred timeframe for the Fibonacci calculations, ensuring optimal relevance and accuracy for their trading approach.
4. Volume Analytics: One of the standout features of the FIVP is its ability to calculate trading volume for every bar that is sandwiched between the top and lower Fibonacci levels. This ensures traders have a clear vision of where the majority of trading activity is occurring, lending weight to the credibility of the displayed support and resistance zones.
5. Volume-Derived Price Targeting: The Possible Target Arrow function is an innovative feature. By analyzing and comparing the trading volume in the bearish and bullish zones, it provides an arrow indicating the potential direction the market might take. If the bull volume surpasses the bear volume, the market is likely skewing bullish and vice versa.
Usage
Ideal for both novice and seasoned traders, the FPI offers a rich tapestry of information. It allows for refined technical analysis, more precise entries and exits, and a holistic view of the interplay between price and trading volume. Whether you're scalping, day trading, or swing trading, the Fibonacci Profile Indicator is designed to enhance your trading strategy, providing a comprehensive perspective of the market's potential movements.

LNL Trend SystemLNL Trend System is an ATR based day trading system specifically designed for intra-day traders and scalpers. The System works on any chart time frame & can be applied to any market. The study consist of two components - the Trend Line and the Stop Line. Trend System is based on a special ATR calculation that is achieved by combining the previous values of the 13 EMA in relation to the ATR which creates a line of deviations that visually look similar to the basic moving average but actually produce very different results ESPECIALLY in sideways market.
Trend Line:
Trend Line is a simple line which is basically a fast gauge represented by the 13 EMA that can change the color based on the current trend structure defined by multiple averages (8,13,21,34 EMAs). Trend Line is there to simply add the confluence for the current trend. Colors of the line are pretty much self-explanatory. Whenever the line turns red it states that the current structure is bearish. Vice versa for green line. Gray line represents neutral market structure.
Stop Line:
Stop Line is an ATR deviaton line with special calculation based on the previous bar ATRs and position of the price in relation to the current and previous values of 13 EMA. As already stated, this creates an ATR deviation marker either above or below the price that trails the price up or down until they touch. Whenever the price comes into the Stop Line it means it is making an ATR expansion move up or down .This touch will usually resolve into a reaction (a bounce) which provides trade opportunities.
Trend Bars:
When turned ON, Trend Bars can provide additional confulence of the current trend alongside with the Trend Line color. Trend Bars are based on the DMI and ADX indicators. Whenever the DMI is bearish and ADX is above 20 the candles paint themselfs red. And vice versa applies for the green candles and bullish DMI. Whenever the ADX falls below the 20, candles are netural (Gray) which means there is no real trend in place at the moment.
Trend Mode:
There are total of 5 different trend modes available. Each mode is visualizing different ATR settings which provides either aggressive or more conservative approach. The more tigher the mode, the more closer the distance between the price and the Stop Line. First two modes were designed for slower markets, whereas the "Loose" and "FOMC" modes are more suitable for products with high volatility.
Trend Modes:
1. Tight
Ideal for the slowest markets. Slowest market can be any market with unusually small average true range values or just simply a market that does have a personality of a "sleeper". Tight Mode can be also used for aggresive entries in the most ridiculous trends. Sometimes price will barely pullback to the Trend Line not even the Stop Line.
2. Normal
Normal Mode is the golden mean between the modes. "Normal" provides the ideal ATR lengths for the most used markets such as S&P Futures (ES) or SPY, AAPL and plenty of other highly popular stocks. More often than not, the length of this mode is respected considering there is no breaking news or high impact market event scheduled.
3. Loose
The "Loose" mode is basically a normal mode but a little bit more loose. This mode is useful whenever the ATRs jump higher than usual or during the days of highly anticipated news events. This mode is also better suited for more active markets such as NQ futures.
4. FOMC
The FOMC mode is called FOMC for a reason. This mode provides the maximum amount of wiggle room between the price and the Stop Line. This mode was designed for the extreme volatility, breaking news events or post-FOMC trading. If the market quiets down, this mode will not get the Stop Line touch as frequently as othete modes, thus it is not very useful to run this on markets with the average volatlity. Although never properly tested, perhaps the FOMC mode can find its value in the crypto market?
5. The Net
The net mode is basically a combination of all modes into one stop line system which creates "the net" effect. The Net provides the widest Stop Line zone which can be mainly appreciated by traders that like to use scale-in scale-out methods for their trading. Not to mention the visual side of the indicator which looks pretty great with the net mode on.
HTF (Higher Time Frame) Trend System:
The system also includes additional higher time frame (HTF) trend system. This can be set to any time frame by manual HTF mode. HTF mode set to "auto" will automatically choose the best suitable higher time frame trend system based on how appropriate the aggregation is. For everything below 5min the HTF Trend System will stay on 5min. Anything between 5-15min = 30min. 30min - 120min will turn on the 240min. 180min and higher will result in Daily time frame. Anything above the Daily will result in Weekly HTF aggregation, above W = Monthly, above M = Quarterly.
Background Clouds:
In terms of visualization, each trend system is fully customizable through the inputs settings. There is also an option to turn on/off the background clouds behind the stop lines. These clouds can make the charts more clean & visible.
Tips & Tricks:
1. Different Trend Modes
Try out different modes in different markets. There is no one single mode that will fit to everyone on the same type of market. I myself actually prefer more Loose than the Normal.
2. Stop Line Mirroring
Whenever the Stop Lines start to mirror each other (there is one above the price and one below) this means the price is entering a ranging sideways market. It does not matter which Stop Line will the price touch first. They can both be faded until one of them flips.
3. Signs of the Ranging Market
Watch out for signs of ranging market. Whenever the Trend System looses its colors whether on trend line or trend bars, if everything turns neutral (gray) that is usually a solid indication of a range type action for the following moments. Also as already stated before, the Stop Line mirroring is a good sign of the range market.
4. Trailing Tool, Trend System as an Additional Study?
In case you are not a fan of the colorful green / red charts & candles. You can switch all of them off and just leave the Stop Line on. This way you can use the benefits of the trend system and still use other studies on top of that. Similarly as the Parabolic SAR is often used.
5. The Flip Setup
One of my favorite trades is the Flip Setup on the 5min charts. Whenever the Stop Line is broken , the very first opposing touch after the Trend System flips is a usually a highly participated touch. If there is a strong reaction, this means this is likely a beginning of a new trend. Once I am in the position i like to trail the Stop Line on the 1min charts.
Hope it helps.

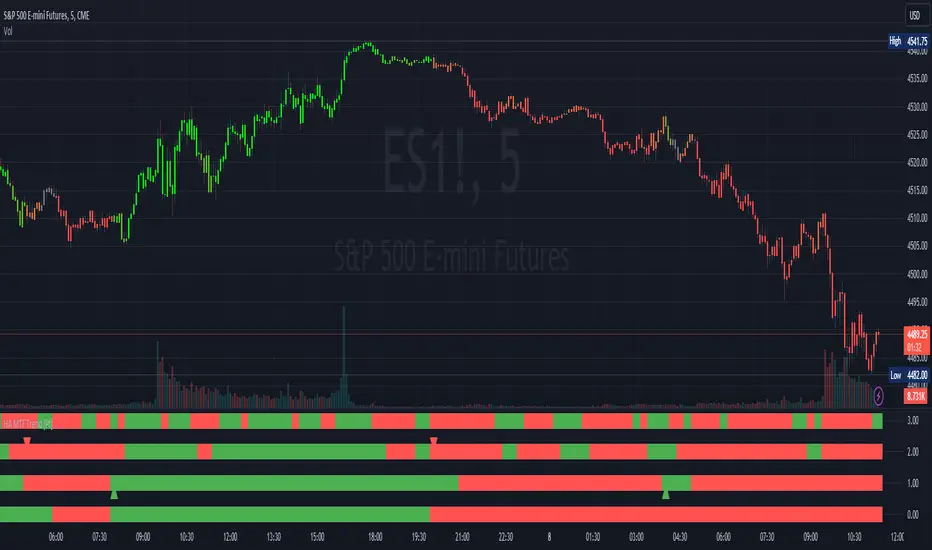
Heikin Ashi MTF Trend [Pt]█ Introduction
The Heikin Ashi MTF Trend indicator takes a simple approach to understand the trend by visualizing Heikin Ashi candle colors across multiple timeframes and representing it in a simple and visual manner. It utilizes the Heikin Ashi (HA) candles across four custom timeframes to detect trend shifts and strength. The indicator also offers alert conditions for potential bullish and bearish trend shifts.
█ Features
► Multiple Timeframes (MTF) Trend Detection: The script fetches HA data from four different timeframes. This multi-timeframe approach gives a holistic view of the market sentiment.
► Weighted Trend Score: The individual trend scores of the four timeframes are multiplied with their respective weights and summed up to provide a cumulative trend score that is used to determine bar colors and trend shifts.
► Visual Trend Depiction : It displays the trend using default green/red squares for each timeframe and a gradient-filled bar to represent the cumulative trend score.
► Trend Change Alerts: Users can set alerts for bullish and bearish trend shifts.
█ Alerts
◊ Bull Trend Signal Alert: Alert when there is a bullish trend shift.
◊ Bear Trend Signal Alert: Alert when there is a bearish trend shift.
█ Usage Tips
◊ The greater the discrepancy in the weights across the timeframes, the more emphasis is placed on the higher weighted timeframe.
◊ While the gradient bar provides a quick trend overview, it's essential to view the trend squares to understand the individual timeframe sentiments.
◊ Always consider using this tool in conjunction with other indicators or methods for confirmation and enhanced trading strategy.
Happy Trading~~
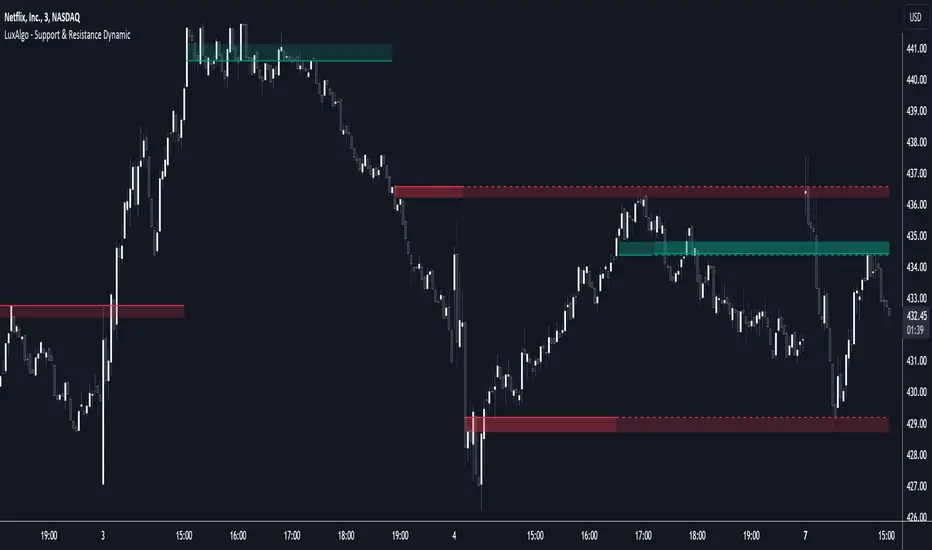
Support & Resistance Dynamic [LuxAlgo]The Support & Resistance Dynamic indicator aims to return real-time predictive support and resistance zones that are relevant to a detected trend. This makes this indicator similar to our previously published Predictive Ranges indicator.
Users can additionally extend the most recent historical support and resistance zones.
🔶 USAGE
Hypothetical resistance levels in an up-trend or supports in a down-trend would tend to be broken more easily, as such the indicator primary objective is to return reliable real-time support and resistance levels by taking this into account.
When the market is up-trending the indicator will only return support zones, while a down-trending market will cause the indicator to only return resistance zones.
If the price significantly breaks a support/resistance, rendering it unreliable, it can be a sign of a potential reversal.
Users can return support/resistance levels/zones for shorter-term trends by reducing the Multiplicative Factor setting.
🔹 Extension
Users can extend past estimated support/resistance levels, the amount of extended levels is determined by the users. Certain levels can stay relevant in the future, and can also aid in measuring the significance of a breakout, with further past levels being reached being indicative of more significant trends.
🔶 DETAILS
To determine if the price is up-trending or down-trending in order to show either support or resistance, the same method used in the predictive ranges script is used. A central tendency is estimated, if price significantly deviates from it upward an uptrend is detected, else a significant deviation downward would indicate a downtrend.
The central tendency estimate is used for the construction of the support and resistance levels.
🔶 SETTINGS
Multiplicative Factor: Determines the frequency at which new supports/resistances are returned, with lower values returning more frequent levels/zones.
ATR Length: ATR averaging length used as deviation threshold for the central tendency estimate.
Extend Last: Determines the amount of most recent historical supports/resistances to extend to the latest bar.
Multi-Timeframe Trend Detector [Alifer]Here is an easy-to-use and customizable multi-timeframe visual trend indicator.
The indicator combines Exponential Moving Averages (EMA), Moving Average Convergence Divergence (MACD), and Relative Strength Index (RSI) to determine the trend direction on various timeframes: 15 minutes (15M), 30 minutes (30M), 1 hour (1H), 4 hours (4H), 1 day (1D), and 1 week (1W).
EMA Trend : The script calculates two EMAs for each timeframe: a fast EMA and a slow EMA. If the fast EMA is greater than the slow EMA, the trend is considered Bullish; if the fast EMA is less than the slow EMA, the trend is considered Bearish.
MACD Trend : The script calculates the MACD line and the signal line for each timeframe. If the MACD line is above the signal line, the trend is considered Bullish; if the MACD line is below the signal line, the trend is considered Bearish.
RSI Trend : The script calculates the RSI for each timeframe. If the RSI value is above a specified Bullish level, the trend is considered Bullish; if the RSI value is below a specified Bearish level, the trend is considered Bearish. If the RSI value is between the Bullish and Bearish levels, the trend is Neutral, and no arrow is displayed.
Dashboard Display :
The indicator prints arrows on the dashboard to represent Bullish (▲ Green) or Bearish (▼ Red) trends for each timeframe.
You can easily adapt the Dashboard colors (Inputs > Theme) for visibility depending on whether you're using a Light or Dark theme for TradingView.
Usage :
You can adjust the indicator's settings such as theme (Dark or Light), EMA periods, MACD parameters, RSI period, and Bullish/Bearish levels to adapt it to your specific trading strategies and preferences.
Disclaimer :
This indicator is designed to quickly help you identify the trend direction on multiple timeframes and potentially make more informed trading decisions.
You should consider it as an extra tool to complement your strategy, but you should not solely rely on it for making trading decisions.
Always perform your own analysis and risk management before executing trades.
The indicator will only show a Dashboard. The EMAs, RSI and MACD you see on the chart image have been added just to demonstrate how the script works.
DETAILED SCRIPT EXPLANATION
INPUTS:
theme : Allows selecting the color theme (options: "Dark" or "Light").
emaFastPeriod : The period for the fast EMA.
emaSlowPeriod : The period for the slow EMA.
macdFastLength : The fast length for MACD calculation.
macdSlowLength : The slow length for MACD calculation.
macdSignalLength : The signal length for MACD calculation.
rsiPeriod : The period for RSI calculation.
rsiBullishLevel : The level used to determine Bullish RSI condition, when RSI is above this value. It should always be higher than rsiBearishLevel.
rsiBearishLevel : The level used to determine Bearish RSI condition, when RSI is below this value. It should always be lower than rsiBullishLevel.
CALCULATIONS:
The script calculates EMAs on multiple timeframes (15-minute, 30-minute, 1-hour, 4-hour, daily, and weekly) using the request.security() function.
Similarly, the script calculates MACD values ( macdLine , signalLine ) on the same multiple timeframes using the request.security() function along with the ta.macd() function.
RSI values are also calculated for each timeframe using the request.security() function along with the ta.rsi() function.
The script then determines the EMA trends for each timeframe by comparing the fast and slow EMAs using simple boolean expressions.
Similarly, it determines the MACD trends for each timeframe by comparing the MACD line with the signal line.
Lastly, it determines the RSI trends for each timeframe by comparing the RSI values with the Bullish and Bearish RSI levels.
PLOTTING AND DASHBOARD:
Color codes are defined based on the EMA, MACD, and RSI trends for each timeframe. Green for Bullish, Red for Bearish.
A dashboard is created using the table.new() function, displaying the trend information for each timeframe with arrows representing Bullish or Bearish conditions.
The dashboard will appear in the top-right corner of the chart, showing the Bullish and Bearish trends for each timeframe (15M, 30M, 1H, 4H, 1D, and 1W) based on EMA, MACD, and RSI analysis. Green arrows represent Bullish trends, red arrows represent Bearish trends, and no arrows indicate Neutral conditions.
INFO ON USED INDICATORS:
1 — EXPONENTIAL MOVING AVERAGE (EMA)
The Exponential Moving Average (EMA) is a type of moving average (MA) that places a greater weight and significance on the most recent data points.
The EMA is calculated by taking the average of the true range over a specified period. The true range is the greatest of the following:
The difference between the current high and the current low.
The difference between the previous close and the current high.
The difference between the previous close and the current low.
The EMA can be used by traders to produce buy and sell signals based on crossovers and divergences from the historical average. Traders often use several different EMA lengths, such as 10-day, 50-day, and 200-day moving averages.
The formula for calculating EMA is as follows:
Compute the Simple Moving Average (SMA).
Calculate the multiplier for weighting the EMA.
Calculate the current EMA using the following formula:
EMA = Closing price x multiplier + EMA (previous day) x (1-multiplier)
2 — MOVING AVERAGE CONVERGENCE DIVERGENCE (MACD)
The Moving Average Convergence Divergence (MACD) is a popular trend-following momentum indicator used in technical analysis. It helps traders identify changes in the strength, direction, momentum, and duration of a trend in a financial instrument's price.
The MACD is calculated by subtracting a longer-term Exponential Moving Average (EMA) from a shorter-term EMA. The most commonly used time periods for the MACD are 26 periods for the longer EMA and 12 periods for the shorter EMA. The difference between the two EMAs creates the main MACD line.
Additionally, a Signal Line (usually a 9-period EMA) is computed, representing a smoothed version of the MACD line. Traders watch for crossovers between the MACD line and the Signal Line, which can generate buy and sell signals. When the MACD line crosses above the Signal Line, it generates a bullish signal, indicating a potential uptrend. Conversely, when the MACD line crosses below the Signal Line, it generates a bearish signal, indicating a potential downtrend.
In addition to the MACD line and Signal Line crossovers, traders often look for divergences between the MACD and the price chart. Divergence occurs when the MACD is moving in the opposite direction of the price, which can suggest a potential trend reversal.
3 — RELATIVE STRENGHT INDEX (RSI):
The Relative Strength Index (RSI) is another popular momentum oscillator used by traders to assess the overbought or oversold conditions of a financial instrument. The RSI ranges from 0 to 100 and measures the speed and change of price movements.
The RSI is calculated based on the average gain and average loss over a specified period, commonly 14 periods. The formula involves several steps:
Calculate the average gain over the specified period.
Calculate the average loss over the specified period.
Calculate the relative strength (RS) by dividing the average gain by the average loss.
Calculate the RSI using the following formula: RSI = 100 - (100 / (1 + RS))
The RSI oscillates between 0 and 100, where readings above 70 are considered overbought, suggesting that the price may have risen too far and could be due for a correction. Readings below 30 are considered oversold, suggesting that the price may have dropped too much and could be due for a rebound.
Traders often use the RSI to identify potential trend reversals. For example, when the RSI crosses above 30 from below, it may indicate the start of an uptrend, and when it crosses below 70 from above, it may indicate the start of a downtrend. Additionally, traders may look for bullish or bearish divergences between the RSI and the price chart, similar to the MACD analysis, to spot potential trend changes.

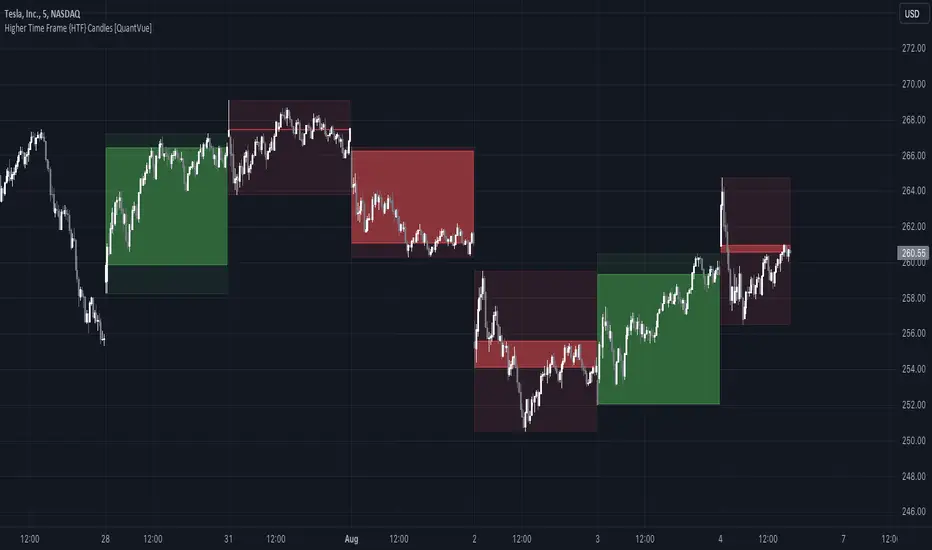
Higher Time Frame {HTF} Candles [QuantVue]Introducing the Higher Time Frame {HTF} Candles from QuantVue!
This script was developed to help you visually emphasize higher time frame (HTF) candles.
Higher time frames reduce the 'noise' inherent in lower time frames, providing a clearer, more accurate picture of the market's movements.
By examining higher time frames, you can better identify trends, reversals, and key areas of support and resistance.
The Higher Time Frame Candles indicator overlays higher time frame data directly onto your current chart.
You can easily specify the higher time frame candles you'd like to view, and the indicator will overlay the higher time frame candles directly over the corresponding current time frame bars.
This indicator by default will display the most current higher time frame candle plus the previous 5 candles.
Give this indicator a BOOST and COMMENT your thoughts!
We hope you enjoy.
Cheers.
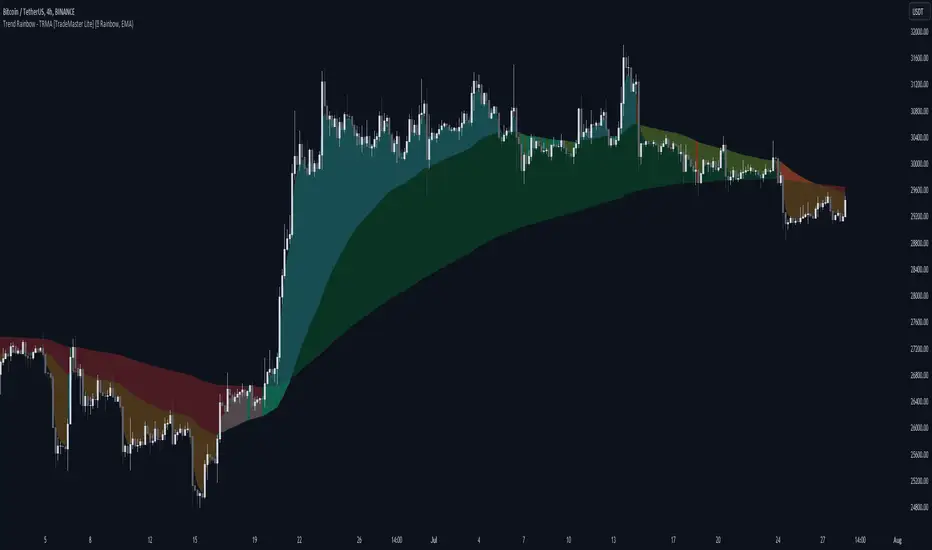
Trend Rainbow Moving Averages [TradeMaster Lite]The Trend Rainbow indicator is a simple technical analysis tool that uses moving averages to identify trends and potential buy and sell signals. It utilizes simple visualization techniques to present trend information in an intuitive, easily interpretable manner. This 21st-century tool is tailored for the modern trader who values both precision and simplicity.
The indicator uses our unique TRMA method to define short-term, intermediate, and long-term market trends. The TRMA (Trend Rainbow Moving Averages) is our own invention: a complex but flexible moving average matrix calculation that is designed to measure market trend direction, strength and shifting. Traders have the flexibility to choose from four types of moving average calculation bases to create a "rainbow".
👉 Example of usage:
General trend direction of the asset can be identified by looking at the slope of the rainbow. If the rainbow is generally pointing up, the asset is in an uptrend, if it is pointing down, the asset is in a downtrend. The indicator can also be used to assess the strength of a trend, identify potential resistance and support levels, and manage risk.
The Lite version of the indicator has 2 main trends to help you assess information about the direction and strength of asset's trend:
Intermediate trend: teal for bull trend, orange for bear trend.
Long-term trend: green for bull trend, red for bear trend.
Left side:
The image clearly shows that during the decline, the bearish intermediate trend was tested multiple times, acting as a resistance. This is a sign of weakness in the intermediate trend. The price did not have enough strength test the long-term trend yet, which is a sign that the long-term trend is still bearish.
Right side:
The intermediate trend first turned into neutral, then bullish. This is a sign of strength in the short-term and medium-term trends. This strength did not weaken and eventually. By maintaining the bullish intermediate trend, the long term trend was able to turn bullish again and a strong uptrend is now unfolding. This is a sign that the long-term trend is changing to bullish.
The Trend Rainbow also helps in risk management. On the right side of the chart the price is making a very steep move and both the intermediate and long-term trends are very far away from the current price. This shows us potential risk and the possibility of a deeper pullback. Trend edges can be used as potential entries or targets, depending on the situation.
👉 General advice
Confirming Signals with other indicators:
As with all technical indicators, it is important to confirm potential signals with other analytical tools, such as support and resistance levels, as well as indicators like RSI, MACD, and volume. This helps increase the probability of a successful trade.
Use proper risk management:
When using this or any other indicator, it is crucial to have proper risk management in place. Consider implementing stop-loss levels and thoughtful position sizing.
Combining with other technical indicators:
The indicator can be effectively used alongside other technical indicators to create a comprehensive trading strategy and provide additional confirmation.
Keep in Mind:
Remember that the example presented highlights how the Trend Rainbow indicator can be used. However, like all indicators, it is not a definitive market predictor. Thorough research and backtesting are essential before making any trading decisions. Furthermore, it's crucial to have a solid understanding of the indicator and its behavior. Additionally, incorporating fundamental analysis and considering market sentiment can be vital factors to take into account in your trading approach.
Limitations:
The indicators within the TradeMaster Lite package aim for simplicity and efficiency, while retaining their original purpose and value. Some settings, functions or visuals may be simpler than expected.
⭐ Conclusion
We hold the view that the true path to success is the synergy between the trader and the tool, contrary to the common belief that the tool itself is the sole determinant of profitability. The actual scenario is more nuanced than such an oversimplification. Our aim is to offer useful features that meet the needs of the 21st century and that we actually use.
🛑 Risk Notice:
Everything provided by trademasterindicator – from scripts, tools, and articles to educational materials – is intended solely for educational and informational purposes. Past performance does not assure future returns.
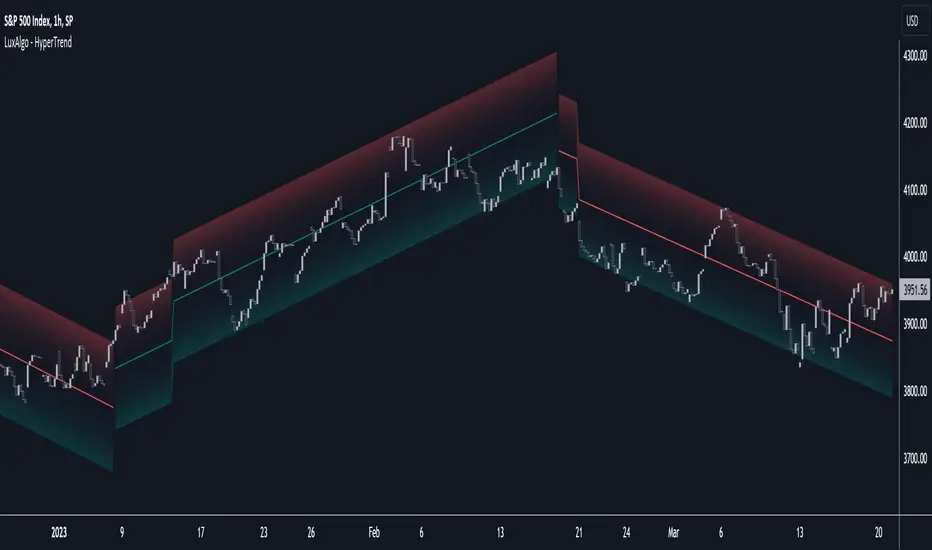
HyperTrend [LuxAlgo]The HyperTrend indicator aims to provide a real-time estimate of an underlying linear trend in the price. Support and resistance extremities are constructed from this estimate which can provide trade opportunities within the overall trend.
Most tools that return lines on a chart are either subject to backpainting or repainting. We aimed to provide a reliable real-time method to estimate linear trends in the price, enhancing traders' decision making processes when it comes to trading trends in price, hence the term 'HyperTrend'.
🔶 USAGE
Users can use the HyperTrend to easily determine the trend direction in the price, with an average sloping upward indicating an uptrend, and an average sloping downward indicating a downtrend.
The channels upper extremity can act as a resistance, while the lower extremity can act as a support. Contact with candle wicks can signal timely reversals/retracements.
Using a higher "Multiplicative Factor" value will return less frequent new channels, and is suitable to analyze longer-term trends. The slope settings on the other end allow us to control the slope of the returned channels, with higher values returning flatter results (similar to our previously posted predictive ranges).
🔹 Channel Average
The channel average can return an estimate of the current (and future) trend in the price, the chart below shows an interval where a linear regression is displayed alongside the channel average:
Unlike the linear regression, the average does not have any lookahead bias, this of course comes at the price of accuracy in most cases.
Users can also use this average as a support or resistance. The breakout of a TC average that has been tested multiple times can be considered more significant in suggesting a trend reversal.
🔶 SETTINGS
Multiplicative Factor: Control the allowed degree of deviation of the price from the average line. Higher values will return less frequent new channels.
Slope: Controls the steepness of the returned lines. Higher values will return flatter results.
Width %: Width percentage of the channel. Lower results will return narrower channels.
TradeMaster OscillatorTrading effectively requires a range of techniques, experience, and expertise. From technical analysis to market fundamentals, traders must navigate multiple factors, including market sentiment and economic conditions. However, traders often find themselves overwhelmed by market noise, making it challenging to filter out distractions and make informed decisions. To address this, we present a powerful indicator package designed to assist traders on their journey to success.
The TradeMaster indicator package encompasses a variety of trading strategies, including the SMC (Supply, Demand, and Price Action) approach, along with many other techniques. By leveraging concepts such as price action trading, support and resistance analysis, supply and demand dynamics, these indicators empower traders to analyze entry and exit positions with precision. Unlike other forms of technical analysis that produce values or plots based on historical price data, Price Action brings you the facts straight from the source - the current price movements.
The indicator package consists of three powerful indicators that can be used individually or together to maximize trading effectiveness.
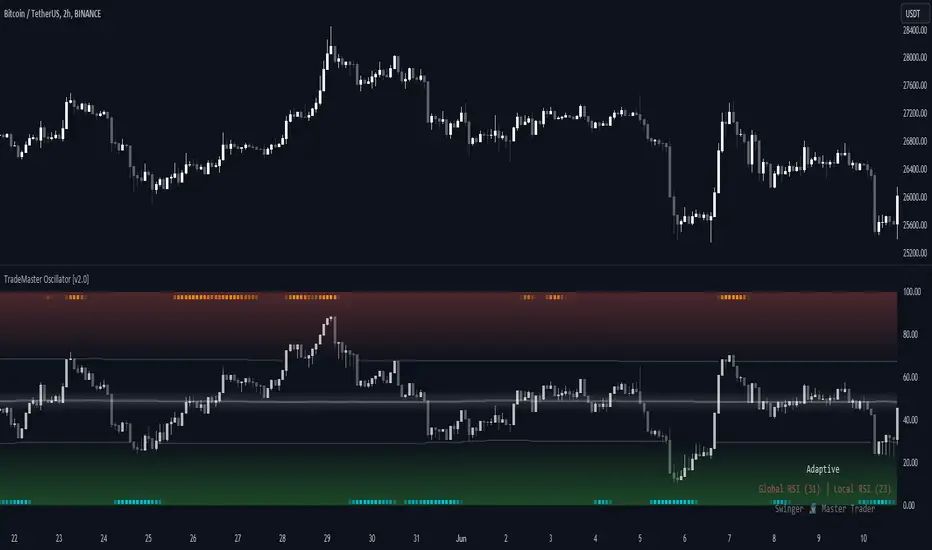
⭐ About the Oscillator Indicator
The Oscillator is an innovative and robust tool that encapsulates the principles of multiple technical analysis methodologies to enrich your trading strategy. By leveraging the combination of our six unique indicators, it can provide a comprehensive and multi-dimensional view of market dynamics.
👉 Usage - the general approach:
Utilize the Oscillator Indicator as a confirmational tool. The Oscillator acts as a tool to validate ideas and strategies. By analyzing the oscillator's readings, you gain additional insights into market momentum, overbought or oversold conditions, and potential trend reversals. This confirmation step helps you avoid false signals and make more informed trading choices.
👉 We are focusing on the default setting of the TradeMaster Oscillator, which incorporates the Global RSI* as main oscillator and Local RSI* as confirmational oscillator. This base configuration can be custom-tailored to your preference, leveraging the additional combination of our six unique indicators.
Understand the difference between Global and Local RSI: The Global RSI represents broad relative strength, while the Local RSI describes the relative strength within wider movements. It's like having both a macro and micro view of relative strength.
Identify extreme values in Local RSI: Look for extremes in the Local RSI (overbought/oversold in Stochastic RSI). These often indicate a turning point in the RSI, which naturally reflects in the price. The Local RSI extremes are shown as dots outside the Global RSI bands in a "heatmap" style.
Smooth your RSI: You have the option to smooth your RSI with your preferred smoothing method (SMA , SMMA, EMA, DEMA, TEMA, LSMA, HMA, VWMA, WMA) and length.
Please bear in mind that high smoothing values can make the standard RSI extremes (>70 or <30) suboptimal or even useless. To address this potential problem, Adaptive levels were introduced.
Adaptive key levels for more relevant extremes: enabling Adaptive levels recalibrates extremes based on the historical RSI turning points (typical median turning points), providing much more relevant reference points for overbought/oversold states in both Global and Local RSI. This function can be used without smoothing but rarely provides significant difference unless you experiment with the length of RSI calculation.
Incorporate multiple indicators: besides Global and Local RSI, you can display six different proprietary indicators in the main oscillator theme. By choosing from these, you can apply the confirming condition as well. These include Sentiment (Fear and greed), Momentum, Trend Strength, Volume, and Volatility. These indicators use our TRMA** method to provide a comprehensive overview of market dynamics.
Choose your Global RSI display style: the Global RSI can be represented in candle, bar, line or ribbon form. Candles and bars can be useful for detecting rejections of relative strength (wicks), similar to OHLC data. Sometimes there are "hidden rejections" visible in relative strength but not in OHLC data, which naturally presents an advantage.
Customize the colors: All colors can be adjusted from the input menu to suit your preferences. This personalization allows you to make the Oscillator clear and intuitive for your individual trading style as possible.
Monitor Real-time Indicator values: In the bottom right corner, you can view real-time color-coded indicator values. This feature gives you the ability to quickly assess the market's current conditions without needing to navigate away from the chart.
Use multiple indicators in conjunction: while each indicator within the Oscillator provides valuable insights, their true power lies in their combination. Identify alignment among indicators to validate potential trades. For instance, when a bullish sentiment indication aligns with a low volatility reading, it may suggest a favorable buying opportunity.
Consider the market context: while the Oscillator provides a robust set of tools, always consider other aspects of the market environment. Use the oscillator in conjunction with other technical, fundamental, or sentiment analysis methods to develop a comprehensive trading strategy.
🛑 Remember, the oscillator should be used as a confirmational tool in your overall trading strategy. Make reasonable use of all its features, and always keep risk management principles in mind.
* By default, these are fine-tuned RSI and Stochastic RSI indicators.
** TRMA (Trend Rainbow Moving Averages) is a complex but customizable moving average matrix calculation that is designed to accurately measure market trend direction, strength and shifting.
⭐ Conclusion
We hold the view that the true path to success is the synergy between the trader and the tool, contrary to the common belief that the tool itself is the sole determinant of profitability. The actual scenario is more nuanced than such an oversimplification. Our aim is to offer useful features that meet the needs of the 21st century and that we actually use.
🛑 Risk Notice:
Everything provided by trademasterindicator – from scripts, tools, and articles to educational materials – is intended solely for educational and informational purposes. Past performance does not assure future returns.
TradeMaster ProTrading effectively requires a range of techniques, experience, and expertise. From technical analysis to market fundamentals, traders must navigate multiple factors, including market sentiment and economic conditions. However, traders often find themselves overwhelmed by market noise, making it challenging to filter out distractions and make informed decisions. To address this, we present a powerful indicator package designed to assist traders on their journey to success.
The TradeMaster indicator package encompasses a variety of trading strategies, including the SMC (Supply, Demand, and Price Action) approach, along with many other techniques. By leveraging concepts such as price action trading, support and resistance analysis, supply and demand dynamics, these indicators can empower traders to analyze entry and exit positions with precision. Unlike other forms of technical analysis that produce values or plots based on historical price data, Price Action brings you the facts straight from the source - the current price movements.
The indicator package consists of three powerful indicators that can be used individually or together to maximize trading effectiveness.
⭐ About the Pro Indicator
The Pro indicator is the cornerstone of the package, offering a comprehensive range of functions. It's strength lies in our unique structure calculation, which is based on real price action data, capturing every ticks from small intraday fluctuations to the significant high timeframe movements. The Pro Indicator reflects our personal use and deep comprehension of Smart Money Concepts. It provides streamlined tools for tracking algorithmic trends with modern visualizations, without unnecessary clutter.
In the ever-evolving trading landscape, mainstream methods and strategies can quickly become outdated as they are widely adopted. Liquidity is constantly sought after, and the best source for this is exploring and exploiting trading strategies that are widely accepted and applied. Currently, one of these strategies is the SMC (Supply, Demand, and Price Action).
It's no coincidence that our educational materials incorporate concepts such as liquidity grabs (LG) and Smart Money Traps (SMT). As the application of SMC gains popularity among retail traders, trading with this approach becomes more challenging. Therefore, the recent focus has been on reforming the SMC methodology, as it is the only method that relies on real price movements and will always work when applied correctly.
▸ What does proper application of SMC entail?
Many SMC traders associate their key areas of interest with the market structure, which is generally considered acceptable. However, depending solely on a single foundation can lead to significant deviations, which may cause notable impacts on trading results. Moreover, if the basis for the market structure calculation is inaccurate, the consequences can be even more severe. It's akin to risking money on a lottery ticket, believing it will be a winner.
Our methodology is different, and it may ensure longevity in the financial markets. The structure remains crucial, but it is not the sole foundation of everything; instead, it serves as a validation tool. Each calculation, such as order blocks (OB), Fair Value Gaps (FVG), liquidity grabs (LG), range analysis, and more, is independent and unique, separate from the structure. However, validation must ultimately come from the structure itself.
We employ individual and high-quality filters: before a function calculation is validated by the structure, it must undergo rigorous testing based on its own set of validation conditions. This approach aims to enhance robustness and accuracy, providing traders with a reliable framework for making informed trading decisions.
▸ An example for structure validation: Order Block with "Swing Sensitivity"
These order blocks will only be displayed and utilized by the script if there is a swing structure validation with a valid break. In other words, the presence of a confirmed swing Change of Character (ChoCh) or Break of Structure (BoS) is essential for the Order Block to be considered valid and relevant.
This approach ensures that the order blocks are aligned with the overall market structure and are not based on isolated or unreliable price movements. Whether it's Fair Value Gaps (FVG), Liquidity Grabs (LG), Range calculations, or other functionalities, the same underlying principle holds true. The background structure calculation serves as a validation mechanism for the data and insights generated by these functions, ensuring they adhere to the specific criteria and rules established within our methodology. By incorporating this robust validation process, traders can have confidence in the reliability and accuracy of the information provided by the indicator, allowing them to make informed trading decisions based on validated data and analysis.
👉 Usage - the general approach:
Determine your trading style using the Pro Indicator and build your basic strategy. This indicator helps you understand your trading style, whether it's swing trading, scalping or another approach. By analyzing the Pro Indicator, you gain valuable information about potential market trends, entry and exit points, and overall market sentiment.
👉 Example of usage:
In the following chart, you'll notice how we've utilized the indicator to formulate a strategic trading approach. We've employed Order Blocks equipped with volume parameters to identify crucial market zones. Simultaneously, we've leveraged swing/internal market structures to gain insights into potential long and short-term market turnarounds. Lastly, we've examined trend line liquidity zones to pinpoint probable impulses and breakouts within ongoing trends.
Now we can see how the price descended to the order block with the highest volume, which we had previously marked as our point of interest for an entry. As the price closed below the median Order Block, we noted its mitigation. After an internal CHoCH, it's directing us towards the main Order Block as a target.
👉 Smart Money Concepts Functions
Market Structure: identifies and marks key structural changes in the market, in order to visually highlight shifts in market trends and patterns. This feature is designed to alert you of significant changes in the market's behavior, signaling a potential shift from accumulation to distribution phase, or vice versa. It helps traders adapt their strategies based on evolving market dynamics.
Order Blocks: pinpoints crucial zones where large institutional investors ("smart money") have shown strong buying or selling interest recently. Order blocks can serve as a tool for identifying key levels for potential trade entries or exits.
FVGs (Fair Value Gaps): detects discrepancies between the perceived market value and actual market price, revealing potential areas for price correction. With its mitigation settings, you can fine-tune the FVG detection according to the magnitude of value misalignment you consider significant.
Liquidity Grabs: helps track "smart money" footprints by identifying levels where large institutional traders may have induced liquidity traps. Understanding these traps can aid in avoiding false market moves and optimizing trade entries.
Automatic Fibonacci Tool: Simplifying the task of identifying key Fibonacci retracement and extension levels, this tool ties Fibonacci levels to the structure for you. It aids in recognizing significant support and resistance levels, providing a clearer understanding of potential price movements.
The Smart Money Concepts trading strategy - combined with these dynamic features - becomes a powerful analytical asset for any trader, providing in-depth insights into market dynamics, trends, and potential opportunities.
👉 Algorithmic trend and dynamic support and resistance
Trend Rainbow: This proprietary feature uses our unique TRMA** method to define short-term, medium-term, and long-term market trends. It incorporates state-of-the-art visualization techniques to render the trend information in an intuitive, easily interpretable manner. It's a 21st-century tool designed for the modern trader who values both precision and simplicity.
Multi-Timeframe Moving Averages: This feature allows traders to simultaneously monitor moving averages across multiple timeframes, providing a comprehensive perspective on market trends. It helps identify dynamic support and resistance zones, key levels where price movements are likely to slow down or reverse. This function not only aids in planning potential trade entries and exits, but also calculates the precise percentage distance to these levels. Can be as well crucial for risk management, enabling traders to set stop losses and profit targets based on solid, data-driven analysis. The Multi-Timeframe Moving Averages function is a versatile tool that combines strategic planning and risk control into a single, easy-to-use feature.
👉 Unlock the Hidden Market Dynamics
Market Sessions: This feature - by default - provides a clear representation of the four major global trading sessions. Each session is distinctly marked on your trading chart, helping you visualize the specific time periods when these markets are most active. Recognizing these sessions is critical for understanding market dynamics, as the opening and closing of major markets can lead to significant price movements. Whether you're a day trader looking to exploit intra-day volatility or a long-term investor wanting to understand broader market trends, the Market Sessions feature can be a useful tool in your trading toolkit.
Divergence Functions: allow the use of unique indicators along with our proprietary ones to detect potential price reversals. As each asset has a different market maker, divergences can vary greatly across different charts and timeframes. With our Divergence Ranking Table, you can quickly determine which divergences have the highest success rates and which are the least successful on a given chart. This feature allows you to adapt your strategies to the most effective signals, enhancing your trading decisions and boosting your potential profits.
Volume Profile with delta: This feature may give traders an edge by providing an in-depth view of market activity. It illustrates the amount of trading volume at different price levels, combined with the 'delta', which is the difference between buying and selling volume. This information allows you to see areas of high trading activity and understand whether the volume is pushing the price up or down. This real-time insight into the market's supply and demand can be instrumental in identifying key support and resistance levels, predicting potential reversals, and recognizing where the market is likely to move. Similarly to Fibonacci tool, Volume Profile can be tied to the current market structure.
👉 Improve Trading Decisions
Range: This innovative feature assists traders in determining discount, premium, and equilibrium zones. It provides a unique way of visualizing price areas where a security could be overbought or oversold (premium or discount zones), and where the price is expected to be fair and balanced (equilibrium zone). Distance from current price is displayed in percentage terms, which can assist traders with crucial data for risk management and strategic planning. The Range function helps you identify the most favorable price zones for entries and set your stop-loss and take-profit levels more accurately.
Previous OHLC: This functionality offers the capability to display the previous Open, High, Low, Close values. It is primarily set on the daily timeframe and serves as an important reference for traders. Having an overview of these key levels from the previous day gives you a solid foundation on which to base today's trading decisions. Recognizing these levels can help you predict potential turning points in the market, providing an advantage in your trading strategy.
Smart Money Zones: our secret weapon for swing traders. Similarly to order blocks, these zones can accurately identify crucial areas of strong buying or selling interest by large institutional investors. However while Order Blocks focus on recent price action, Smart Money Zones take the whole chart into consideration, resulting in more established support and demand zones.
The summary graph combines six unique indicators (Momentum, Trend Strength, Volume, Volatility, Asset Strength, and Sentiment) along with Structure and Sessions. These indicators use our TRMA** method to provide a comprehensive overview of market dynamics. By consolidating these indicators into a single graph, traders can gain valuable insights into the overall market landscape.
** TRMA (Trend Rainbow Moving Averages) is a complex but customizable moving average matrix calculation that is designed to measure market trend direction, strength and shifting.
⭐ Conclusion
We hold the view that the true path to success is the synergy between the trader and the tool, contrary to the common belief that the tool itself is the sole determinant of profitability. The actual scenario is more nuanced than such an oversimplification. Our aim is to offer useful features that meet the needs of the 21st century and that we actually use.
🛑 Risk Notice:
Everything provided by trademasterindicator – from scripts, tools, and articles to educational materials – is intended solely for educational and informational purposes. Past performance does not assure future returns.

RibboNN Machine Learning [ChartPrime]The RibboNN ML indicator is a powerful tool designed to predict the direction of the market and display it through a ribbon-like visual representation, with colors changing based on the prediction outcome from a conditional class. The primary focus of this indicator is to assist traders in trend following trading strategies.
The RibboNN ML in action
Prediction Process:
Conditional Class: The indicator's predictive model relies on a conditional class, which combines information from both longcon (long condition) and short condition. These conditions are determined using specific rules and criteria, taking into account various market factors and indicators.
Direction Prediction: The conditional class provides the basis for predicting the direction of the market move. When the prediction value is greater than 0, it indicates an upward trend, while a value less than 0 suggests a downward trend.
Nearest Neighbor (NN): To attempt to enhance the accuracy of predictions, the RibboNN ML indicator incorporates a Nearest Neighbor algorithm. This algorithm analyzes historical data from the Ribbon ML's predictive model (RMF) and identifies patterns that closely resemble the current conditional prediction class, thereby offering more robust trend forecasts.
Ribbon Visualization:
The Ribbon ML indicator visually represents its predictions through a ribbon-like display. The ribbon changes colors based on the direction predicted by the conditional class. An upward trend is represented by a green color, while a downward trend is depicted by a red color, allowing traders to quickly identify potential market directions.
The introduction of the Nearest Neighbor algorithm provides the Ribbon ML indicator with unique and adaptive behaviors. By dynamically analyzing historical patterns and incorporating them into predictions, the indicator can adapt to changing market conditions and offer more reliable signals for trend following trading strategies.
Manipulation of the NN Settings:
Smaller Value of Neighbours Count:
When the value of "Neighbours Count" is small, the algorithm considers only a few nearest neighbors for making predictions.
A smaller value of "Neighbours Count" leads to more flexible decision boundaries, which can result in a more granular and sensitive model.
However, using a very small value might lead to overfitting, especially if the training data contains noise or outliers.
Larger Value of "Neighbours Count":
When the value of "Neighbours Count" is large, the algorithm considers a larger number of nearest neighbors for making predictions.
A larger value of "Neighbours Count" leads to smoother decision boundaries and helps capture the global patterns in the data.
However, setting a very large value might result in a loss of local patterns and make the model less sensitive to changes in the data.