Low Liquidity Zones [PhenLabs]📊 Low Liquidity Zones
Version: PineScript™ v6
📌 Description
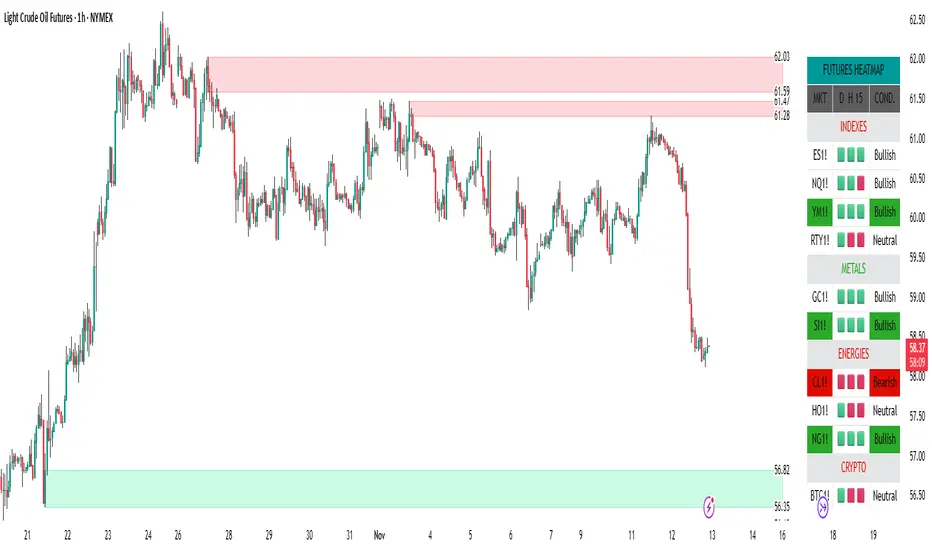
Low Liquidity Zones identifies and highlights periods of unusually low trading volume on your chart, marking areas where price movement occurred with minimal participation. These zones often represent potential support and resistance levels that may be more susceptible to price breakouts or reversals when revisited with higher volume.
Unlike traditional volume analysis tools that focus on high volume spikes, this indicator specializes in detecting low liquidity areas where price moved with minimal resistance. Each zone displays its volume delta, providing insight into buying vs. selling pressure during these thin liquidity periods. This combination of low volume detection and delta analysis helps traders identify potential price inefficiencies and weak structures in the market.
🚀 Points of Innovation
• Identifies low liquidity zones that most volume indicators overlook but which often become significant technical levels
• Displays volume delta within each zone, showing net buying/selling pressure during low liquidity periods
• Dynamically adjusts to different timeframes, allowing analysis across multiple time horizons
• Filters zones by maximum size percentage to focus only on precise price levels
• Maintains historical zones until they expire based on your lookback settings, creating a cumulative map of potential support/resistance areas
🔧 Core Components
• Low Volume Detection: Identifies candles where volume falls below a specified threshold relative to recent average volume, highlighting potential liquidity gaps.
• Volume Delta Analysis: Calculates and displays the net buying/selling pressure within each low liquidity zone, providing insight into the directional bias during low participation periods.
• Dynamic Timeframe Adjustment: Automatically scales analysis periods to match your selected timeframe preference, ensuring consistent identification of low liquidity zones regardless of chart settings.
• Zone Management System: Creates, tracks, and expires low liquidity zones based on your configured settings, maintaining visual clarity on the chart.
🔥 Key Features
• Low Volume Identification: Automatically detects and highlights candles where volume falls below your specified threshold compared to the moving average.
• Volume Delta Visualization: Shows the net volume delta within each zone, providing insight into whether buyers or sellers were dominant despite the low overall volume.
• Flexible Timeframe Analysis: Analyze low liquidity zones across multiple predefined timeframes or use a custom lookback period specific to your trading style.
• Zone Size Filtering: Filters out excessively large zones to focus only on precise price levels, improving signal quality.
• Automatic Zone Expiration: Older zones are automatically removed after your specified lookback period to maintain a clean, relevant chart display.
🎨 Visualization
• Volume Delta Labels: Each zone displays its volume delta with “+” or “-” prefix and K/M suffix for easy interpretation, showing the strength and direction of pressure during the low volume period.
• Persistent Historical Mapping: Zones remain visible for your specified lookback period, creating a cumulative map of potential support and resistance levels forming under low liquidity conditions.
📖 Usage Guidelines
Analysis Timeframe
Default: 1D
Range/Options: 15M, 1HR, 3HR, 4HR, 8HR, 16HR, 1D, 3D, 5D, 1W, Custom
Description: Determines the historical period to analyze for low liquidity zones. Shorter timeframes provide more recent data while longer timeframes offer a more comprehensive view of significant zones. Use Custom option with the setting below for precise control.
Custom Period (Bars)
Default: 1000
Range: 1+
Description: Number of bars to analyze when using Custom timeframe option. Higher values show more historical zones but may impact performance.
Volume Analysis
Volume Threshold Divisor
Default: 0.5
Range: 0.1-1.0
Description: Maximum volume relative to average to identify low volume zones. Example: 0.5 means volume must be below 50% of the average to qualify as low volume. Lower values create more selective zones while higher values identify more zones.
Volume MA Length
Default: 15
Range: 1+
Description: Period length for volume moving average calculation. Shorter periods make the indicator more responsive to recent volume changes, while longer periods provide a more stable baseline.
Zone Settings
Zone Fill Color
Default: #2196F3 (80% transparency)
Description: Color and transparency of the low liquidity zones. Choose colors that stand out against your chart background without obscuring price action.
Maximum Zone Size %
Default: 0.5
Range: 0.1+
Description: Maximum allowed height of a zone as percentage of price. Larger zones are filtered out. Lower values create more precise zones focusing on tight price ranges.
Display Options
Show Volume Delta
Default: true
Description: Toggles the display of volume delta within each zone. Enabling this provides additional insight into buying vs. selling pressure during low volume periods.
Delta Text Position
Default: Right
Options: Left, Center, Right
Description: Controls the horizontal alignment of the delta text within zones. Adjust based on your chart layout for optimal readability.
✅ Best Use Cases
• Identifying potential support and resistance levels that formed during periods of thin liquidity
• Spotting price inefficiencies where larger players may have moved price with minimal volume
• Finding low-volume consolidation areas that may serve as breakout or reversal zones when revisited
• Locating potential stop-hunting zones where price moved on minimal participation
• Complementing traditional support/resistance analysis with volume context
⚠️ Limitations
• Requires volume data to function; will not work on symbols where the data provider doesn’t supply volume information
• Low volume zones don’t guarantee future support/resistance - they simply highlight potential areas of interest
• Works best on liquid instruments where volume data has meaningful fluctuations
• Historical analysis is limited by the maximum allowed box count (500) in TradingView
• Volume delta in some markets may not perfectly reflect buying vs. selling pressure due to data limitations
💡 What Makes This Unique
• Focus on Low Volume: Unlike some indicators that highlight high volume events particularly like our very own TLZ indicator, this tool specifically identifies potentially significant price zones that formed with minimal participation.
• Delta + Low Volume Integration: Combines volume delta analysis with low volume detection to reveal directional bias during thin liquidity periods.
• Flexible Lookback System: The dynamic timeframe system allows analysis across any timeframe while maintaining consistent zone identification criteria.
• Support/Resistance Zone Generation: Automatically builds a visual map of potential technical levels based on volume behavior rather than just price patterns.
🔬 How It Works
1. Volume Baseline Calculation:
The indicator calculates a moving average of volume over your specified period to establish a baseline for normal market participation. This adaptive baseline accounts for natural volume fluctuations across different market conditions.
2. Low Volume Detection:
Each candle’s volume is compared to the moving average and flagged when it falls below your threshold divisor. The indicator also filters zones by maximum size to ensure only precise price levels are highlighted.
3. Volume Delta Integration:
For each identified low volume candle, the indicator retrieves the volume delta from a lower timeframe. This delta value is formatted with appropriate scaling (K/M) and displayed within the zone.
4. Zone Management:
New zones are created and tracked in a dynamic array, with each zone extending rightward until it expires. The system automatically removes expired zones based on your lookback period to maintain a clean chart.
💡 Note:
Low liquidity zones often represent areas where price moved with minimal participation, which can indicate potential market inefficiencies. These zones frequently become important support/resistance levels when revisited, especially if approached with higher volume. Consider using this indicator alongside traditional technical analysis tools for comprehensive market context. For best results, experiment with different volume threshold settings based on the specific instrument’s typical volume patterns.
Tradingzones

Supply & Demand Trade Analyzer by NYTCSupply and Demand Trade Analyzer
Automatic Zone Identification
• Identifies high quality supply and demand zones on multiple timeframes
• Shows the prices for each zone so the user may easily identify actionable prices to buy or sell
• Once a zone is no longer valid, it is automatically removed from the chart to keep the workspace clean.
• Includes all 4 zone formations: DBR, RBR, RBD and DBD
What are supply and demand zones?
Supply and demand zones are visual representations of areas where there has been a price imbalance. Whenever a demand imbalance is detected, the indicator will plot a green demand zone which may be used as an area to buy under the right market conditions, such as an uptrend or to take profit on a short position. Also, whenever a supply imbalance is detected, the indicator will plot a red supply zone which may be used as an area to sell under the right conditions such as a downtrend or to take profit on a long position.
Automatic Trend Analysis
Proper trend analysis is one of the most important steps in successfully trading or investing in the financial markets as it helps the trader determine which side of the market, he/she wants to take: long or short. For this reason, we decided to also include in this indicator our unique trend analysis technique that utilizes highs and lows to detect when trends begin, how they continue and when they end. The indicator is able properly identify uptrends (Higher Highs and Higher Lows), downtrend (Lower Highs and Lower Lows), and sideways trends (relatively equal highs and lows, higher highs but lower lows or lower highs but higher lows).
• The trader can toggle this feature on or off as needed.
• Our unique trend indicator is located at the bottom of the chart so, as not to interfere with the candles and hide important information.
• When the indicator shows green, the trend is up, when it shows red, the trend is down and sideways when the indicator shows grey.
How it works
Being that supply and demand zones are areas of potential imbalance, under the right conditions price may reverse at these zones. Use them in conjunction with your entry and exit rules to maximize efficacy and minimize risk.
User Inputs
In the settings menu you will find the following functions:
• Zone Count: Allows the trader to determine how many zones are shown on the chart
• Zone-on-Zone: Give the trader the option to also see overlapping zones
• Minor Zones: While the indicator plots major zones by default, this function gives the trader to see all zones in real time as they are being formed.
• HTF Trend: Give the trader the option to turn on our unique trend identification tool
• LTF Momentum: Allows the trader to toggle on or off our unique lower timeframe momentum finder. This tool is best used during the Globex of the Futures session for short-term trading (scalping)
Instruments
Our Trade Analyzer works across all asset classes and on all instruments, including:
Stocks
Futures
Forex
Cryptocurrencies
Summary
The Supply and Demand Trade Analyzer offers traders a quick and easy way of identifying supply and demand or support and resistance areas on a chart. It provides:
• Zone Identification: Proper zone identification on multiple timeframes
• User-Friendly Customization: With a variety of user inputs, you can tailor the analyzer to fit your unique trading strategy.
• Cross-Asset Compatibility: Works seamlessly across all major asset classes and instruments.
• Clean Workspace: Automatic removal of invalid zones keeps your chart organized and focused on the most relevant information.
• Real-Time Insights: Stay ahead of the market with real-time zone plotting and trend analysis, enabling timely and strategic trades.
Timezone session and reset (extra pane)This indicator allows you to display the session in a pane.
For now, you can't change the time, only the design.

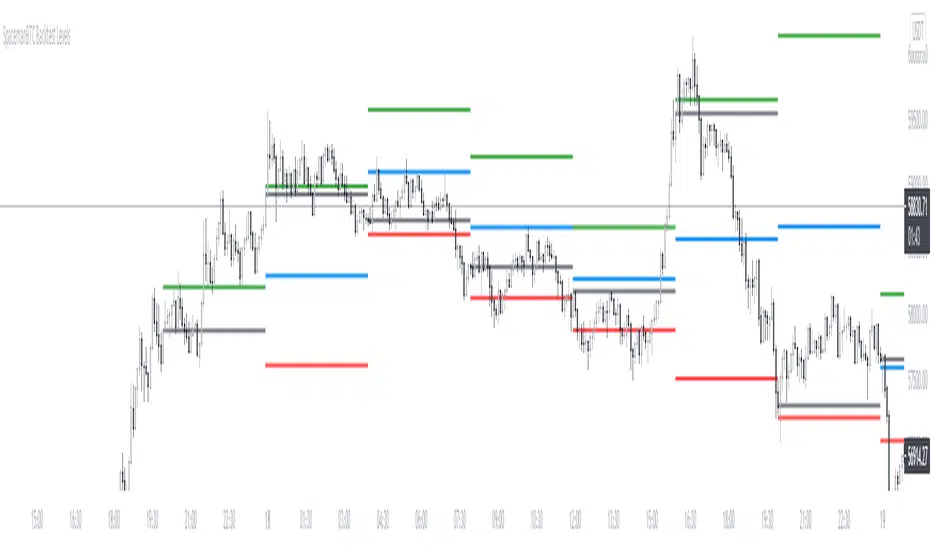
Key Levels CustomTF + Backtest: SpacemanBTCKey Levels Backtest, same logic as the key levels script, provide levels based:
High, Low, Mid and Close.
This was requested, took a long time to post as I fell sick and was given a lot of Dev Work.
Hope this helps those who use it, very useful to see liquidity grabs in my opinion.
Input time in minutes!
Result of a user request.
AutoUFOs (patented)█ OVERVIEW:
AutoUFOs is a cutting-edge trading tool designed to enhance your trading precision and to save you trading time. With its unique patented technology, AutoUFOs analyzes various financial markets, identifying potential Un-Filled Orders (UFOs) and plotting them on your charts. By leveraging these UFOs, you can define precise entry, stop, and target points, giving you a strategic edge in your trading decisions.
█ CONCEPTS:
AutoUFOs identifies price regions with pending buy and sell orders
UFOs on the charts represent these regions and indicate potential upcoming turning points
UFOs help define more precise entry, stop, and target points
Enhances trading precision and improves performance
Useful for all styles: long-term, intermediate-term, short-term
Powerful for commercial hedging strategies
Time interval flexibility for different trading styles
Benefits options traders in identifying powerful strike prices
Empowers users to make informed trading decisions
█ WITH MORE DETAIL:
AutoUFOs goes beyond simple technical analysis and plots UFO Bands on your charts. These UFO Bands visually represent the price regions where potential buy and sell orders are waiting to be executed. The intensity of the color within the bands provides a valuable indication of the potential strength of the unfulfilled orders in those regions.
In addition to UFO Bands, AutoUFOs introduces round Flying Saucers to enhance your understanding of market dynamics. These Flying Saucers highlight the areas on the chart with the highest concentration of UFOs. By pinpointing these areas, you gain deeper insights into where the market is likely to react and experience significant movement.
The combination of UFO Bands and Flying Saucers provides a comprehensive visual representation of potential order flow and market sentiment. Traders can leverage this information to make more informed decisions about entry and exit points, allowing for greater precision in their trading strategies.
Whether you're a technical analyst seeking to identify price levels where the market is likely to bounce or a trend follower looking for confirmation of market momentum, AutoUFOs empowers you with detailed visuals to support your trading decisions.
█ BEHIND THE SCENES:
AutoUFOs employs a unique and patented approach to identifying Un-Filled Orders (UFOs) in the market. Unlike traditional methods that rely on current order book data, AutoUFOs takes into account the intricate nuances of market dynamics, considering the intentions and strategies of larger market players who employ sophisticated algorithms to execute their orders, such as iceberg algos. By doing so, AutoUFOs uncovers potential UFOs that are likely to remain in the market based on the underlying reasons behind their placement.
One key aspect of AutoUFOs' analysis is the recognition of price levels that hold significance due to the presence of UFOs. These levels represent areas where market makers, for instance, strategically hedge their positions in response to large orders that were only partially filled upon injection into the marketplace. AutoUFOs diligently identifies these signs, allowing traders to gain insights into the potential existence of unfulfilled orders that can significantly impact market behavior.
AutoUFOs operates on a distinctive methodology that sets it apart from traditional approaches. Notably, it eschews the use of order book information, relying solely on level 1 data for its analysis. This unconventional approach seeks out subtle indications that hint at the existence of Un-Filled Orders (UFOs). By examining these signs, AutoUFOs uncovers potential price levels where UFOs may be lurking.
Consider, for instance, a scenario where a market experiences a sudden and pronounced price movement. In such cases, AutoUFOs directs its attention to the origin of the movement, recognizing it as a crucial area to investigate. The underlying rationale is simple yet profound: if all orders had been filled at the origin, the price would have stagnated, resulting in a sideways price action. However, the occurrence of a significant movement suggests that the market encountered a scarcity of buyers (for a downward movement) or sellers (for an upward movement) at that specific price level. This scarcity implies the presence of Un-Filled Orders that remained unfilled from the outset. By diligently identifying such scenarios, AutoUFOs initiates additional analytical processes that consider factors such as volume ratios, tick ratios range ratios, etc., providing an evaluation of the expected quantity of potential UFOs.
This example illuminates the essence of the concept previously mentioned—AutoUFOs diligently "looks for signs" that point towards the potential existence of UFOs. By systematically examining various market dynamics, AutoUFOs unravels hidden opportunities that arise from unfulfilled orders, leveraging metrics like volume ratios and tick ratios to gauge the anticipated abundance of UFOs. Through this meticulous and sophisticated analysis, AutoUFOs empowers traders with invaluable insights into the market, enabling them to make more informed decisions based on these hidden signals.
Once this initial analysis is complete and multiple relevant price points are identified based on the UFOs detected, AutoUFOs delves further by employing its advanced technology to retrospectively evaluate the UFO Performance. This evaluation assesses the characteristics and attributes that contributed to the effectiveness of specific UFOs in the past. By unraveling these statistical insights, AutoUFOs identifies the most relevant UFOs that are likely to retain their predictive power into the future.
Through its scientific and technical methodology, AutoUFOs offers traders a powerful way to navigate the complexities of the market for informed decision-making.
█ FEATURES:
Precise Trade Entries: Utilize the power of UFOs to identify optimal moments/prices to enter trades with confidence
Strategic Exits: Plan your exits by leveraging the UFOs' reaction points, maximizing your profits and minimizing risk
Flexible Time Intervals: Apply AutoUFOs to different time intervals, from seconds to monthly bars, range bars, etc. tailoring it to your preferred trading style
Options Trading Advantage: For options traders, AutoUFOs helps identify price levels that are unlikely to be reached, allowing you to profit from selling out-of-the-money options and collecting premiums
█ HOW TO USE:
Follow the author’s instructions to request access to this invite-only script or follow the links in the vendor’s signature field that appears under this description
Add AutoUFOs to your TradingView chart by clicking on Indicators > Invite-only scripts > AutoUFOs
Select the market and timeframe you want to analyze and make sure you have adjusted the calibration settings to your liking
For long trades, you may consider buying within a Green UFO and sell within a Red UFO
For short trades, you may consider selling within a Red UFO and buy within a Green UFO
Options traders can utilize UFOs to identify areas for selling options with limited risk or to select their strike prices
Consider the color intensity of UFOs for potential trade strength
Enhance your current trading methodology by combining UFOs with what you currently do
Plan your trades based on the Un-Filled Orders identified by AutoUFOs and the rules of your trading plan
We strongly recommend you to read the HOW-TO idea on " HOW-TO Add Precision To Entries & Exits With AutoUFOs (patented) " which is linked below as a related idea
█ LIMITATIONS:
AutoUFOs should not be used as the sole basis for trading decisions
The tool is not infallible and should be used in conjunction with other market analysis tools, especially when it comes to defining the current market condition, for which we prefer AutoClimate
Thank you for considering AutoClimate as your ultimate market environment indicator. We hope it enhances your trading experience and leads to greater success in your trades
═════════════════════════════════════════════════════════════════════════
Disclaimer: Trading involves risk and each investor/trader must determine if it is a suitable investment. Past performance is not indicative of future results. You accept responsibility for your actions and agree not to hold the author/developer liable for any outcomes.
No Service Guarantee: The author/developer makes no guarantee that the TradingView indicators and services will be uninterrupted, timely, secure, accurate, or error-free. The market data may be delayed, inaccurate, or contain errors, and the developer is not liable for any issues that arise.
Calibration: The user is responsible for calibrating the indicator as different parameters can produce different results. The author/developer is not responsible for any outcomes resulting from the user's calibration.
Testimonials: Testimonials are subjective and not independently verified.
