NQ Climax Signals - Chart OverlayThis specialized overlay indicator identifies extreme volume exhaustion points (climaxes) in NQ1! (Nasdaq 100 E-mini futures) that often signal major market reversals. By analyzing volume spikes relative to historical patterns, it helps traders spot potential turning points before they become obvious to the broader market.
Key Features
🎯 Climax Detection Technology
Selling Climax: Extreme red candle volume indicating selling exhaustion (potential reversal UP)
Buying Climax: Extreme green candle volume indicating buying exhaustion (potential reversal DOWN)
Volume Ratio Analysis: Compares current volume to 30-day historical averages
Dynamic Thresholds: Adjustable sensitivity for different market conditions
📍 Precision Signal Placement
Chart Overlay: Signals appear directly on price bars where they occur
Fixed Positioning: Signals remain stable regardless of chart scaling or zoom level
Clear Visual Hierarchy: Purple for selling climax, blue for buying climax
Dual Display Options: Text labels or clean diamond shapes
⚡ Real-Time Analysis
Live Calculations: Updates with each new candle
30-Day Lookback: Analyzes recent volume patterns for context
Smart Filtering: Only triggers on true volume extremes
Background Highlighting: Subtle chart tinting during climax events
Trading Applications
🔄 Reversal Trading
Selling Climax at Support: High probability bounce setup
Buying Climax at Resistance: High probability rejection setup
Counter-trend Entries: Fade extreme moves with volume confirmation
Risk Management: Clear invalidation levels based on climax bars
📊 Market Structure Analysis
Volume Exhaustion Points: Identify where trends may pause or reverse
Institutional Activity: Spot large player capitulation or distribution
Market Sentiment Extremes: Recognize panic selling or euphoric buying
Confirmation Tool: Validate other technical analysis signals
How Volume Climaxes Work
🔴 Selling Climax (Purple Signals)
Definition: Extremely high volume on red candles
Psychology: Panic selling, forced liquidation, capitulation
Opportunity: Often marks short-term or intermediate bottoms
Action: Consider long positions with proper risk management
🔵 Buying Climax (Blue Signals)
Definition: Extremely high volume on green candles
Psychology: FOMO buying, euphoria, exhaustion buying
Opportunity: Often marks short-term or intermediate tops
Action: Consider short positions with proper risk management
Technical Specifications
📈 Algorithm Details
Volume Multiplier: Default 2.5x average (customizable 2.0-5.0x)
Ratio Threshold: Default 1.5 for trend confirmation
Lookback Period: 30 days (customizable 1-250 days)
Update Frequency: Real-time with each tick
🎛️ Customization Options
Show/Hide Labels: Toggle between text and diamond displays
Sensitivity Adjustment: Fine-tune trigger thresholds
Background Effects: Optional chart highlighting
Alert System: Comprehensive notification setup
Best Practices
✅ Optimal Usage
Combine with Support/Resistance: Climaxes near key levels are most reliable
Confirm with Price Action: Look for reversal candlestick patterns
Use Proper Position Sizing: Climax trades can be volatile
Set Clear Stops: Define risk before entering any position
⚠️ Important Considerations
Not Every Climax Reverses: Some lead to continuation after brief pause
Context Matters: Consider overall trend and market structure
Volume Quality: Higher timeframe confirmation strengthens signals
Risk Management: Always use appropriate stop losses
Educational Value
This indicator teaches traders to:
Recognize Volume Patterns: Understand how volume reveals market psychology
Identify Exhaustion: Spot when trends may be running out of steam
Time Market Entries: Enter near potential turning points
Develop Market Feel: Build intuition for volume-price relationships
Installation & Setup
Add this overlay indicator directly to your NQ futures chart
Adjust volume multiplier based on recent market volatility
Enable alerts for automatic climax notifications
Combine with the companion "NQ Volume Analysis" oscillator for complete analysis
Disclaimer
This indicator is for educational and informational purposes only. Volume climax signals do not guarantee reversals and should be used as part of a comprehensive trading strategy. Past performance does not predict future results. Trading futures involves substantial risk of loss and is not suitable for all investors.
💡 Developed by ProfitGang Trading Community
Advanced volume analysis tools for serious traders
🔔 Enable alerts to catch every climax signal!
⭐ Rate and review if this tool improves your trading!
Companion Tools
NQ Volume Analysis: Complete multi-timeframe volume oscillator
Works Best Together: Use both indicators for comprehensive volume analysis
Professional Trading Suite: Part of ProfitGang's advanced indicator collection
#NQFutures #VolumeClimax #ReversalTrading #VolumeAnalysis #FuturesTrading #TechnicalAnalysis #ProfitGang #TradingSignals
Trading!

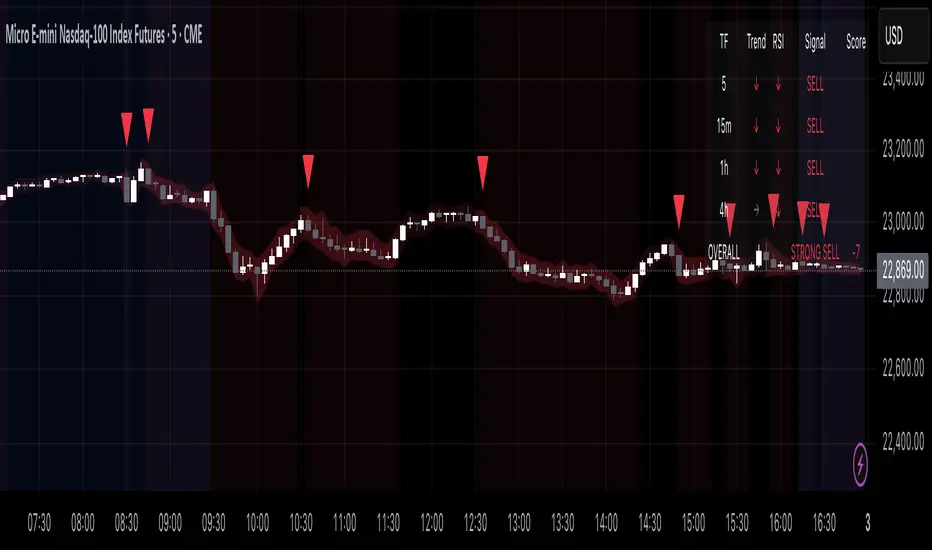
Multi-Timeframe Confluence Indicator - 4 Timeframes, No Guessing🎯 Multi-Timeframe Confluence Indicator (FREE)
Stop Trading Blind - See All Timeframes at Once!
Why do 87% of traders fail? They trade against the bigger trend. This indicator changes that.
✨ What You Get:
- 4 Timeframe Analysis (Current/15m/1H/4H) in ONE view
- Smart Confluence Zones - Know exactly where to trade
- Non-Repainting Signals - What you see stays
- Live Confluence Table - All timeframes at a glance
- Professional Alerts - Never miss high-probability setups
📊 How It Works:
1. TREND: 50/200 EMA across timeframes
2. MOMENTUM: RSI confirmation
3. SCORE: -8 to +8 confluence rating
Strong signals only appear when MULTIPLE timeframes agree!
🎯 Signal Types:
- 💚 STRONG BUY (Score 6+)
- 🟢 BUY (Score 3-5)
- 🔴 SELL (Score -3 to -5)
- ❤️ STRONG SELL (Score -6 or less)
⚡ Perfect For:
- Beginners (simple, visual)
- Scalpers (avoid counter-trend trades)
- Swing traders (catch big moves)
- All markets (Crypto/Forex/Stocks)
🎁 100% FREE - No Hidden Fees!
Professional-grade tool. No strings attached.
Add now and trade with the confidence of seeing the complete market picture!
---
Works on: BTC, ETH, ES, NQ, Major FX Pairs
Best results on liquid instruments
⬇️ FOLLOW for more free indicators!
Time-Price Velocity [QuantAlgo]🟢 Overview
The Time-Price Velocity indicator uses advanced velocity-based analysis to measure the rate of price change normalized against typical market movement, creating a dynamic momentum oscillator that identifies market acceleration patterns and momentum shifts. Unlike traditional momentum indicators that focus solely on price change magnitude, this indicator incorporates time-weighted displacement calculations and ATR normalization to create a sophisticated velocity measurement system that adapts to varying market volatility conditions.
This indicator displays a velocity signal line that oscillates around zero, with positive values indicating upward price velocity and negative values indicating downward price velocity. The signal incorporates acceleration background columns and statistical normalization to help traders identify momentum shifts and potential reversal or continuation opportunities across different timeframes and asset classes.
🟢 How It Works
The indicator's key insight lies in its time-price velocity calculation system, where velocity is measured using the fundamental physics formula:
velocity = priceChange / timeWeight
The system normalizes this raw velocity against typical price movement using Average True Range (ATR) to create market-adjusted readings:
normalizedVelocity = typicalMove > 0 ? velocity / typicalMove : 0
where "typicalMove = ta.atr(lookback)" provides the baseline for normal price movement over the specified lookback period.
The Time-Price Velocity indicator calculation combines multiple sophisticated components. First, it calculates acceleration as the change in velocity over time:
acceleration = normalizedVelocity - normalizedVelocity
Then, the signal generation applies EMA smoothing to reduce noise while preserving responsiveness:
signal = ta.ema(normalizedVelocity, smooth)
This creates a velocity-based momentum indicator that combines price displacement analysis with statistical normalization, providing traders with both directional signals and acceleration insights for enhanced market timing.
🟢 How to Use
1. Signal Interpretation and Threshold Zones
Positive Values (Above Zero): Time-price velocity indicating bullish momentum with upward price displacement relative to normalized baseline
Negative Values (Below Zero): Time-price velocity indicating bearish momentum with downward price displacement relative to normalized baseline
Zero Line Crosses: Velocity transitions between bullish and bearish regimes, indicating potential trend changes or momentum shifts
Upper Threshold Zone: Area above positive threshold (default 1.0) indicating strong bullish velocity and potential reversal point
Lower Threshold Zone: Area below negative threshold (default -1.0) indicating strong bearish velocity and potential reversal point
2. Acceleration Analysis and Visual Features
Acceleration Columns: Background histogram showing velocity acceleration (the rate of change of velocity), with green columns indicating accelerating velocity and red columns indicating decelerating velocity. The interpretation depends on trend context: red columns in downtrends indicate strengthening bearish momentum, while red columns in uptrends indicate weakening bullish momentum
Acceleration Column Height: The height of each column represents the magnitude of acceleration, with taller columns indicating stronger acceleration or deceleration forces
Bar Coloring: Optional price bar coloring matches velocity direction for immediate visual trend confirmation
Info Table: Real-time display of current velocity and acceleration values with trend arrows and change indicators
3. Additional Features:
Confirmed vs Live Data: Toggle between confirmed (closed) bar analysis for stable signals or current bar inclusion for real-time updates
Multi-timeframe Adaptability: Velocity normalization ensures consistent readings across different chart timeframes and asset volatilities
Alert System: Built-in alerts for threshold crossovers and direction changes
🟢 Examples with Preconfigured Settings
Default : Balanced configuration suitable for most timeframes and general trading applications, providing optimal balance between sensitivity and noise filtering for medium-term analysis.
Scalping : High sensitivity setup with shorter lookback period and reduced smoothing for ultra-short-term trades on 1-15 minute charts, optimized for capturing rapid momentum shifts and frequent trading opportunities.
Swing Trading : Extended lookback period with enhanced smoothing and higher threshold for multi-day positions, designed to filter market noise while capturing significant momentum moves on 1-4 hour and daily timeframes.

TZtraderTZtrader
This is a TrendZones version with features to set stoploss and targets in short and long positions meant for use in intraday charts. It aims to provide signals for opening and closing long and short positions. In the comments under the TrendZones publication several people expressed a need for features for a short position similar to those for a long position as implemented in TrendZones, some want to use it for scalping, some asked for alerts. When I proposed to create a version for day trading with target lines based on ATR, several people liked the idea.
Full disclosure: I don’t do day trading, because, after I lost a lot of money, I had to promise my wife to stay away from it. I restrict myself to long term investing in stocks which are in uptrend. However I understand what a day trader needs. I gather from my experience that day trading or scalping is an attempt to earn something by opening a position in the morning and close, reopen and close it again during the day with a profit. It is usually done with leveraged instruments like CFD’s, futures, options, and what have you. Opening and closing positions is done within minutes, so the trader needs a quick and efficient way to set proper stoploss and target. TZtrader supports this by showing only three or four numbers on the price bar: The price of the instrument, The logical stop level (gray or green or maroon dots), and the target level (navy). All other numbers are suppressed to prevent mistakes. Also a clear feedback for current settings at the top-center of the pane and an alert feedback at bottom that flashes alerts during the development of the current bar and gives suppression status.
The script
First I made a bare bones version of TrendZones to which I added code for long and short trading setups and a bare setup for no position. The code for the logical stops in long setup had to be reviewed, after which this became the basis for stops in short setup.
Then I added code for 10 alert messages, which was a hassle, because this is the first time I coded alerts and the first time I used an array as a stack to avoid a complicated if-then construction. During testing the array caused a runtime error which I solved by adding ‘array.clear’ to the code, also I discovered that in TradingView separate alerts have to be created for all three setups - short, long and bare. Flipping setups is done in the inputs with a dropdown menu because Pine Script has no function for a clickable button.
One visual with three setups.
The visual has the TrendZones structure: Three near parallel very smooth curves, which border the moderate uptrend (green) and downtrend (orange) zone over and under the curve in the middle, the COG (Center Of Gravity). Where the price breaks out of these curves, strong trend zones show up over and under the curves, respectively strong uptrend (blue) and strong downtrend (red).
Three setups were made clearly different to avoid confusion and to provide oversight in case of multiple trades going on simultaneously which I imagine are monitored in one screen. You have to see which one is long, which short and which have no position. The long setup should not trigger short signals, nor should the short trigger long signals nor the bare setup exclusive long or short signals.
The Long setup is default, shown on the example chart. In this setup the Stoploss suggestions (green, gray and maroon dots) are under the price bars and the target line (navy) at a set distance above the High Border. A zone with a width of 1 ATR is drawn under the Low Border. In this setup 5 specific alerts are provided
The Short setup has the Stoploss suggestions over the price bars, the target line at a set distance under the Low Border. A zone with a width of 1 ATR is drawn above the High Border. This setup also has 5 specific alerts.
The Bare setup has no Stoploss suggestions, no target line and supports 4 alerts, 2 in common with the Long setup and 2 with Short.
The table below gives a summary of scripted alerts:
Setup = Where = When = Purpose
Long, Bare = Green Zone = Bars come from lower zones = Uptrend starts
Long, Bare = Green Zone = Sideways ends in uptrend = Uptrend resumes
Long = COG = First crossing = Uptrend might end warning
Long = Orange Zone = Bars come from higher zones = Uptrend ended take care
Long = Red Zone = Bars come from higher zones = Strong downtrend->close Long
Short, Bare = Orange Zone = Bars come from higher zones = Downtrend starts
Short, Bare = Orange Zone = Sideways ends in downtrend = Downtrend resumes
Short = COG = First crossing = Downtrend might end warning
Short = Green Zone = Bars come from lower zones = Downtrend ended take care
Short = Blue Zone = Bars come from lower zones = Strong uptrend -> close short
You can use script alerts in TradingView by clicking the clock in the sidebar, then ‘create alert’ or plus, as condition you choose ‘Tztrader’ in the dialog box, then the “Any alert() function call” option (the first item in the list). The script lets the valid alert trigger by TradingView after the bar is completed, this can differ from the flashed messages during its formation.
When you create alerts in Tradingview, I advice to do that for each setup, then to make only the alert active which matches the current setup, pause the other ones.
Suppressing false and annoying signals
The script has two ways to suppress such signals, which have to do with the numbers in the alert feedback. The numbers left and right of the message with a colored background, depict the zones in which the previous (left) and current (right) bar move. 1 is the strong downtrend zone (red), 2 the moderate downtrend zone (orange), 3 the sideways zones (gray), 4 the COG (gray), 5 the moderate uptrend zone (green), 6 the strong uptrend zone (blue), 7 something went wrong with assigning a zone (black). In extensive testing the number 7 never occurs, because I catch that error in the code. The idea is that an alert is only triggered if the previous bar was in a different zone. When the bars are in the same zone, no alert is possible. This way all annoying signals are suppressed and long, short and bare get the appropriate alerts.
The third number is a counter. It counts how often the COG is crossed without touching the outer curves. The counter will reset to zero when the upper or lower curve is touched. When the count is 1 you have zone situation 4 and appropriate alerts are flashed. When the count is 2 or higher, a sideways situation (3) is called and while the recrossings are going on, no alerts can be flashed. This suppresses false signals. The ATR zone and curves are brownish-gray where sideways happens(ed). When the channel is narrowed down to just the three curves, some false signals still might occur.
Inputs
“Setup”, default is long, drop down menu provides long, short and bare.
“Target ATR”, default is 2, sets the amount of ATR for the target line. In 1 minute charts 4 seems an appropriate setting, you have to learn by experience which setting works.
“show feedback …” default is on, This creates two feedback labels, a Setup feedback on top of the pane, which shows charted instrument, Setup type, Trend and timeframe of the chart. Background color of Trend feedback is green when it matches the setup, red when mismatches and gray when no match. The alert feedback at the bottom of the pane shows a number, a message and two numbers. The numbers will be explained in the chapter about false and annoying signals below. During formation of the bar, valid alerts are flashed with a blue background, otherwise the message ‘alerts for current bar suppressed’.
Logical Stops
The curves are the logical place to put stops, because, as these are averages of the high and low border of a Donchian channel, they signify the ‘natural’ current highest, lowest and main level in the lookback period that fit the monitored trend setup. A downtrend turns into an uptrend when a breakout of the upper curve occurs. If you are short, that is where you want to close position, so the logical place for the stoploss is the upper curve. Vice versa, when you are long, the logical stop is on the lower curve. The stops show up as green or gray dots on the curves, the green dots signify a nice entry level, the gray stops are there to suggest levels where unrealized profits might be secured, the maroon dots indicate that the trend mismatches the setup.
COG versus other lines
Any line used to identify a trend, be it some MA or some other line, is interpreted the same way: When the bars move above the line there is an uptrend and when below, a downtrend. COG is not different in that sense. If you put such a line in the same chart as TZtrader, you can see situations in which the other line shows uptrend or downtrend earlier than COG, also some other lines, e.g. Hull MA, are very good at showing tops and bottoms, while COG ignores these. On the other hand the other lines are usually a little nervous and let you shake out of position too soon. Just like the other lines, COG gives false signals when it is near horizontal. The advantage of the placement COG is the tolerance for pull backs. This way TZtrader keeps you longer in the trend. Such pull backs are often ‘flags’ which are interpreted in TA as confirming the trend. Tztrader aims to get you in position reasonably soon when a trend begins and out of position as soon as the trend turns against you. The placement of COG is done with a fundamentally different algorithm than other lines as it is not an average of prices, but the middle of two averages of borders of a Donchian channel. This gives the two zones between the curves the same quality as the two zones above and below the middle line of a standard Donchian Channel.
A multi timeframe application.
In this scenario you put a 5 minutes and 1 minute chart with Tztrader side by side. If the 5 minutes shows uptrend, set the 1 minute on long trading and open positions when the trend matches uptrend en close when it mismatches. Don’t open short positions. Once the 5 minute changes to downtrend, set Tztrader in the 1 minute to short trading and open positions when the trend matches downtrend and close when it mismatches.
The idea is that in a long ‘context’, provided by the 5 minutes, the uptrends in the 1 minute will last longer and go further, vice versa for the short ‘context’. This way you do swing trading in the 5 minute in a smart way, maximizing profits.
You can do this with any timeframe pairs with a proportion of around 5:1, 4:1, 6:1, like e.g. 60 minutes and 15 minutes or weeks and days (5 trading days in a week).
Dear day-traders, may this tool be helpful and may your days be blessed.
Take care

Quality Buy/Sell Indicator with Scalping Mode + SL OnlyQuality Buy/Sell Indicator with Scalping Mode + SL Only is designed for traders who want clean and reliable signals for both swing and scalping strategies.
✅ Features:
Buy & Sell signals based on EMA and MACD logic
Scalping Mode (switch ON for faster, more frequent signals)
SL (Stop Loss) line displayed for every trade for easy risk management
Clean chart – no TP1, TP2, TP3 clutter
Option to show only the latest signal or the entire signal history
✅ How it works:
In normal mode you get fewer, more reliable signals – perfect for intraday or swing trading.
In scalping mode the indicator generates more signals for short-term trades (1–15m charts).
The Show All Signals switch allows you to keep the entire history visible, or only the latest trade setup for maximum clarity.
✅ Best suited for:
Traders who want clean charts without TP lines
Intraday and scalping traders looking for multiple setups per session
Swing traders who prefer clear Buy/Sell with risk control

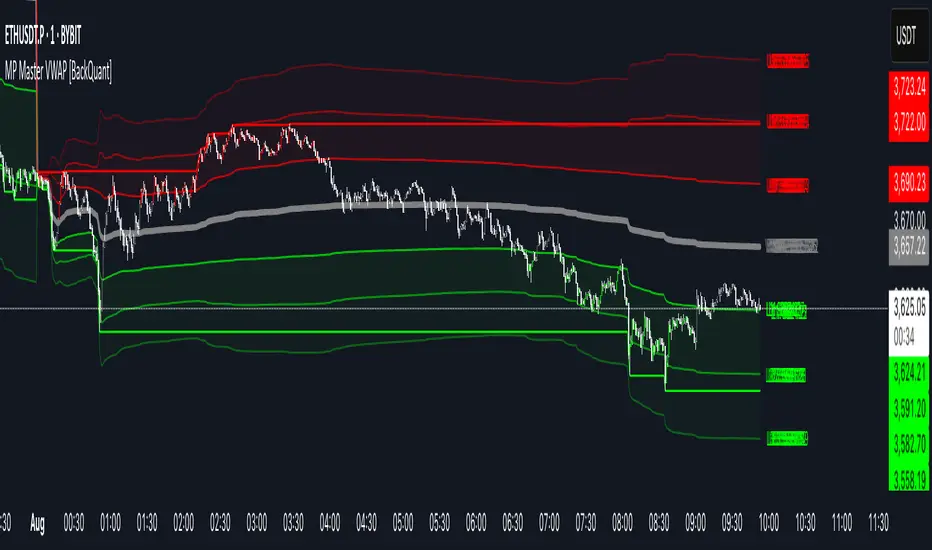
MP Master VWAP [BackQuant]MP Master VWAP
Overview
MP Master VWAP is an, volume-weighted average price suite. It re-anchors automatically to any time partition you select—Day, Week, Month, Quarter or Year—and builds an adaptive standard-deviation envelope, optional pivot clusters and context-aware candle colouring so you can read balance, imbalance and auction edges in a single glance. We use private methods on calculating key levels, making them adaptive and more responsive. This is not just a plain VWAP.
Key Components
• Anchored VWAP core – The engine resets VWAP the instant a new session for the chosen anchor begins. Separator lines and a live high–low box make those rotations obvious.
• Dynamic sigma bands – Three upper and three lower bands, scaled by real-time standard deviation. 1-σ filters noise, 2-σ marks momentum, 3-σ flags exhaustion.
• Previous-period memory – The prior session’s VWAP and bands stay on-screen in a muted style so you can trade retests of last month’s value without clutter.
• High-precision price labels – VWAP and every active band print their prices on the hard right edge; labels vanish if you want a cleaner chart.
• Pivot package – Choose Traditional, Fibonacci or Camarilla calculations on a Daily, Weekly or Monthly look-back. Levels plot as subtle circles that complement, not compete with, the VWAP map.
• Context candles – Bars tint relative to their location: vivid red above U2, soft red between U1-U2, neutral grey inside value, soft green between L2-L1, vivid green below L2.
Customisation Highlights
Period section
• Anchor reset drop-down
• Toggles for separator lines and period high/low
Band section
• Independent visibility for L1/U1, L2/U2, L3/U3
• Individual multipliers to fit any volatility profile
• Optional real-time price labels
Pivot section
• Three formula choices
• Independent timeframe—mix a Monthly VWAP with Weekly Camarilla for confluence
Visual section
• Separate switches for current vs previous envelopes
• Candle-colour toggle for traders who prefer raw price bars
Colour section
• Full palette selectors to match dark or light themes instantly
Some Potential Ways it can be used:
Mean-reversion fade – Price spikes into U2 or U3 and stalls (especially at a pivot). Fade back toward VWAP; scale out at U1 and VWAP.
Trend continuation – Close above U1 on rising volume; trail a stop behind U1. Mirror setup for shorts under L1.
Breakout validation – Session gaps below previous VWAP but quickly reclaims it. Use the cross-above alert to automate entry and target U1 / U2.
Overnight inventory flush – Globex extremes that tag L2 / U2 often reverse at the cash open; scalp rotations back to VWAP.
Risk framing – Let the gap between VWAP and L2 / U2 dictate position size, keeping reward-to-risk consistent across assets.
Alerts Included
• Cross above / below current VWAP
• Cross first sigma bands (U1 / L1)
• Break above second sigma bands (U2) or below L2
• Touch of third sigma bands (U3 / L3)
• Cross of previous-period VWAP
• New period high or low
Best Practices
• Tighten sigma multipliers on thin-liquidity symbols; widen them on index futures or high-cap crypto.
• Pair the envelope with order-flow or footprint tools to confirm participation at band edges.
• On intraday charts, anchor a higher-timeframe VWAP (e.g., Monthly on a 15-minute) to reveal institutional accumulation.
• Treat the previous period’s VWAP as yesterday’s fair value—gaps that never revisit it often morph into trend days.
Final Notes
MP Master VWAP condenses auction-market theory into one readable overlay: automatic period resets, adaptive deviation bands, historical memory, multi-style pivots and self-explanatory colour coding. You can deploy it on equities, futures, crypto or FX—wherever volume meets time, VWAP remains the benchmark of true price discovery.
FEDFUNDS Rate Divergence Oscillator [BackQuant]FEDFUNDS Rate Divergence Oscillator
1. Concept and Rationale
The United States Federal Funds Rate is the anchor around which global dollar liquidity and risk-free yield expectations revolve. When the Fed hikes, borrowing costs rise, liquidity tightens and most risk assets encounter head-winds. When it cuts, liquidity expands, speculative appetite often recovers. Bitcoin, a 24-hour permissionless asset sometimes described as “digital gold with venture-capital-like convexity,” is particularly sensitive to macro-liquidity swings.
The FED Divergence Oscillator quantifies the behavioural gap between short-term monetary policy (proxied by the effective Fed Funds Rate) and Bitcoin’s own percentage price change. By converting each series into identical rate-of-change units, subtracting them, then optionally smoothing the result, the script produces a single bounded-yet-dynamic line that tells you, at a glance, whether Bitcoin is outperforming or underperforming the policy backdrop—and by how much.
2. Data Pipeline
• Fed Funds Rate – Pulled directly from the FRED database via the ticker “FRED:FEDFUNDS,” sampled at daily frequency to synchronise with crypto closes.
• Bitcoin Price – By default the script forces a daily timeframe so that both series share time alignment, although you can disable that and plot the oscillator on intraday charts if you prefer.
• User Source Flexibility – The BTC series is not hard-wired; you can select any exchange-specific symbol or even swap BTC for another crypto or risk asset whose interaction with the Fed rate you wish to study.
3. Math under the Hood
(1) Rate of Change (ROC) – Both the Fed rate and BTC close are converted to percent return over a user-chosen lookback (default 30 bars). This means a cut from 5.25 percent to 5.00 percent feeds in as –4.76 percent, while a climb from 25 000 to 30 000 USD in BTC over the same window converts to +20 percent.
(2) Divergence Construction – The script subtracts the Fed ROC from the BTC ROC. Positive values show BTC appreciating faster than policy is tightening (or falling slower than the rate is cutting); negative values show the opposite.
(3) Optional Smoothing – Macro series are noisy. Toggle “Apply Smoothing” to calm the line with your preferred moving-average flavour: SMA, EMA, DEMA, TEMA, RMA, WMA or Hull. The default EMA-25 removes day-to-day whips while keeping turning points alive.
(4) Dynamic Colour Mapping – Rather than using a single hue, the oscillator line employs a gradient where deep greens represent strong bullish divergence and dark reds flag sharp bearish divergence. This heat-map approach lets you gauge intensity without squinting at numbers.
(5) Threshold Grid – Five horizontal guides create a structured regime map:
• Lower Extreme (–50 pct) and Upper Extreme (+50 pct) identify panic capitulations and euphoria blow-offs.
• Oversold (–20 pct) and Overbought (+20 pct) act as early warning alarms.
• Zero Line demarcates neutral alignment.
4. Chart Furniture and User Interface
• Oscillator fill with a secondary DEMA-30 “shader” offers depth perception: fat ribbons often precede high-volatility macro shifts.
• Optional bar-colouring paints candles green when the oscillator is above zero and red below, handy for visual correlation.
• Background tints when the line breaches extreme zones, making macro inflection weeks pop out in the replay bar.
• Everything—line width, thresholds, colours—can be customised so the indicator blends into any template.
5. Interpretation Guide
Macro Liquidity Pulse
• When the oscillator spends weeks above +20 while the Fed is still raising rates, Bitcoin is signalling liquidity tolerance or an anticipatory pivot view. That condition often marks the embryonic phase of major bull cycles (e.g., March 2020 rebound).
• Sustained prints below –20 while the Fed is already dovish indicate risk aversion or idiosyncratic crypto stress—think exchange scandals or broad flight to safety.
Regime Transition Signals
• Bullish cross through zero after a long sub-zero stint shows Bitcoin regaining upward escape velocity versus policy.
• Bearish cross under zero during a hiking cycle tells you monetary tightening has finally started to bite.
Momentum Exhaustion and Mean-Reversion
• Touches of +50 (or –50) come rarely; they are statistically stretched events. Fade strategies either taking profits or hedging have historically enjoyed positive expectancy.
• Inside-bar candlestick patterns or lower-timeframe bearish engulfings simultaneously with an extreme overbought print make high-probability short scalp setups, especially near weekly resistance. The same logic mirrors for oversold.
Pair Trading / Relative Value
• Combine the oscillator with spreads like BTC versus Nasdaq 100. When both the FED Divergence oscillator and the BTC–NDQ relative-strength line roll south together, the cross-asset confirmation amplifies conviction in a mean-reversion short.
• Swap BTC for miners, altcoins or high-beta equities to test who is the divergence leader.
Event-Driven Tactics
• FOMC days: plot the oscillator on an hourly chart (disable ‘Force Daily TF’). Watch for micro-structural spikes that resolve in the first hour after the statement; rapid flips across zero can front-run post-FOMC swings.
• CPI and NFP prints: extremes reached into the release often mean positioning is one-sided. A reversion toward neutral in the first 24 hours is common.
6. Alerts Suite
Pre-bundled conditions let you automate workflows:
• Bullish / Bearish zero crosses – queue spot or futures entries.
• Standard OB / OS – notify for first contact with actionable zones.
• Extreme OB / OS – prime time to review hedges, take profits or build contrarian swing positions.
7. Parameter Playground
• Shorten ROC Lookback to 14 for tactical traders; lengthen to 90 for macro investors.
• Raise extreme thresholds (for example ±80) when plotting on altcoins that exhibit higher volatility than BTC.
• Try HMA smoothing for responsive yet smooth curves on intraday charts.
• Colour-blind users can easily swap bull and bear palette selections for preferred contrasts.
8. Limitations and Best Practices
• The Fed Funds series is step-wise; it only changes on meeting days. Rapid BTC oscillations in between may dominate the calculation. Keep that perspective when interpreting very high-frequency signals.
• Divergence does not equal causation. Crypto-native catalysts (ETF approvals, hack headlines) can overwhelm macro links temporarily.
• Use in conjunction with classical confirmation tools—order-flow footprints, market-profile ledges, or simple price action to avoid “pure-indicator” traps.
9. Final Thoughts
The FEDFUNDS Rate Divergence Oscillator distills an entire macro narrative monetary policy versus risk sentiment into a single colourful heartbeat. It will not magically predict every pivot, yet it excels at framing market context, spotting stretches and timing regime changes. Treat it as a strategic compass rather than a tactical sniper scope, combine it with sound risk management and multi-factor confirmation, and you will possess a robust edge anchored in the world’s most influential interest-rate benchmark.
Trade consciously, stay adaptive, and let the policy-price tension guide your roadmap.

Detailed Monthly Seasonality Table By TheNextronThe "Detailed Monthly Seasonality Table" script is a Pine Script v6 TradingView indicator designed to visually analyze monthly performance trends for any security. It computes and displays how price behaves month-by-month over a user-defined number of years, offering a clean, data-rich dashboard for evaluating seasonal trading patterns.
📊 Purpose:
To help traders identify which months tend to be bullish or bearish, and how consistently the price reacts during those months, based on historical closing prices.
🧩 Key Features:
✅ User Inputs
Years to Analyze: How many past years to include in the analysis (e.g., 5–20 years).
Result Display Options:
% Change or Point Change
Toggle to show absolute performance or color-coded gain/loss
📅 Monthly Analysis Logic
For each month (Jan to Dec), the script:
Gathers historical data year by year
Calculates monthly return based on selected price type
📋 Dashboard Output
A custom table on the chart showing:
Each month's average % return
Win rate
Number of times the month was positive (green) or negative (red)

R Manager PRO++ – Multi-Setup Risk/Reward ToolDescription
The R Manager PRO++ V1.3d is an advanced risk/reward management tool designed for traders who want to visually plan, track, and manage multiple trade setups directly on their charts.
This script allows you to plot up to three independent setups (A, B, and C) simultaneously. For each setup, you can manually input your Entry and Stop Loss levels, and the tool will automatically calculate and display R-multiple levels (1R to 5R), providing a clear overview of your potential profit targets.
Key Features
Multi-Setup Management (A, B, C)
Track up to three separate trades at the same time, each with individual colors and controls.
Manual Entry & Stop Loss Input
Enter your trade levels manually for flexible usage across any market or strategy.
Automatic R-Multiple Calculation (1R to 5R)
The indicator automatically draws lines and labels for 1R to 5R targets based on your risk distance.
Live R Display
Real-time calculation of your current R multiple, updating with every price move.
Custom Symbol Selection
Link each setup to a specific symbol (e.g., EURUSD, XAUUSD, NAS100) to manage multiple markets without clutter.
Reset Function
One-click reset button to quickly clear individual setups.
Alerts for Reached R-Levels
Receive alerts when price reaches each R level (1R to 5R) to monitor trades without constant chart-watching.
How to Use
- Select Entry and Stop Loss levels manually in the input panel.
- Choose the symbol for each setup (supports Forex, Indices, Gold).
- Enable or disable setups individually with the Activate checkbox.
- Optional: Use the Reset button to clear a setup quickly.
- Monitor R-multiples visually and via alerts as price evolves.
Suitable For
- Swing traders
- Day traders
- Risk-based trading strategies (R-multiples)
- Multi-market portfolio management
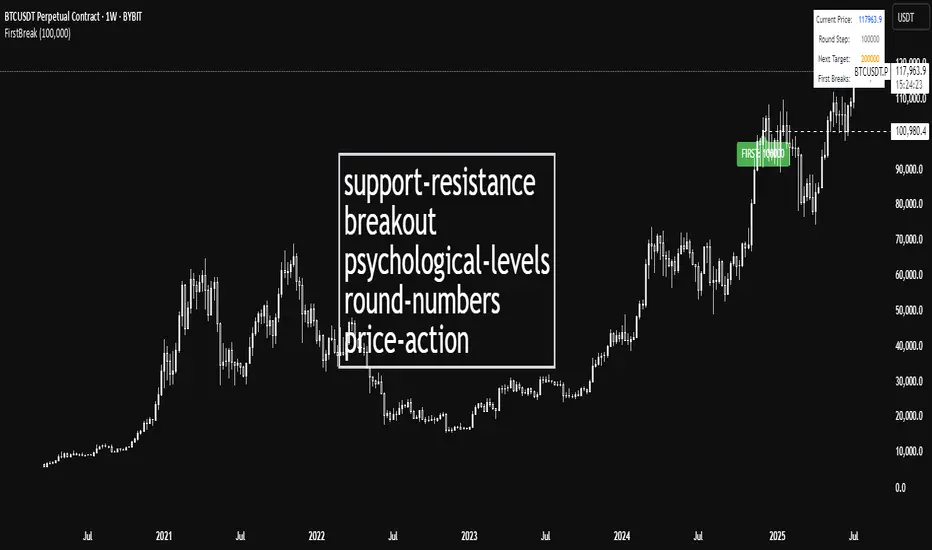
First Round Break TrackerA simple indicator that tracks the first-time breakouts of round number levels (psychological levels) on any chart. Clean interface with minimal configuration needed
First Breakout Only : Marks each round level only once when broken for the first time
Customizable Step Size : Adjustable round number intervals (e.g., 100, 1000, 10000 etc.)
Clean Visual Alerts : Green labels with "FIRST:" prefix appear exactly at breakout moments
Real-time Info Panel : Shows current price, next target level, and total breakouts count
Elite Display# 😎 Elite Display - Simple Chart Info with Style
**Never lose track of what you're looking at!**
A clean, fun way to display your asset name, timeframe, and daily performance directly on your chart. Created by ** ** for traders who like their charts both informative and stylish.
## 📊 **What it shows:**
- Asset name (BTCUSDT) or description (Bitcoin/TetherUS)
- Current timeframe (1H, 4H, 1D, etc.)
- Daily % change with green/red colors
**Example:** `BTCUSDT | 1H | +2.45%`
## 🎨 **Make it yours:**
- **60+ separator styles** - From classic `|` to fun emojis 🚀💎⚡
- **Mood mode** - Separators react to your performance (😄 for gains, 😢 for losses)
- **Position anywhere** - 9 spots on your chart
- **Custom styling** - Colors, fonts, sizes, bold/italic
## 🎯 **Perfect for:**
- Multi-timeframe analysis (never forget which TF you're on!)
- Taking clean screenshots for social media
- Avoiding "wait, what symbol is this?" moments
- Adding a bit of personality to your workspace
## ⚙️ **Super simple setup:**
1. Add to chart
2. Pick what to show (asset/timeframe/both)
3. Choose your style (classic, fun, or reactive mood)
4. Position it wherever you want
5. Done!
**It's just chart info... but way more fun!** 😊
*Works on all markets: Stocks, Crypto, Forex, Commodities*# 📊 TradingHUD - Your Smart Chart Companion
**Transform your charts with the ultimate context display!** Never lose track of your symbol, timeframe, and performance again. This highly customizable indicator brings personality and clarity to your trading workspace.
## 🚀 **Key Features:**
✅ **5 Display Modes:**
- Asset Name (ticker only)
- Full Description (complete name)
- Both combined
- Timeframe Only
- Daily Variation Only
✅ **60+ Separator Styles in 3 Categories:**
- 🎨 **Classic** (15): Professional symbols (|, •, →, ★, etc.)
- 🎉 **Fun** (20): Colorful objects (🚀, 💎, ⚡, 🎯, 💰, etc.)
- 🎭 **Mood** (40+): Reactive yellow faces!
- 😄 **Happy** (21): 😀😊🥰😎🥳 (for green gains)
- 😢 **Sad** (23): 😢😭🥺😞😩 (for red losses)
✅ **Intelligent Variation Display:**
- Daily % change with smart color coding
- Green/red performance tracking
- Only appears on relevant timeframes (intraday + daily)
- Automatically hidden on weekly/monthly
✅ **Ultimate Customization:**
- 9 positioning options anywhere on chart
- Font families: Default or Monospace
- Bold/italic text formatting
- Custom colors and sizes
- Flexible element ordering
## 🎭 **Mood Mode Magic:**
Watch your separators celebrate wins with 😄🤑🚀 or empathize with losses using 😢😭💸. Toggle this emotional feature on/off anytime!
## 💡 **Perfect For:**
- Multi-timeframe analysis
- Screenshot documentation with context
- Avoiding symbol confusion
- Real-time performance tracking
- Adding personality to professional charts
- Social media trading posts
## ⚙️ **Quick Setup:**
1. Add TradingHUD to your chart
2. Select display mode (Asset/Description/Both/etc.)
3. Choose separator style (Classic/Fun/Mood)
4. Position anywhere you want
5. Customize colors, fonts, and formatting
6. Trade with confidence and style!
## 🎯 **Live Examples:**
- **Classic**: `BTCUSDT | 1H | +2.45%`
- **Fun**: `AAPL 🚀 4H 🚀 -1.23%`
- **Happy Mood**: `Gold 😄 1D 😄 +3.67%`
- **Sad Mood**: `BTC 😢 15min 😢 -5.12%`
**Professional meets personality. Context meets creativity. This is TradingHUD.** 📈✨
*Compatible with all markets: Stocks, Crypto, Forex, Commodities, Indices*
Signalgo MASignalgo MA is a TradingView indicator based on moving average (MA) trading by combining multi-timeframe logic, trend strength filtering, and adaptive trade management. Here’s a deep dive into how it works, its features, and why it stands apart from traditional MA indicators.
How Signalgo MA Works
1. Multi-Timeframe Moving Average Analysis
Simultaneous EMA & SMA Tracking: Signalgo MA calculates exponential (EMA) and simple (SMA) moving averages across a wide range of timeframes—from 1 minute to 3 months.
Layered Cross Detection: It detects crossovers and crossunders on each timeframe, allowing for both micro and macro trend detection.
Synchronized Signal Mapping: Instead of acting on a single crossover, the indicator requires agreement across multiple timeframes to trigger signals, filtering out noise and false positives.
2. Trend Strength & Quality Filtering
ADX Trend Filter: Trades are only considered when the Average Directional Index (ADX) confirms a strong trend, ensuring signals are not triggered during choppy or directionless markets.
Volume & Momentum Confirmation: For the strongest signals, the system requires:
A significant volume spike
Price above/below a longer-term EMA (for buys/sells)
RSI momentum confirmation
One-Time Event Detection: Each crossover event is flagged only once per occurrence, preventing repeated signals from the same move.
Inputs
Preset Parameters:
EMA & SMA Lengths: Optimized for both short-term and long-term analysis.
ADX Length & Minimum: Sets the threshold for what is considered a “strong” trend.
Show Labels/Table: Visual toggles for displaying signal and trade management information.
Trade Management:
Show TP/SL Logic: Toggle to display or hide take-profit (TP) and stop-loss (SL) levels.
ATR Length & Multipliers: Fine-tune how SL and TP levels adapt to market volatility.
Enable Trailing Stop: Option to activate dynamic stop movement after TP1.
Entry & Exit Strategy
Entry Logic
Long (Buy) Entry: Triggered when multiple timeframes confirm bullish EMA/SMA crossovers, ADX confirms trend strength, and all volume/momentum filters align.
Short (Sell) Entry: Triggered when multiple timeframes confirm bearish crossunders, with the same strict filtering.
Exit & Trade Management
Stop Loss (SL): Automatically set based on recent volatility (ATR), adapting to current market conditions.
Take Profits (TP1, TP2, TP3): Three profit targets at increasing reward multiples, allowing for flexible trade management.
Trailing Stop: After TP1 is hit, the stop loss moves to breakeven and a trailing stop is activated to lock in further gains.
Event Markers: Each time a TP or SL is hit, a visual label is placed on the chart for full transparency.
Strict Signal Quality Filters: Signals are only generated when volume spikes, momentum, and trend strength all align, dramatically reducing false positives.
Adaptive, Automated Trade Management: Built-in TP/SL and trailing logic mean you get not just signals, but a full trade management suite, rarely found in standard MA indicators.
Event-Driven, Not Static: Each signal is triggered only once per event, eliminating repetitive or redundant entries.
Visual & Alert Integration: Every signal and trade event is visually marked and can trigger TradingView alerts, keeping you informed in real time.
Trading Strategy Application
Versatility: Suitable for scalping, day trading, swing trading, and longer-term positions thanks to its multi-timeframe logic.
Noise Reduction: The layered filtering logic means you only see the highest-probability setups, helping you avoid common MA “fakeouts” and overtrading.
So basically what separates Signalgo MA from traditional MA indicators?
1. Multi-Timeframe Analysis
Traditional MA indicators: Usually measure crossovers or signals within a single timeframe.
Signalgo MA: simultaneously calculates fast/slow EMAs & SMAs for multiple periods. This enables it to create signals based on synchronized or stacked momentum across multiple periods, offering broader trend confirmation and reducing noise from single-timeframe signals.
2. Combinatorial Signal Logic
Traditional: A basic crossover is typically “if fast MA crosses above/below slow MA, signal buy/sell.”
Signalgo MA: Generates signals only when MA crossovers align across several timeframes, plus takes into consideration the presence or absence of conflicting signals in shorter or longer frames. This reduces false positives and increases selectivity.
3. Trend Strength Filtering (ADX Integration)
Traditional: Many MA indicators are “blind” to trend intensity, potentially triggering signals in low volatility or ranging conditions.
Signalgo MA: Employs ADX as a minimum trend filter. Signals will only fire if the trend is sufficiently strong, reducing whipsaws in choppy or sideways markets.
4. Volume & Strict Confirmation Layer
Traditional: Few MA indicators directly consider volume or require confluence with other major indicators.
Signalgo MA: Introduces a “strict signal” filter that requires not only MA crossovers and trend strength, but also (on designated frames):
Significant volume spike,
Price positioned above/below a higher timeframe EMA (trend anchor),
RSI momentum confirmation.
5. Persistent, Multi-Level TP/SL Automated Trade Management
Traditional: Separate scripts or manual management for stop-loss, take-profit, and trailing-stops, rarely fully integrated visually.
Signalgo MA: Auto-plots up to three take-profit levels, initial stop, and a trailing stop (all ATR-based) on the chart. It also re-labels these as they are hit and resets for each new entry, supporting full trade lifecycle visualization directly on the chart.
6. Higher Timeframe SMA Crosses for Long-Term Context
Traditional: Focuses only on the current chart’s timeframe.
Signalgo MA: Incorporates SMA cross logic for weekly, monthly, and quarterly periods, which can contextualize lower timeframe trades within broader cycles, helping filter against counter-trend signals.
7. “Signal Once” Logic to Prevent Over-Trading
Traditional: Will often re-fire the same signal repeatedly as long as the condition is true, possibly resulting in signal clusters and over-trading.
Signalgo MA: Fires each signal only once per condition—prevents duplicate alerts for the same trade context.

Signalgo BBSignalgo BB: Technical Overview
Signalgo BB is a Bollinger Bands (BB) indicator for TradingView, designed to provide a multi-dimensional view of volatility, trend, and trading opportunities within a single overlay. Below is a detailed, impartial explanation of its workings, inputs, and trading logic.
Core Mechanics
Signalgo BB operates on the principle of nested volatility bands and moving averages. It calculates:
Fast & Slow Bands: Two sets of Bollinger Bands (BB), using different moving average types (EMA or SMA), lengths, and standard deviation multipliers.
Volatility Cloud: A dynamic visual layer indicating when price is inside both, one, or neither band.
Filtering: A short-term RSI is used to confirm trend direction and filter out weak signals.
Inputs & Components
MA Type: Choice between EMA, SMA for both fast and slow MA calculations.
Fast/Slow Lengths
Fast/Slow Deviations
RSI Length/Thresholds
Show Cloud: Toggle for the visual volatility cloud.
Signal Mode: Band Break.
Prevent Repeated Signals: Option to suppress duplicate signals in the same direction.
TP/SL & Trailing Logic: Advanced, automated trade management with ATR-based distances, three take-profit levels, and a dynamic trailing stop.
Signal Generation
Band Break: Triggers when price crosses the fast BB band.
RSI Filter: All signals require RSI confirmation.
Prevent Repeated Signals: Optionally only marks the first breakout in a series to reduce overtrading.
Entry/Exit Marks: Labels are plotted for visual clarity, and signals can trigger TradingView alerts.
Trade Management
Stop Loss (SL): Set at a multiple of ATR from the entry price, adapting to current volatility.
Take Profits (TP1, TP2, TP3): Three levels scaled by risk-reward ratios, supporting partial exits.
Trailing Stop: After the first TP is hit, SL moves to breakeven and then trails at a user-defined multiple of ATR, locking in further gains.
Event Markers: Each TP, SL, and trailing stop event is labeled on the chart.
Direction State: The indicator tracks active trades, allowing for only one open position per direction at a time.
Cloud Visualization: The background color changes depending on whether price is inside both, one, or no bands, making it easier to visualize market conditions.
Multiple Signal Logics: It doesn’t just look at breakouts, it includes cloud crossings, mean reversion, and a choice of how to combine them.
Rigorous Filtering: Signals require RSI trend confirmation, reducing false entries during weak phases.
Automated Trade Management: Built-in TP/SL and trailing logic, dynamically adapting to volatility.
Signal Suppression: Option to prevent repeated signals, reducing noise and overtrading.
Customizable MA Types: Supports EMA, SMA, and a selection algorithm for future expansion.
Trading Strategy Application
Volatility Regimes: The cloud’s color indicates whether price is inside, between, or outside the bands, helping traders identify trending, ranging, or breakout conditions.
Signals: entries can be based on breakouts filtered by RSI trend strength.
Risk Management: All active trades are managed by TP/SL logic, trailing stops after TP1, and visual feedback on exits.
Visual Alerts: Both signals and TP/SL events are marked on the chart for manual review.
Flexibility: Users can switch modes or suppress repeated signals as needed, depending on trading style.
Practical Usage
Intraday to Swing: Suitable for timeframes from minutes to days, depending on the MA periods and volatility profile.
Manual or Automated: The visual overlay and alerts support both manual trading and automated strategies.
Education & Review: The colored cloud and event markers make it easy to review past price action and learn from signals.
What separates this indicator from traditional ones:
1. Dual Bollinger Bands
Traditional: Most indicators use a single set of Bollinger Bands (two standard deviations above/below a moving average).
Signalgo BB: Implements two sets of bands—a "fast" set (shorter moving average, narrower deviation) and a "slow" set (longer moving average, wider deviation). This provides both immediate (fast) and broader context (slow) for volatility and price action.
2. Volatility Cloud Visualization
Traditional: Standard Bollinger Bands display as two lines, with the area between sometimes shaded as a "band" but without dynamic color changes.
Signalgo BB: The background is colored differently depending on whether price is within both, one, or neither band, offering a visual "cloud" that distinguishes trending, ranging, or breakout regimes at a glance.
3. RSI Filtering
Traditional: Many indicators either don’t filter signals, or if they do, it’s not always configurable.
Signalgo BB: Adds an optional RSI filter, requiring signals to be confirmed by short-term RSI overbought/oversold conditions. This reduces false signals in range-bound or low-trend environments.
4. Prevention of Repeated Signals
Traditional: Most indicators will keep firing signals as long as conditions are met, which can cause overtrading.
Signalgo BB: Offers a user-toggleable option to suppress repeated signals in the same direction until the opposite signal occurs. This reduces noise for discretionary traders.
5. Integrated Trade Management
Traditional: Manual or separate coding is required for stop-loss, take-profit, and trailing stop logic.
Signalgo BB: Builds in dynamic, ATR-based stop-loss; up to three take-profit levels and a trailing stop that activates after the first TP is hit. All levels are visually plotted on the chart, and events (TP/SL hits) are labeled, aiding strategy review and automation.
6. Event Labeling and Alerts
Traditional: Alerts may exist for entry/exit, but rarely for each TP/SL event.
Signalgo BB: Places labels for every entry, exit, and TP/SL event. It also provides TradingView alertconditions for each event, enabling automated notifications or integration with trading bots.
7. Directional State Tracking
Traditional: Indicators typically do not track the "state" of a trade (e.g., active long/short/flat) beyond simple signals.
Signalgo BB: Maintains persistent variables for entry price, SL, TP, trailing stop, and trade direction, ensuring only one active signal per direction. This prevents overlapping entries and mimics realistic trade management.
8. User Customization
Traditional: Default settings are often hardcoded, or customization is limited.
Signalgo BB: Offers extensive user inputs for MA type and TP/SL logic—making the tool adaptable to many strategies and timeframes.

Editable Trade Checklist by Andrei Editable Trade Checklist by Andrei Indicator
This script adds a customizable trade checklist directly onto your chart, helping traders stay disciplined and consistent. It’s designed for discretionary strategies where traders want to visually confirm their rules are met before taking a position.
What It Does
• Displays a visual checklist with up to 10 custom rules
• Each rule uses a checkbox (✔ = Yes, ☐ = No)
• Supports structured decision-making before trade entries
How It Works
In the Inputs tab, you can:
• Rename each checklist item to match your trading plan
• Mark conditions as Yes (checked) or No (unchecked)
• Customize the header and table colors
• Adjust text size for easier viewing — especially useful on mobile
• The checklist appears as a fixed panel on your chart that can be moved to any corner for flexibility
How to Use It
• Add the indicator to your chart
• Open the settings to define your checklist items
• Use checkboxes to track which rules are met
• Review your checklist before taking trades to stay aligned with your strategy
This tool does not produce buy/sell signals — it's built to support manual trade planning and reinforce consistency.
Publishing Notes
This indicator works independently and is published on a clean chart as required. No other scripts or drawings are included. Custom drawings or tools may be used by the trader but are not part of this script.

Directional Market Efficiency [QuantAlgo]🟢 Overview
The Directional Market Efficiency indicator is an advanced trend analysis tool that measures how efficiently price moves in a given direction relative to the total price movement over a specified period. Unlike traditional momentum oscillators that only measure price change magnitude, this indicator combines efficiency measurement with directional bias to provide a comprehensive view of market behavior ranging from -1 (perfectly efficient downward movement) to +1 (perfectly efficient upward movement).
The indicator transforms the classic Efficiency Ratio concept by incorporating directional bias, creating a normalized oscillator that simultaneously reveals trend strength, direction, and market regime (trending vs. ranging). This dual-purpose functionality helps traders and investors identify high-probability trend continuation opportunities while filtering out choppy, inefficient price movements that often lead to false signals and whipsaws.
🟢 How It Works
The indicator employs a sophisticated two-step calculation process that first measures pure efficiency, then applies directional weighting to create the final signal. The efficiency calculation compares the absolute net price change over a lookback period to the sum of all individual bar-to-bar price movements during that same period. This ratio reveals how much of the total price movement contributed to actual progress in a specific direction.
The directional component applies the mathematical sign of the net price change (positive for upward movement, negative for downward movement) to the efficiency ratio, creating values between -1 and +1. The resulting Directional Efficiency is then smoothed using an Exponential Moving Average to reduce noise while maintaining responsiveness. Additionally, the system incorporates a configurable threshold level that distinguishes between trending markets (high efficiency) and ranging markets (low efficiency), enabling regime-based analysis and strategy adaptation.
🟢 How to Use
1. Signal Interpretation and Market Regime Analysis
Positive Territory (Above Zero): Indicates efficient upward price movement with bullish directional bias and favorable conditions for long positions
Negative Territory (Below Zero): Signals efficient downward price movement with bearish directional bias and favorable conditions for short positions
High Absolute Values (±0.4 to ±1.0): Represent highly efficient trending conditions with strong directional conviction and reduced noise
Low Absolute Values (±0.1 to ±0.3): Suggest ranging or consolidating markets with inefficient price movement and increased whipsaw risk
Zero Line Crosses: Mark critical directional shifts and provide primary entry/exit signals for trend-following strategies
2. Threshold-Based Market Regime Classification
Above Threshold (Trending Markets): When efficiency exceeds the threshold level, markets are classified as trending, favoring momentum strategies
Below Threshold (Ranging Markets): When efficiency falls below the threshold, markets are classified as ranging, favoring mean reversion approaches
3. Preset Configurations for Different Trading Styles
Default
Universally applicable configuration optimized for medium-term analysis across multiple timeframes and asset classes, providing balanced sensitivity and noise filtering.
Scalping
Highly responsive setup for ultra-short-term trades with increased sensitivity to quick efficiency changes. Best suited for 1-15 minute charts and rapid-fire trading approaches.
Swing Trading
Designed for multi-day position holding with enhanced noise filtering and focus on sustained efficiency trends. Optimal for 1-4 hour and daily timeframe analysis.
🟢 Pro Tips for Trading and Investing
→ Trend Continuation Filter: Enter long positions when Directional Efficiency crosses above zero in trending markets (above threshold) and short positions when crossing below zero, ensuring alignment with efficient price movement.
→ Range Trading Optimization: In ranging markets (below threshold), take profits on extreme readings and enter mean reversion trades when efficiency approaches zero from either direction.
→ Multi-Timeframe Confluence: Combine higher timeframe trend direction with lower timeframe efficiency signals for optimal entry timing.
→ Risk Management Enhancement: Reduce position sizes or avoid new entries when efficiency readings are weak (near zero), as these conditions indicate higher probability of choppy, unpredictable price movement.
→ Signal Strength Assessment: Prioritize trades with high absolute efficiency values (±0.4 or higher) as these represent the most reliable directional moves with reduced likelihood of immediate reversal.
→ Regime Transition Trading: Watch for efficiency threshold breaks combined with directional changes as these often mark significant trend initiation or termination points requiring strategic position adjustments.
→ Alert Integration: Utilize the built-in alert system for real time notifications of zero-line crosses, threshold breaks, and regime changes to maintain constant market awareness without continuous chart monitoring.

Ultimate Market Structure [Alpha Extract]Ultimate Market Structure
A comprehensive market structure analysis tool that combines advanced swing point detection, imbalance zone identification, and intelligent break analysis to identify high-probability trading opportunities.Utilizing a sophisticated trend scoring system, this indicator classifies market conditions and provides clear signals for structure breaks, directional changes, and fair value gap detection with institutional-grade precision.
🔶 Advanced Swing Point Detection
Identifies pivot highs and lows using configurable lookback periods with optional close-based analysis for cleaner signals. The system automatically labels swing points as Higher Highs (HH), Lower Highs (LH), Higher Lows (HL), and Lower Lows (LL) while providing advanced classifications including "rising_high", "falling_high", "rising_low", "falling_low", "peak_high", and "valley_low" for nuanced market analysis.
swingHighPrice = useClosesForStructure ? ta.pivothigh(close, swingLength, swingLength) : ta.pivothigh(high, swingLength, swingLength)
swingLowPrice = useClosesForStructure ? ta.pivotlow(close, swingLength, swingLength) : ta.pivotlow(low, swingLength, swingLength)
classification = classifyStructurePoint(structureHighPrice, upperStructure, true)
significance = calculateSignificance(structureHighPrice, upperStructure, true)
🔶 Significance Scoring System
Each structure point receives a significance level on a 1-5 scale based on its distance from previous points, helping prioritize the most important levels. This intelligent scoring system ensures traders focus on the most meaningful structure breaks while filtering out minor noise.
🔶 Comprehensive Trend Analysis
Calculates momentum, strength, direction, and confidence levels using volatility-normalized price changes and multi-timeframe correlation. The system provides real-time trend state tracking with bullish (+1), bearish (-1), or neutral (0) direction assessment and 0-100 confidence scoring.
// Calculate trend momentum using rate of change and volatility
calculateTrendMomentum(lookback) =>
priceChange = (close - close ) / close * 100
avgVolatility = ta.atr(lookback) / close * 100
momentum = priceChange / (avgVolatility + 0.0001)
momentum
// Calculate trend strength using multiple timeframe correlation
calculateTrendStrength(shortPeriod, longPeriod) =>
shortMA = ta.sma(close, shortPeriod)
longMA = ta.sma(close, longPeriod)
separation = math.abs(shortMA - longMA) / longMA * 100
strength = separation * slopeAlignment
❓How It Works
🔶 Imbalance Zone Detection
Identifies Fair Value Gaps (FVGs) between consecutive candles where price gaps create unfilled areas. These zones are displayed as semi-transparent boxes with optional center line mitigation tracking, highlighting potential support and resistance levels where institutional players often react.
// Detect Fair Value Gaps
detectPriceImbalance() =>
currentHigh = high
currentLow = low
refHigh = high
refLow = low
if currentOpen > currentClose
if currentHigh - refLow < 0
upperBound = currentClose - (currentClose - refLow)
lowerBound = currentClose - (currentClose - currentHigh)
centerPoint = (upperBound + lowerBound) / 2
newZone = ImbalanceZone.new(
zoneBox = box.new(bar_index, upperBound, rightEdge, lowerBound,
bgcolor=bullishImbalanceColor, border_color=hiddenColor)
)
🔶 Structure Break Analysis
Determines Break of Structure (BOS) for trend continuation and Directional Change (DC) for trend reversals with advanced classification as "continuation", "reversal", or "neutral". The system compares pre-trend and post-trend states for each break, providing comprehensive trend change momentum analysis.
🔶 Intelligent Zone Management
Features partial mitigation tracking when price enters but doesn't fully fill zones, with automatic zone boundary adjustment during partial fills. Smart array management keeps only recent structure points for optimal performance while preventing duplicate signals from the same level.
🔶 Liquidity Zone Detection
Automatically identifies potential liquidity zones at key structure points for institutional trading analysis. The system tracks broken structure points and provides adaptive zone extension with configurable time-based limits for imbalance areas.
🔶 Visual Structure Mapping
Provides clear visual indicators including swing labels with color-coded significance levels, dashed lines connecting break points with BOS/DC labels, and break signals for continuation and reversal patterns. The adaptive zones feature smart management with automatic mitigation tracking.
🔶 Market Structure Interpretation
HH/HL patterns indicate bullish market structure with trend continuation likelihood, while LH/LL patterns signal bearish structure with downtrend continuation expected. BOS signals represent structure breaks in trend direction for continuation opportunities, while DC signals warn of potential reversals.
🔶 Performance Optimization
Automatic cleanup of old structure points (keeps last 8 points), recent break tracking (keeps last 5 break events), and efficient array management ensure smooth performance across all timeframes and market conditions.
Why Choose Ultimate Market Structure ?
This indicator provides traders with institutional-grade market structure analysis, combining multiple analytical approaches into one comprehensive tool. By identifying key structure levels, imbalance zones, and break patterns with advanced significance scoring, it helps traders understand market dynamics and position themselves for high-probability trade setups in alignment with smart money concepts. The sophisticated trend scoring system and intelligent zone management make it an essential tool for any serious trader looking to decode market structure with precision and confidence.

Candle close on high time frameOVERVIEW
This indicator plots persistent closing levels of higher time frame candles (H1, H4, and Daily) on the active intraday chart in real time. Unlike similar tools, it offers granular control over line projection length, fully independent toggles per timeframe, and a built-in mechanism that automatically limits the total number of historical levels to avoid chart clutter and performance issues.
CONCEPTS
Key levels from higher time frames often act as areas where price reacts or consolidates. By projecting each candle's exact closing price forward as a horizontal reference, traders can quickly identify dynamic support and resistance zones relevant to the current price action. This indicator enables seamless multi-timeframe analysis without the need to manually switch chart intervals or re-draw lines.
FEATURES
Independent Time Frame Selection: Enable or disable H1, H4, and Daily levels individually to tailor the analysis.
Custom Extension Length: Each timeframe's closing level can be projected forward for a user-defined number of bars.
Performance Optimization: The script maintains an internal limit (default: 100) on the number of active lines. When this threshold is exceeded, the oldest lines are removed automatically.
Visual Differentiation: Colors for each timeframe are fully customizable, enabling immediate recognition of level origin.
Immediate Update: New levels appear as soon as a higher timeframe candle closes, ensuring real-time reference.
USAGE
From the indicator inputs, select which timeframes you want to track.
Adjust the extension lengths to fit your trading style and time horizon.
Customize the line colors for clarity and personal preference.
Use these projected levels as part of your confluence criteria for entries, exits, or stop placement.
Combine with trend indicators or price action tools to enhance your multi-timeframe strategy.
ORIGINALITY AND ADDED VALUE
While similar scripts exist that plot higher timeframe levels, this implementation differs in:
Its efficient automatic cleanup of old lines to preserve chart performance.
The independent extension and color settings per timeframe.
Immediate reaction to new candle closes without repainting.
Simplicity of use combined with precise customization.
This combination makes it a practical and flexible tool for traders who rely on clear HTF level visualization without manual drawing or the limitations of built-in TradingView tools.
LICENSE
This script is published open-source under the Mozilla Public License 2.0.

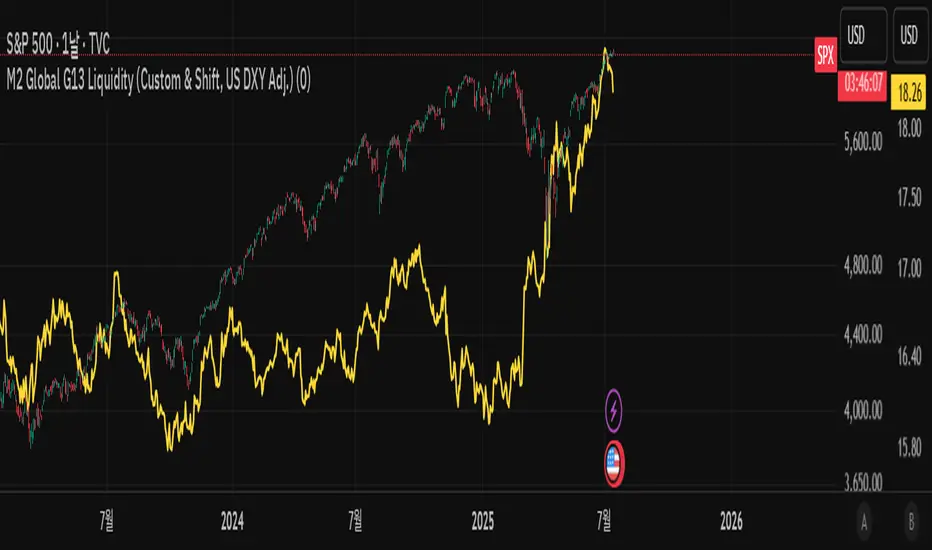
M2 Global G13 Liquidity (Custom & Shift, US DXY Adj.)🌎 M2 Global G13 Liquidity index (Custom & Shift, US DXY Adj.)
💡 Indicator Overview
The M2 Global G13 Liquidity indicator combines the M2 liquidity of 13 major countries, allowing users to selectively include or exclude each country to visualize global capital flows and potential investment liquidity at a glance.
Each country's M2 data is converted to USD using real-time exchange rates, and the US M2 is further adjusted using the Dollar Index (DXY) to reflect the impact of dollar strength or weakness on US liquidity.
✅ What is M2?
M2 is a broad measure of money supply that includes cash, demand deposits, savings deposits, and certain financial products.
It represents a country's overall liquidity and capital supply and is often interpreted as "dry powder" ready to be deployed into various assets such as equities, real estate, and bonds.
Therefore, M2 serves as a crucial benchmark for assessing a country's potential investment capacity that can flow into markets at any time.
💰 Exchange Rate & Dollar Index Adjustment
- All country M2 data is converted from local currencies to USD.
- The US M2 is further adjusted using the Dollar Index (DXY) to better reflect its real global power:
- DXY > 100 → Liquidity contraction (strong dollar effect)
- DXY < 100 → Liquidity expansion (weak dollar effect)
🗺️ Country Selection Options
- Default selection: United States
- Major selections: China, Eurozone, Japan, United Kingdom (core G5 economies)
- Additional selections: Switzerland, Canada, India, Russia, Brazil, South Korea, Mexico, South Africa
- Users can freely add or remove countries to customize the indicator to match their analytical needs.
📈 Example Use Cases
- Monitor global capital flows: Track worldwide liquidity trends and detect potential market risk signals.
- Analyze exchange rate and monetary policy trends: Compare dollar strength with major central bank policies.
- Benchmark against equity indices: Evaluate correlations with MSCI World, KOSPI, NASDAQ, etc.
- Valuation analysis: Compare overall liquidity levels to equity index prices or market capitalization to assess relative valuation and identify potential overvaluation or undervaluation.
- Crisis response strategy: Identify liquidity contraction during global credit crises or deleveraging phases.
==================================================
🌎 M2 글로벌 G13 유동성 지수 (Custom & Shift, US DXY Adj.)
💡 지표 소개
M2 Global G13 Liquidity 지표는 세계 13개 주요국의 M2 유동성을 선택적으로 결합하여, 글로벌 자금 흐름과 잠재 투자 자금을 한눈에 시각화할 수 있도록 설계된 종합 유동성 지표입니다.
국가별 M2 데이터를 환율과 결합해 달러 기준으로 표준화하며, 특히 미국 M2는 달러지수(DXY)로 보정하여 달러 강약에 따른 파급력을 반영합니다.
✅ M2란?
M2는 광의 통화지표로, 현금 + 요구불 예금 + 저축성 예금 + 일부 금융상품을 포함합니다.
이는 한 국가의 유동성 수준과 자금 공급 상태를 나타내는 핵심 거시경제 지표이며, **주식·부동산·채권 등 다양한 자산에 투자될 준비가 된 '대기자금'**으로도 해석됩니다.
따라서 M2는 투자시장으로 언제든지 흘러들어갈 수 있는 잠재적 투자 역량을 평가할 때 중요한 기준입니다.
💰 환율 및 달러지수 보정
- 모든 국가 M2는 자국 통화에서 **달러(USD)**로 환산됩니다.
- 특히 미국 M2는 달러 가치의 글로벌 실질 파워를 평가하기 위해 DXY 보정을 적용합니다.
- DXY > 100 → 유동성 축소 (강달러 효과)
- DXY < 100 → 유동성 확대 (약달러 효과)
🗺️ 국가별 선택 옵션
- 기본 선택: 미국
- 주요 선택: 중국, 유로존, 일본, 영국 (주요 G5)
- 추가 선택: 스위스, 캐나다, 인도, 러시아, 브라질, 한국, 멕시코, 남아공
- 사용자는 각 국가를 자유롭게 더하거나 빼면서 커스터마이즈할 수 있습니다.
📈 활용 예시
- 글로벌 자금 흐름 모니터링: 전세계 유동성 추세 및 시장 리스크 신호 분석
- 환율/금리 정책 분석: 달러 강약과 주요국 정책 변화 비교
- 주가지수 벤치마크 비교: MSCI World, 코스피, 나스닥 등과 상관관계 확인
- 밸류에이션 분석: 전체 유동성 수준을 주가지수나 시가총액과 비교하여, 시장의 상대적 고평가·저평가 여부를 평가
- 위기 대응 전략: 글로벌 신용위기·자금 긴축 국면 대비
Global Risk Matrix [QuantAlgo]🟢 Overview
The Global Risk Matrix is a comprehensive macro risk assessment tool that aggregates multiple global financial indicators into a unified risk sentiment framework. It transforms diverse economic data streams (from currency strength and liquidity measures to volatility indices and commodity prices) into standardized Z-Score readings to identify market regime shifts across risk-on and risk-off conditions.
The indicator displays both a risk oscillator showing weighted average sentiment and a dynamic 2D matrix visualization that plots signal strength against momentum to reveal current market phase and historical evolution. This helps traders and investors understand broad market conditions, identify regime transitions, and align their strategies with prevailing macro risk environments across all asset classes.
🟢 How It Works
The indicator employs Z-Score normalization across various global macro components, each representing distinct aspects of market liquidity, sentiment, and economic health. Raw data from sources like DXY, S&P 500, Fed liquidity, global M2 money supply, VIX, and commodities undergoes statistical standardization. Several components are inverted (USDT.D, DXY, VIX, credit spreads, treasury bonds, gold) to align with risk-on interpretation, where positive values indicate bullish conditions.
This unique system applies configurable weights to each component based on selected asset class presets (Crypto Investor/Trader, Stock Trader, Commodity Trader, Forex Trader, Risk Parity, or Custom), creating a weighted average Z-Score. It then analyzes both signal strength and momentum direction to classify market conditions into four distinct phases: Risk-On (positive signal, rising momentum), Risk-Off (negative signal, falling momentum), Recovery (negative signal, rising momentum), and Weakening (positive signal, falling momentum). The 2D matrix visualization plots these dimensions with historical trail tracking to show regime evolution over time.
🟢 How to Use
1. Risk Oscillator Interpretation and Phase Analysis
Positive Territory (Above Zero) : Indicates risk-on conditions with capital flowing toward growth assets and higher risk tolerance
Negative Territory (Below Zero) : Signals risk-off sentiment with capital seeking safety and defensive positioning
Extreme Levels (±2.0) : Represent statistically significant deviations that often precede regime reversals or trend exhaustion
Zero Line Crosses : Mark critical transitions between risk regimes, providing early signals for portfolio rebalancing
Phase Color Coding : Green (Risk-On), Red (Risk-Off), Blue (Recovery), Yellow (Weakening) for immediate regime identification
2. Risk Matrix Visualization and Trail Analysis
Current Position Marker (⌾) : Shows real-time location in the risk/momentum space for immediate situational awareness
Historical Trail : Connected path showing recent market evolution and regime transition patterns
Quadrant Analysis : Risk-On (upper right), Risk-Off (lower left), Recovery (lower right), Weakening (upper left)
Trail Patterns : Clockwise rotation typically indicates healthy regime cycles, while erratic movement suggests uncertainty
3. Pro Tips for Trading and Investing
→ Portfolio Allocation Filter : Use Risk-On phases to increase exposure to growth assets, small caps, and emerging markets while reducing defensive positions during confirmed green phases
→ Entry Timing Enhancement : Combine Recovery phase signals with your technical analysis for optimal long entry points when macro headwinds are clearing but prices haven't fully recovered
→ Risk Management Overlay : Treat Weakening phase transitions as early warning systems to tighten stop losses, reduce position sizes, or hedge existing positions before full Risk-Off conditions develop
→ Sector Rotation Strategy : During Risk-On periods, favor cyclical sectors (technology, consumer discretionary, financials) while Risk-Off phases favor defensive sectors (utilities, consumer staples, healthcare)
→ Multi-Timeframe Confluence : Use daily matrix readings for strategic positioning while applying your regular technical analysis on lower timeframes for precise entry and exit execution
→ Divergence Detection : Watch for situations where your asset shows bullish technical patterns while the matrix shows Risk-Off conditions—these often provide the highest probability short opportunities and vice versa
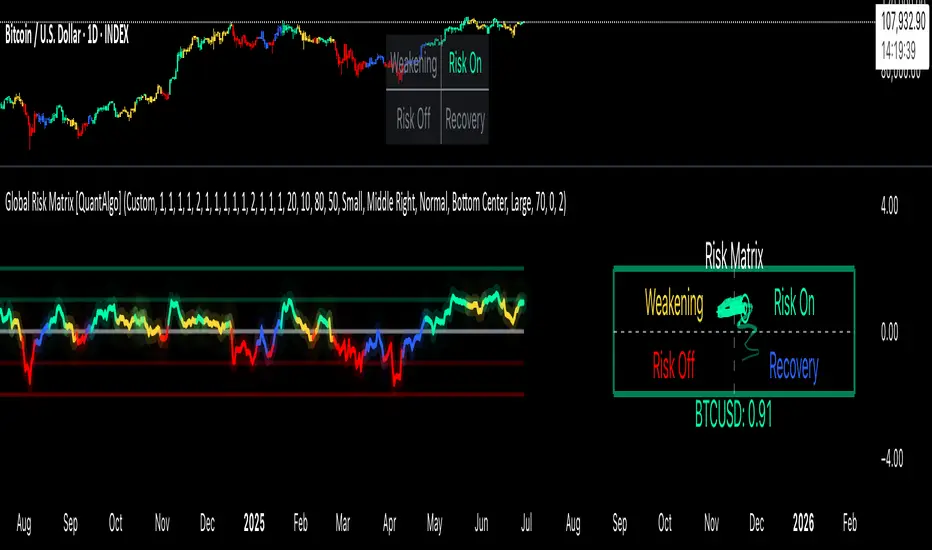
Volatility-Adjusted Momentum Score (VAMS) [QuantAlgo]🟢 Overview
The Volatility-Adjusted Momentum Score (VAMS) measures price momentum relative to current volatility conditions, creating a normalized indicator that identifies significant directional moves while filtering out market noise. It divides annualized momentum by annualized volatility to produce scores that remain comparable across different market environments and asset classes.
The indicator displays a smoothed VAMS Z-Score line with adaptive standard deviation bands and an information table showing real-time metrics. This dual-purpose design enables traders and investors to identify strong trend continuation signals when momentum persistently exceeds normal levels, while also spotting potential mean reversion opportunities when readings reach statistical extremes.
🟢 How It Works
The indicator calculates annualized momentum using a simple moving average of logarithmic returns over a specified period, then measures annualized volatility through the standard deviation of those same returns over a longer timeframe. The raw VAMS score divides momentum by volatility, creating a risk-adjusted measure where high volatility reduces scores and low volatility amplifies them.
This raw VAMS value undergoes Z-Score normalization using rolling statistical parameters, converting absolute readings into standardized deviations that show how current conditions compare to recent history. The normalized Z-Score receives exponential moving average smoothing to create the final VAMS line, reducing false signals while preserving sensitivity to meaningful momentum changes.
The visualization includes dynamically calculated standard deviation bands that adjust to recent VAMS behavior, creating statistical reference zones. The information table provides real-time numerical values for VAMS Z-Score, underlying momentum percentages, and current volatility readings with trend indicators.
🟢 How to Use
1. VAMS Z-Score Bands and Signal Interpretation
Above Mean Line: Momentum exceeds historical averages adjusted for volatility, indicating bullish conditions suitable for trend following
Below Mean Line: Momentum falls below statistical norms, suggesting bearish conditions or downward pressure
Mean Line Crossovers: Primary transition signals between bullish and bearish momentum regimes
1 Standard Deviation Breaks: Strong momentum conditions indicating statistically significant directional moves worth following
2 Standard Deviation Extremes: Rare momentum readings that often signal either powerful breakouts or exhaustion points
2. Information Table and Market Context
Z-Score Values: Current VAMS reading displayed in standard deviations (σ), showing how far momentum deviates from its statistical norm
Momentum Percentage: Underlying annualized momentum displayed as percentage return, quantifying the directional strength
Volatility Context: Current annualized volatility levels help interpret whether VAMS readings occur in high or low volatility environments
Trend Indicators: Directional arrows and change values provide immediate feedback on momentum shifts and market transitions
3. Strategy Applications and Alert System
Trend Following: Use sustained readings beyond the mean line and 1σ band penetrations for directional trades, especially when VAMS maintains position in upper or lower statistical zones
Mean Reversion: Focus on 2σ extreme readings for contrarian opportunities, particularly effective in sideways markets where momentum tends to revert to statistical norms
Alert Notifications: Built-in alerts for mean crossovers (regime changes), 1σ breaks (strong signals), and 2σ touches (extreme conditions) help monitor multiple instruments for both continuation and reversal setups

Pivot Liquidity Sweep [scalpmeister]📌 Pivot Liquidity Sweep
Scalp-oriented, liquidity sweep-based advanced signal and strategy indicator.
This indicator analyzes the price's sweeping of significant pivot levels and the subsequent breakouts to generate long/short signals based on different logics. It is sensitive to both classic sweep logic and strong reversal candles. Additionally, it visually marks liquidity gathering zones, offering excellent opportunities especially for scalp and intraday traders.
⚙️ Features and Strategy Types
🟢 Automatic Pivot Detection:
Pivot high/low levels are detected and stored based on the number of left and right bars.
🔴 Sweep Detection (Stop Hunt):
If the price violates a pivot level with a wick and closes inside, it is considered a sweep (liquidity cleaning). Strategies activate after this sweep.
🧠 5 Different Signal Styles:
SweepBreak:
It is expected that the extreme (high/low) level of the sweeping candle is broken with a close.
PivotBreak:
After the sweep, the first newly formed pivot in the trend direction is expected to break. (It is dynamically determined and drawn on the chart.)
StrongSweep:
It is sufficient if the candle following the sweep surpasses the previous candle with a single candle. No additional breakout is expected.
StrongCandle:
Strong momentum candles measured with a special RSI calculation are taken into account. It considers strong opposite-direction candles formed shortly after a pivot sweep.
ReversalCandleSweep:
Reversal candles that close in the opposite direction after a sweep (e.g., a red close on a sweep candle formed at the top or a green close at the bottom) are directly considered as signals.
📐 Technical Details:
Signals are triggered only once (triggered control).
Sweep lines (green/red), Long and Short lines (Orange)
Strong candles are filtered using an RSI-momentum-based measurement system (StrongCandle).
Sweep and breakout zones are dynamically invalidated. That is, if the zones are violated by the price, the signals and lines are automatically canceled.
🎯 Who Should Use It?
Professional traders working with liquidity zones
Scalp and intraday strategy practitioners
Those focused on stop hunts, sweeps, and reversal zones
🔔 Alert Support:
Sweep High / Low Alert
Long / Short Signal Alert
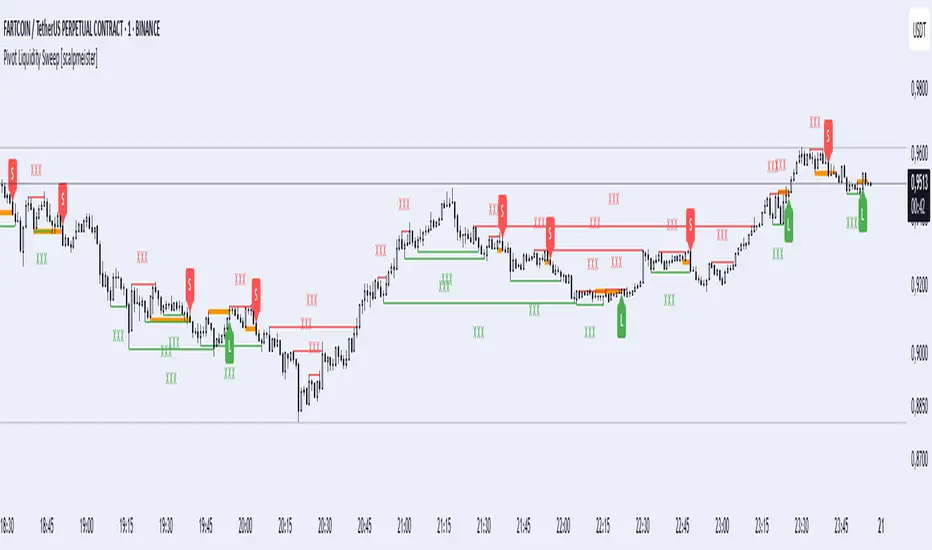
Bear Market Defender [QuantraSystems]Bear Market Defender
A system to short Altcoins when BTC is ranging or falling - benefit from Altcoin bleed or collapse .
QuantraSystems guarantees that the information created and published within this document and on the TradingView platform is fully compliant with applicable regulations, does not constitute investment advice, and is not exclusively intended for qualified investors.
Important Note!
The system equity curve presented here has been generated as part of the process of testing and verifying the methodology behind this script.
Crucially, it was developed after the system was conceptualized, designed, and created, which helps to mitigate the risk of overfitting to historical data. In other words, the system was built for robustness, not for simply optimizing past performance.
This ensures that the system is less likely to degrade in performance over time, compared to hyper-optimized systems that are tailored to past data. No tweaks or optimizations were made to this system post-backtest.
Even More Important Note!!
The nature of markets is that they change quickly and unpredictably. Past performance does not guarantee future results - this is a fundamental rule in trading and investing.
While this system is designed with broad, flexible conditions to adapt quickly to a range of market environments, it is essential to understand that no assumptions should be made about future returns based on historical data. Markets are inherently uncertain, and this system - like all trading systems - cannot predict future outcomes.
INTRODUCTION TO THE STAR FRAMEWORK
The STAR Framework – an abbreviation for Strategic Trading with Adaptive Risk - is a bespoke portfolio-level infrastructure for dynamic, multi-asset crypto trading systems. It combines systematic position management, adaptive sizing, and “intra-system” diversification, all built on a rigorous foundation of Risk-based position sizing .
At its core, STAR is designed to facilitate:
Adaptive position sizing based on user-defined maximum portfolio risk
Capital allocation across multiple assets with dynamic weight adjustment
Execution-aware trading with robust fee and slippage adjustment
Realistic equity curve logic based on a compounding realized PnL and additive unrealized PnL
The STAR Framework is intended for use as both a standalone portfolio system or preferred as a modular component within a broader trading “global portfolio” - delivering a balance of robustness and scalability across strategy types, timeframes, and market regimes.
RISK ALLOCATION VIA "R" CALCULATIONS
The foundational concept behind STAR is the use of the R unit - a dynamic representation of risk per trade. R is defined by the distance between a trade's entry and its stoploss, making it an intuitive and universally adaptive sizing unit across any token, timeframe, or market.
Example: Suppose the entry price is $100, and the stoploss is $95. A $5 move against the position represents a 1R loss. A 15% price increase to $115 would equal a +3R gain.
This makes R-based systems highly flexible: the user defines the percentage of capital that is put at risk per R and all positions are scaled accordingly - whether the token is volatile, illiquid, or slow-moving.
R is an advantageous method for determine position sizing - instead of being tied to complex value at risk mechanisms with having layered exit criteria, or continuous volatility-based sizing criteria that need to be adjusted while in an open trade, R allows for very straightforward sizing, invalidation and especially risk control – which is the most fundamental.
REALIZED BALANCE, FEES & SLIPPAGE ACCOUNTING
All position sizing, risk metrics, and the base equity curve within STAR are calculated based on realized balance only .
This means:
No sizing adjustments are made based on unrealized profit and loss ✅
No active positions are included in the system's realized equity until fully closed ✅
Every trade is sized precisely according to current locked-in realized portfolio balance ✅
This creates the safest risk profile - especially when multiple trades are open. Unrealized gains are not used to inflate sizing, ensuring margin safety across all assets.
All calculations also incorporate slippage and fees, based on user-defined estimates – which can and should be based upon user-collected data - and updated frequently forwards in time. These are not cosmetic, or simply applied to the final equity curve - they are fully integrated into the dynamic position sizing and equity performance , ensuring:
Stoploss hits result in exactly a −1R loss, even after slippage and fees ✅
Winners are discounted based on realistic execution costs ✅
No trade is oversized due to unaccounted execution costs ✅
Example - Slippage in R Units:
Let R be defined as the distance from entry to stoploss.
Suppose that distance is $1, and the trade is closed at a win of +$2.
If execution slippage leads to a 50 cent worse entry and a 50 cent worse exit, you’ve lost $1 extra - which is an additional 1R in execution slippage. This makes the effective return 1.0R instead of the intended 2.0R.
This is equivalent to a slippage value of 50%.
Thus, slippage in STAR is tracked and modelled on an R-adjusted basis , enabling more accurate long-term performance modelling.
MULTI-ASSET, LONG/SHORT SUPPORT
STAR supports concurrent long and short positions across multiple tokens. This can sometimes result in partially hedged exposure - for example, being long one asset and short another.
This structure has key benefits:
Diversifies idiosyncratic risk by distributing exposure across multiple tokens
Allows simultaneous exploitation of relative strength and weakness
Reduces portfolio volatility via natural hedging during reduced trending periods
Even in a highly correlated market like crypto, short-term momentum behaviour often varies between tokens - making diversified, multi-directional exposure a strategic advantage .
EQUITY CURVE
The STAR framework only updates the underlying realized equity when a position is closed, and the trade outcome is known. This approach ensures:
True representation of actual capital available for trading
No exposure distortion due to unrealized gains
Risk remains tightly linked to realized results
This trade-to-trade basis for realized equity modelling eliminates the common pitfall of overallocation based on unrealized profits.
The visual equity curve represents an accurate visualization of the Total Equity however, which is equivalent to what would be the realized equity if all trades were closed on the prior bar close.
TIMEFRAME CONSIDERATIONS
Lower timeframes typically yield better performance for STAR due to:
Greater data density per day - more observations = better statistical inference
Faster compounding - more trades per week = faster capital rotation
However, lower timeframes also suffer from increased slippage and fees. STAR's execution-aware structure helps mitigate this, but users must still choose timeframes appropriate to their liquidity, costs, and operational availability.
INPUT OPTIONS
Fees (direct trading costs - the percentage of capital removed from the initial position size)
Slippage (execution delay, as a percentage. In practice, the fill price is often worse than the signal price. This directly affects R and hence position sizing)
Risk % ( Please note : this is the risk level if every position is opened at once. 5% risk for 5 assets is 1% risk per position)
System Start date
Float Precision value of displayed numbers
Table visualization - positioning and table sizes
Adjustable color options
VISUAL SIMPLICITY
To avoid usual unnecessary complexity and empower fast at-a-glance action taking, as well as enable mobile compatibility, only the most relevant information is presented.
This includes all information required to open positions in one table.
As well as a quick and straightforward overview for the system stats
Lastly, there is an optional table that can be enabled
displaying more detailed information if desired:
USAGE GUIDELINES
To use STAR effectively:
Input your average slippage and fees %
Input your maximum portfolio risk % (this controls overall leverage and is equivalent to the maximum loss that the allocation to STAR would bring if ALL positions are allocated AND hit their stop loss at the same time)
Wait for signal alerts with entry, stop, and size details
STAR will dynamically calculate sizing, risk exposure, and portfolio allocation on your behalf. Position multipliers, stop placement, and asset-specific risk are all embedded in the system logic.
Note: Leverage must be manually set to ISOLATED on your exchange platform to prevent unwanted position linking.
ABOUT THE BEAR MARKET DEFENDER STRATEGY
The first strategy to launch on the STAR Framework is the BEAR MARKET DEFENDER (BMD) - a fast-acting, trend following system based upon the Trend Titan NEUTRONSTAR. For the details of the logic behind NEUTRONSTAR, please refer to the methodology and trend aggregation section of the following indicator:
The BMD ’s short side exit calculation methodology is slightly improved compared to NEUTRONSTAR, to capture downtrends more consistently and also cut positions faster – which is crucial when considering general jump risk in the Crypto space.
Accordingly, the only focus of the BMD is to capture trends to the short side, providing the benefit of being in a spectrum from no correlation to being negatively correlated in risk and return behavior to classical Crypto long exposure.
More precisely, Crypto behavior showcases that when Bitcoin is in a ranging/mean reverting environment, most tokens that don’t fall into the “Blue-Chip” category tend to find themselves in a trend towards 0.
Typically during this period most Crypto portfolios suffer heavily due to a “Crypto-long” biased exposure.
The Bear Market Defender thrives in these chaotic, high volatility markets where most coins trend towards zero while the traditional Crypto long exposure is either flat or in a drawdown, therefore the BMD adds a source of uncorrelated risk and returns to hedge typical long exposure and bolster portfolio volatility.
Because of the BMD's short-only exposure, it will often suffer small losses during strong uptrends. During these periods, long exposure performs the best and the goal is to outperform the temporary underperformance in the BMD .
To take advantage of the abovementioned behavior of most tokens trending to zero, assets traded in the BMD are systematically updated on a quarterly basis with available liquidity being an important consideration for the tokens to be eligible for selection.
FINAL SUMMARY
The STAR Framework represents a new generation of portfolio grade trading infrastructure, built around disciplined execution, realized equity, and adaptive position sizing. It is designed to support any number of future methodologies - beginning with BMD .
The Bear Market Defender is here to hedge out commonly long biased portfolio allocations in the Crypto market, specializing in bringing uncorrelated returns during periods of sideways price action on Bitcoin, or whole-market downturns.
Together, STAR + BMD deliver a scalable, volatility tuned system that prioritizes capital preservation, signal accuracy, and adaptive risk allocation. Whether deployed standalone or within a broader portfolio, this framework is engineered for high performance, longevity, and adaptability in the ever-evolving crypto landscape.

Rolling Z-Score Trend [QuantAlgo]🟢 Overview
The Rolling Z-Score Trend measures how far the current price deviates from its rolling mean in terms of standard deviations. It transforms price data into standardized scores to identify overbought and oversold conditions while tracking momentum shifts.
The indicator displays a Z-Score line showing price deviation from statistical norms, with background momentum columns showing the rate of change in these deviations. This helps traders and investors identify mean reversion opportunities and momentum shifts across different asset classes and timeframes.
🟢 How It Works
The indicator uses the Z-Score formula: Z = (X - μ) / σ, where X is the current closing price, μ is the rolling mean, and σ is the rolling standard deviation over a user-defined lookback period. This creates a dynamic baseline that adapts to changing market conditions and standardizes price movements for interpretation across different assets and volatility conditions. The raw Z-Score undergoes 3-period EMA smoothing to reduce noise while maintaining responsiveness to market signals.
Beyond the basic Z-Score calculation, the indicator measures the rate of change in Z-Score values between successive bars, displayed as background momentum columns. This momentum component shows acceleration and deceleration of statistical deviations. All calculations are processed through confirmation filters, displaying signals only on confirmed bars to reduce premature signals based on incomplete price action.
🟢 How to Use
1. Z-Score Interpretation and Threshold Zones
Positive Values (Above Zero) : Price trading above statistical mean, suggesting bullish momentum or potential overbought conditions
Negative Values (Below Zero) : Price trading below statistical mean, suggesting bearish momentum or potential oversold conditions
Zero Line Crosses : Signal transitions between statistical regimes and potential trend changes
Upper Threshold Zone : Area above entry threshold (default 1.5) indicating potential overbought conditions
Lower Threshold Zone : Area below negative entry threshold (default -1.5) indicating potential oversold conditions
Extreme Values (±2.0 or higher) : Statistically significant deviations that may indicate reversal opportunities
2. Momentum Background Analysis and Info Table
Green Columns : Accelerating positive momentum in Z-Score values
Red Columns : Accelerating negative momentum in Z-Score values
Column Height : Magnitude of momentum change between bars
Momentum Divergence : When columns contradict primary Z-Score direction, often signals impending reversals
Info Table : Displays real-time numerical values for both Z-Score and momentum, including trend direction indicators and bar-to-bar change calculations for position management
3. Preconfigured Settings
Default : Balanced performance across multiple timeframes and asset classes for general trading and medium-term position management.
Scalping : Responsive setup for ultra-short-term trading on 1-15 minute charts with frequent signals and increased sensitivity to quick price movements.
Swing Trading : Optimized for multi-day positions with noise filtering, focusing on larger price swings. Most effective on 1-4 hour and daily timeframes.
Trend Following : Maximum smoothing that prioritizes established trends over short-term volatility. Generates fewer signals for daily and weekly charts.
