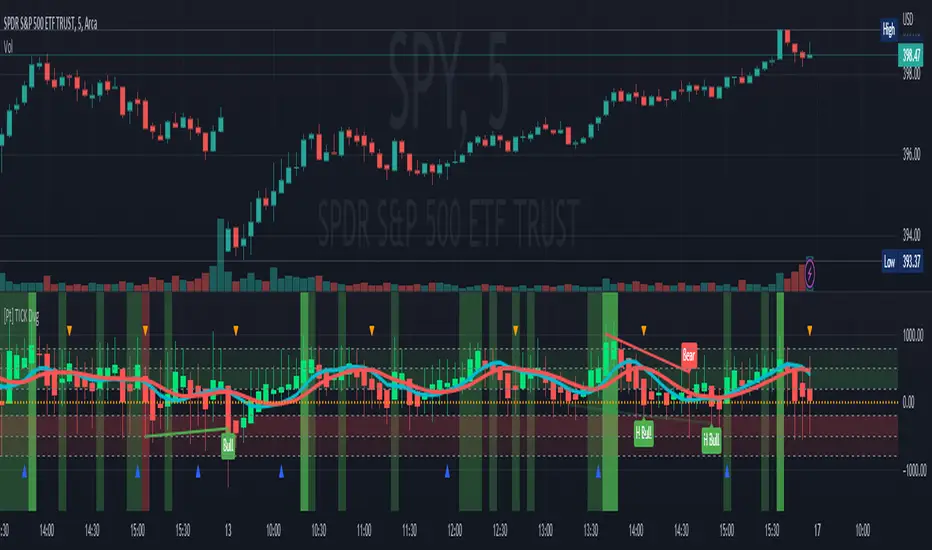
TICK Divergence + Heikin Ashi [Pt]This indicator identifies divergence between NYSE TICK and price, displays TICK in line, bar, or Heikin Ashi format, calculates various types of moving average lines and shows moving average crossovers.
What is TICK
NYSE TICK, also known as the TICK index, is a technical analysis indicator that shows the number of stocks on the New York Stock Exchange (NYSE) that are trading on an uptick or a downtick in a particular period of time. The TICK index is calculated by subtracting the number of stocks trading on a downtick from the number of stocks trading on an uptick. A reading of +1000 on the TICK index, for example, would indicate that there are 1000 more stocks trading on an uptick than on a downtick. The TICK index is often used as a measure of market sentiment, as it can provide insight into whether there is more buying or selling pressure in the market at a given time. A high TICK index reading may suggest that there is strong buying pressure, while a low TICK index reading may indicate that there is more selling pressure in the market.
The TICK index is usually very volatile, so this indicator is best suited for lower timeframes, such as 1 to 5 min charts.
Features
1) Shows bullish, bearish, hidden bullish and hidden bearish divergences
2) Three display modes for TICK data: Line, Bar, Heikin-Ashi
3) Plot various moving average lines and crossovers. Overall background
4) Configurable significant zones. Background colors will change based on closing TICK value.
TICK
Tick based chart [DotH]Version 1.0 - 2nd January 2023
Hi All,
This is my first published indicator, although I have written several hundreds for private use.
Description
Tick based chart
I got intrigued while reading about tick based charts on this page (please note this link/website owner is not affiliated with me) , so I decided to see if it would be possible to recreate this type of chart in TradingView, and here's the results.
This is an implementation for displaying a tick based chart in Trading View. There are benefits to using ticks based candles, as each candle represents the same number of "price moves" rather than an unknown number of moves.
Tick based charts are charts with candles that are rendered in the same way as traditional candles. However, instead of rendering a new candle at a specific time period,tick based candles are rendered after a set number of ticks have occured. For example, in a 50 tick chart, each candle that you see represents exactly 50 ticks, i.e. 50 price changes/moves. Having a view of what happens on the tick level, may help some traders evaluate what is happening within very large candles, or even detect a change in trend, volatility or some other metric which otherwise may not be visible using a standard chart.
Please note that this indicator DOES NOT match/synchronize timewise with the main chart in TradingView. You must view it independently. If you need to see what times are represented in the tick chart, you can look at the custom time labels and X-Axis grid lines in it to get an idea what parts of the tick based chart correspond to the main chart.
Limitations/known issues:
Currently the indicator has been restricted to 100 candles. This is for limiting the line and box usage to a max of 300 objects.
On timeframes above 1 minute, the seconds values will always be 0. In order to be able to see seconds values in the chart scale you need to be on a second level chart, which requires a premium TradingView subscription.
Changing the parameters in the settings will cause the chart to empty and start redrawing from its first candle again. This is because the tick chart is being drawn from realtime data, unlike the standard TradingView charts.
TODOs & Bugs:
Add some moving average indicators (SMA, EMA as a minimum)
Add a corresponding tick based volume chart
Create RSI, MACD, BB variations of this indicator
If you have any ideas/suggestions or bug reports, please feel free to let me know, however keep in mind that I do not have too much spare time to add things, so updates are going to be sporadic.
ABOUT CODE REUSE:
The code is free to use/change. However, if you plan to use this code to make a derivative indicator or strategy, it would be nice to know, so let me know if you feel like it!

[Pt] TICK + Heikin Ashi RSI IndicatorThis indicator combines NYSE TICK and RSI to aim to provide a view of NYSE market trend strength.
What is TICK
NYSE TICK, also known as the TICK index, is a technical analysis indicator that shows the number of stocks on the New York Stock Exchange (NYSE) that are trading on an uptick or a downtick in a particular period of time. The TICK index is calculated by subtracting the number of stocks trading on a downtick from the number of stocks trading on an uptick. A reading of +1000 on the TICK index, for example, would indicate that there are 1000 more stocks trading on an uptick than on a downtick. The TICK index is often used as a measure of market sentiment, as it can provide insight into whether there is more buying or selling pressure in the market at a given time. A high TICK index reading may suggest that there is strong buying pressure, while a low TICK index reading may indicate that there is more selling pressure in the market.
By default, I am using -800 and 800 for oversold and overbought levels. These are configurable. Also, this indicator includes TICK divergence signals.
The TICK index is usually very volatile, so this indicator is best suited for lower timeframes, such as 1 to 5 min charts.
Idea of TICK neutral zone
As part of this indicator I've identified what I consider as "neutral" range for the TICK. Based on my own personal experience, the market tends to be in consolidation or choppy in this range. By default, I've defined this range to be -200 to 200. This range is configurable.
Signals
In combination with RSI and Heikin Ashi RSI (HARSI), which help smooths out the RSI values and make it easier to identify trends and potential reversal points, this indicator aims to generate Bullish vs Bearish signals based on the following conditions:
- bullish / bearish HARSI candle
- Inside bar on HARSI candle
- TICK trend (above or below Neutral zone)
- RSI trend (above or below 0, but not overbought or oversold)
- RSI / HARSI convergence and divergence
When all bullish conditions are met, the signal turns bright green. Bright red when all bearish conditions are met. These generated signals aims to provide users easy to read visual cues to help with their trades.
A table is also provided in attempt to identify the trend in real time:
TICK trend:
- Bullish, Extended
- Bullish
- Neutral w/ Bullish bias
- Neutral w/ Bearish bias
- Bearish
- Bearish, Extended
RSI:
- Bullish
- Bearish
Note on scale
This indicator is based on the scale for TICK, hence the RSI and HARSI are scaled. By default, standard overbought RSI value of 70 = 800 on this scale, whereas oversold value of 30 = -800.
Credits:
Heikin Ashi RSI code was borrowed from @JayRogers - Heikin Ashi RSI Oscillator

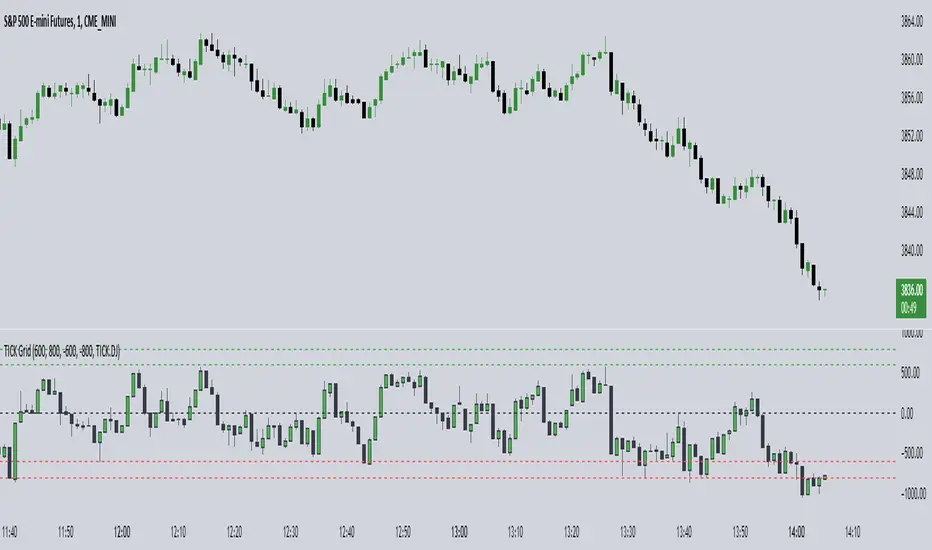
TICK Grid (TheMas7er)█ OVERVIEW
Shows the NYSE Tick Index, as it is used by TheMas7er .
This indicator has several customization options built-in that can be configured:
• Positive and negative threshold levels with show/hide option and color selection.
• Zero line with show/hide option and color selection.
• Bar colors are fully customizable.
• Symbol can be changed. Default is USI:TICK for the New York Stock Exchange.
Tick Indices are available in TradingView as a symbol - just like any other stock - which you can show on a chart.
This script adds a pane with your selected Tick Index, which can then be used as an indicator to make short-term trading decisions.
█ CONCEPTS
The Tick Index is a short-term barometer of internal market strength.
It shows the number of stocks trading on an uptick minus the number of stocks trading on a downtick, and is used by day traders to view the overall market sentiment at a given point in time.
It's categorized as a Breadth Indicator because it analyzes the "Breadth and Scope" of an entire Index.
Since the Tick Index measures the up/down ticks of a universe of stocks, any collection of stocks (market,index,...) could theoretically have it's own Tick Index.
Some of the major Tick Indices are:
• USI:TICK for the New York Stock Exchange
• USI:TICKQ for Nasdaq
• USI:TICKI for the Down Jones
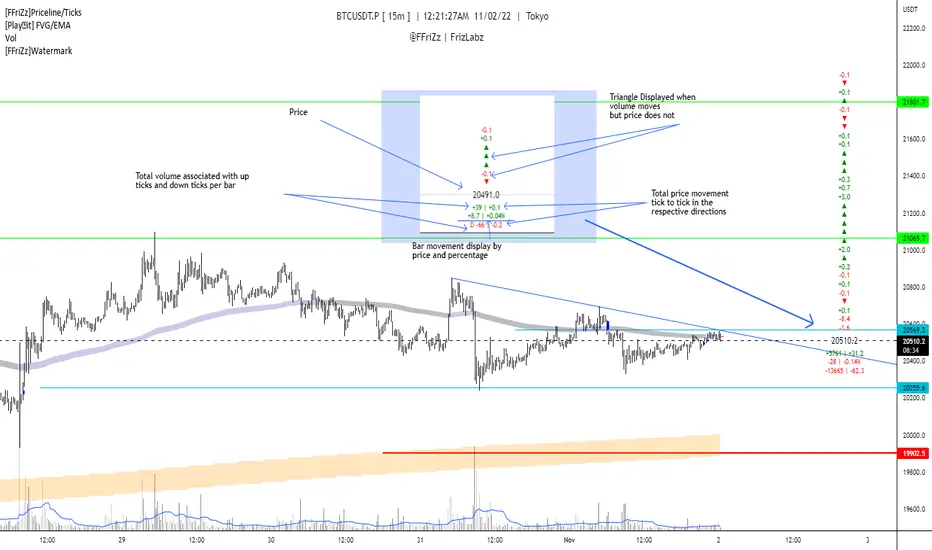
[FFriZz]Priceline/TicksFFriZz | FrizLabz -- Priceline/Ticks
Due to TradingView not allowing us to change the size or style of the Priceline I decided to make this
You can change the style, size, color of the Price line with this Script
There is also an option for the closing price to be plotted on the Priceline
-- Colors --
You can have the Line and/or the Closing price change colors with the price movements
both are adjustable to your preference
-- Ticks --
Will show the difference in price from tick to tick
when Volume moves but price doesn't it will show '▲▼'
-- Adjustments --
The offset of the Close and Ticks can be adjusted from left to right
Can Extend Priceline in all directions
Can change the Line style and Width
Can change all the Text sizes and Colors
Can also Change Colors to change with Price movements
Can Change number of Ticks to show
-- Priceline --
You don't have to but I suggest going to the settings of your Chart and turning off the Priceline
-- Challenge --
There is Some code at the bottom that will move the Label and Ticks to the x% of your screen in from the right once
the last bar is no longer visible. I decided not to use it because even when the feature is turned off any movement of the
chart resets the Ticks. If you find out a way to have it not reset the Ticks Let me know!
If you find any bugs or have any suggestions feel free to DM me or leave a comment!
Hope you Enjoy! -- FFriZz | FrizLabz
TICK Scalping strategy, SPY 1 min1 min chart scalping version of my other TICK strategy with adjusted parameters and additional entry and exit conditions better suited for 1 min SPY chart. Please refer to my original TICK strategy for explanation.
Important notes:
1. This strategy is designed for same day SPY option scalping on the 1 min chart . All profit shown in back testing report is based on Profit/Loss (P/L) estimates from trading options with approximately 6 weeks of data. By default, it is set to 10 option contracts. By default the initial capital is set to $5000. Pyramiding is set to 3.
2. This strategy works better with non-extended market data .
3. This strategy is mainly developed for SPY trading on 1 min chart, it probably will not be very profitable with other tickers or time frame without tweaking all the parameters first.
Cheers and enjoy~! Let's all make money~!!

TICK strategy for SPY optionsImportant notes:
1. This strategy is designed for same day SPY option scalping. All profit shown in back testing report is based on Profit/Loss (P/L) estimates from trading options with approximately 6 months of data. By default, it is set to 10 option contracts. By default the initial capital is set to $5000. Pyramiding is set to 3.
2. This strategy works better with non-extended market data.
3. This strategy is mainly developed for SPY trading on 5 min chart, it probably will not be very profitable with other tickers or time frame without tweaking all the parameters first.
4. This strategy will work with QQQ as well, but please adjust the profit multiplier to match the P/L of QQQ options.
How it works:
When trading the indices, many rely on the TICK for market directions. This strategy is a trend following strategy that uses a combination of conditions using the following indicators:
- TICK
- RSI
- VIX volatility index
- EMA
For entries, the conditions are:
1. TICK moving average crossover with a delayed signal line
2. Bullish or bearish RSI signal, RSI > 50 for bullish, < 50 for bearish
3. VIX must be above a certain threshold to take advantage of high market volatility
4. Price must be on top of EMA line for long, and below for short
For exits, there are 3 scenarios:
1. Stop loss set by a percentage of the daily ATR value
2. Trend changes on the TICK and the RSI
3. Bearish or bullish divergence on price with TICK
This strategy automatically signal to close all trades at 3:50 pm EST at the end of the day.
Extras:
- There is an option to show P/L for reinvesting profits
Enjoy~!!! Let's all make $$$

Moving Average Suite + VWAP + TICKThis indicator combines some of the commonly used moving averages, VWAP, and TICK sentiment, all of which are useful for all types of trading
By default, this indicator includes:
- 21/50/100/200 period smoothed simple moving average
- great for determining trends
- also act as support / resistance line for price
- 9 period exponential moving average
- fast trend / direction indicator
- Volume Weighted Average Price
- no explanation required
- $TICK sentiment as background fill
- overall market sentiment and direction
- +/- 500 levels are colored green/red and are usually indication of institutional order flow --> critical for trading indexes such as SPY or QQQ
- deep green/red background indicates +/-1000 on the $TICK, which are usually associated with overbought or oversold

Time and SalesThis scrip mimics time and sales window displaying tick by tick data coming from the exchange.
It only works when the market is open. And it does not store historical data.
Red color when the last price was higher than the new price.
Gray when both were same.
Green when new price is higher than last price.
Please note that I have tested this in India NSE Market Only. If you find anything buggy let me know in the comments, I will try to update it.

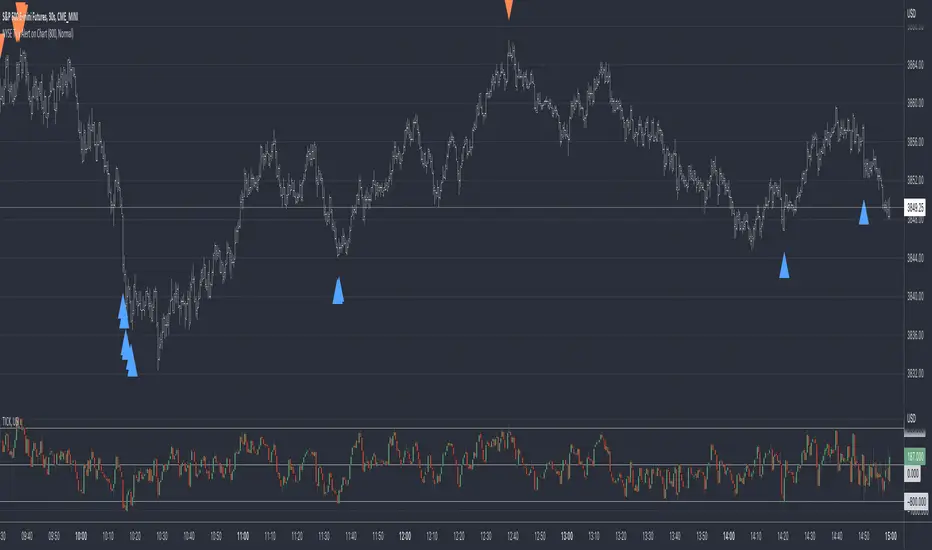
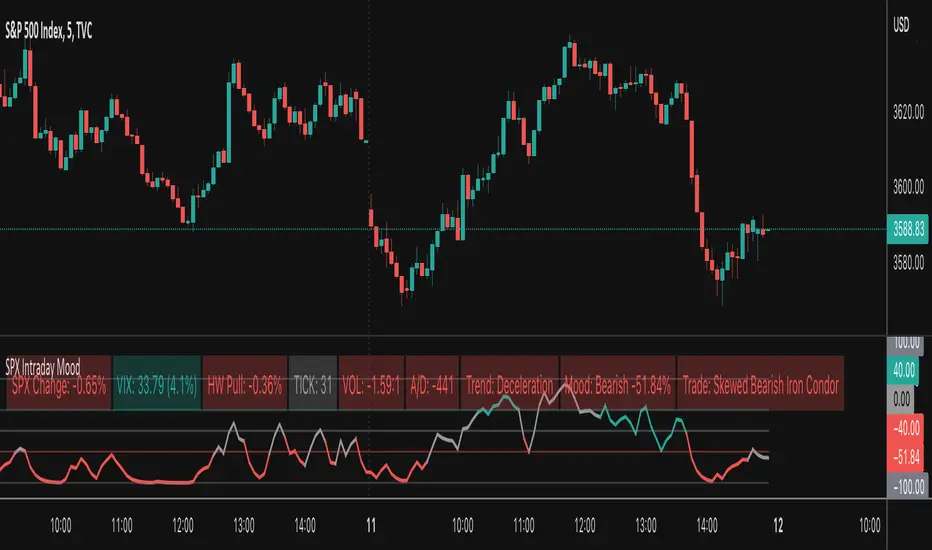
SPX Intraday Mood IndicatorThe SPX Intraday Mood Indicator tries to gauge the intraday market direction of the S&P 500 (SPX) by focusing on internal market data.
Based on the 0DTE Mood Indicator concept. Overall strength/weakness is converted into a directional Mood Percentage which can help with choosing a trade type.
Use at your own risk and discretion. Potential trade ideas offer no guarantees. Intraday Charts Only. Turn off extended hours data. Only works on SPX.
This first version is untested and I am only sharing it to gather feedback on its accuracy, use at your own risk.
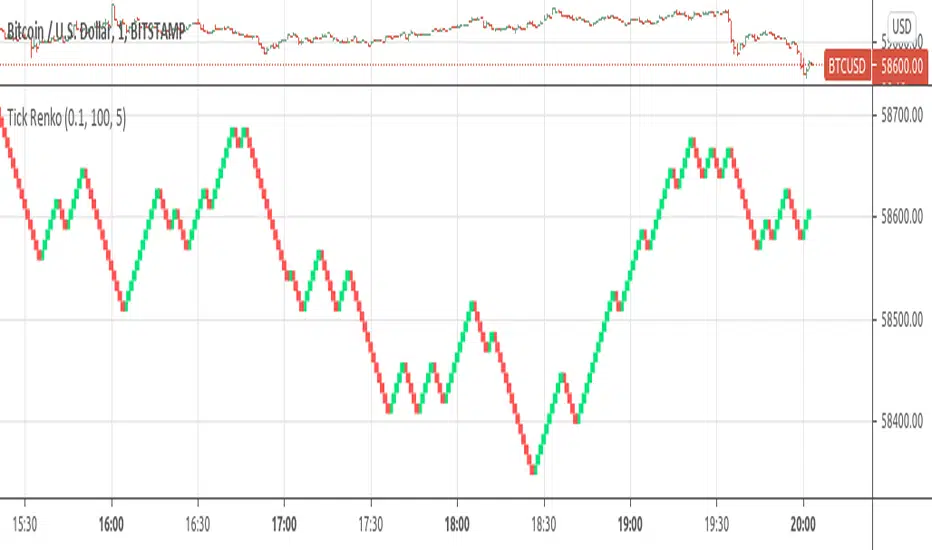
Tick Renko Chart - Percent BasedA Renko Tick chart based on continuously adjusting percentage.
Live Renko bricks formed by tick data
Adjustable brick width
Outline mode, or line mode for more bricks
Scalp with a Renko, get weird.
The settings can and will break the script if you turn them up too high. Turning off outline mode will not look as nice, but can potentially allow for a larger number of bricks.

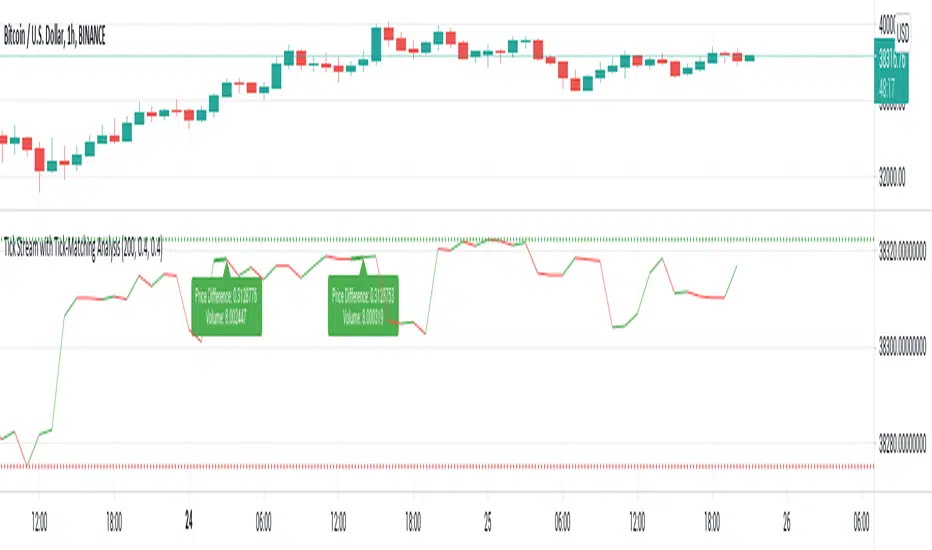
Tick Stream with Tick-Matching AnalysisThis is a simple live tick-chart with optional tick-matching.
Stream Live ticks
Set Matching conditions (price difference, volume or both)
Tick lines will increase in width when there's a match.
Optionally plot labels with volume and price change information.
Well-documented source code for pine nuts.
Tick Data DetailedHello All,
After Tick Chart and Tick Chart RSI scripts, this is Tick Data Detailed script. Like other tick scrips this one only works on real-time bars too. it creates two tables: the table at the right shows the detailed data for Current Bar and the table at the left shows the detailed data for all calculated bars (cumulative). the script checks the volume on each tick and add the tick and volume to the specified level (you can set/change levels)
The volume is multiplied by close price to calculate real volume .There are 7 levels/zones and the default levels are:
0 - 10.000
10.000 - 20.000
20.000 - 50.000
50.000 - 100.000
100.000 - 200.000
200.000 - 400.000
> 400.000
With this info, you will get number of ticks and total volumes on each levels. The idea to separate this levels is in order to know which type of traders trade at that moment. for example volume of whale moves are probably greater than 400.000 or at least 100.000. Or volume of small traders is less than 10.000 or between 20.000-50.000.
You will get info if there is anomaly on each candle as well. what is anomaly definition? Current candle is green but Sell volume is greater than Buy volume or current candle is red but Buy volume is greater than Sell volume . it is shown as (!). you should think/search why/how this anomaly occurs. You can see screenshot about it below.
also "TOTAL" text color changes automatically. if Buy volume is greater than Sell volume then its color becomes Green, if Sell volume is greater than Buy volume then its color becomes Red (or any color you set)
Optionally you can change background and text colors as shown in the example below.
Explanation:
How anomaly is shown:
You can enable coloring background and set the colors as you wish:
And Thanks to @Duyck for letting me use the special characters from his great script.
Enjoy!

Tick RenkoTick Renko, bars are formed on live chart.
note:there is a issue that creates artifacts while there is not enough history loaded.
Tick ChartHello All,
Tick Chart is created using ticks and each candlestick in Tick Chart shows the price variation of X consecutive ticks ( X : Number of Ticks Per Candle ). for example if you set Number of Ticks Per Candle = 100 then each candlestick is created using 100 ticks. so, Tick Charts are NOT time-based charts (like Renko or Point & Figure Charts). Tick is the price change in minimum time interval defined in the platform. There are several advantages of Tick Charts. You can find many articles about Tick Charts on the net.
Tick Chart only works on realtime bars.
You can set " Number of Ticks Per Candle " and " Number of Candles" using options. You can change color of body, wicks abd volume bars as well.
The script shows current, minimum, maximum and average volumes. it also shows OHLC values on the last candle.
Tick Chart using different number of ticks
Volume info:
Enjoy!

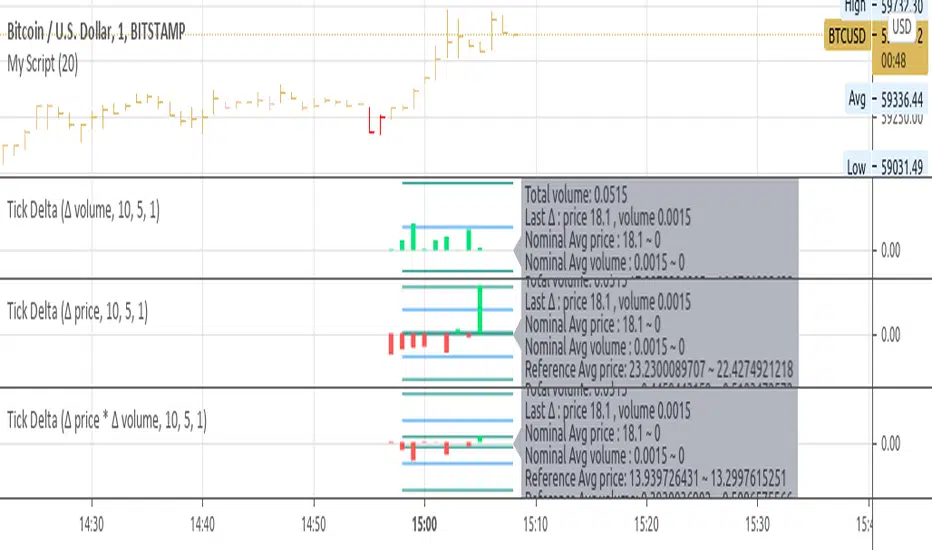
Tick Delta VolumeExperimental:
this script only works on live updating bars(market open and live), the longer it runs the more accurate it will be.
displays:
- total intrabar volume processed(may not be equal to volume).
- last delta tick change in volume.
- this bar delta avg and stdev per tick.
- a overall of all live candles processed avg and stdev of the deltas processed.
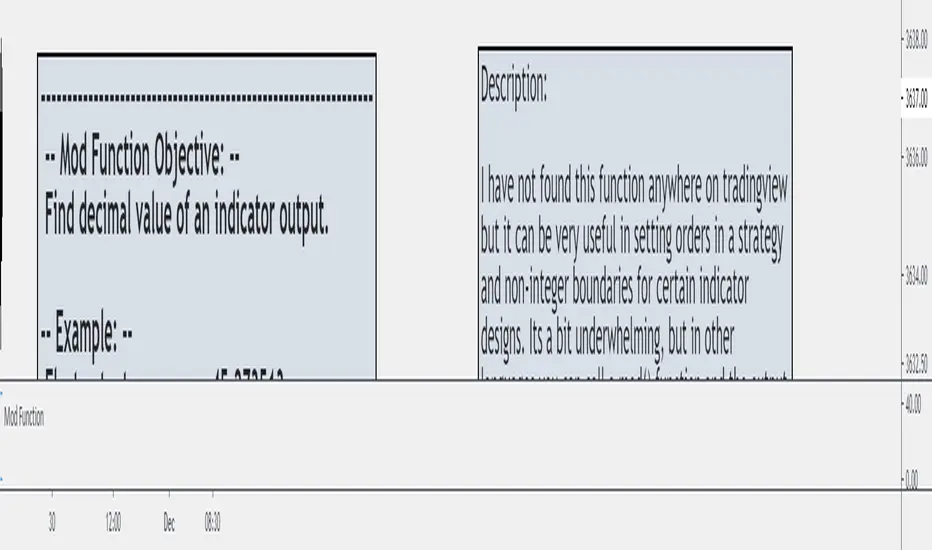
Mod and Round To Tick FunctionI have not found this function anywhere on Tradingview but it can be very useful in setting orders in a strategy and non-integer boundaries for certain indicator designs. Its a bit underwhelming, but in other languages you can call a mod() function and the output will be the remainder of the integer.
If you want to set an order at a specific tick value, particularly in futures, you can't set it at a specific tick when using calculated values like ATR or Standard Deviation without a function like this.
It can also be used to clean up certain band/envelope style indicators if you want to have a straight line, but don't want to simply round to an integer.
Credit for the round to tick aspect goes to the eternal fountain of resources, the Backtesting & Trading Engine script from @pinecoders
This is just another tool to throw in the box for when you might need it.
Cross impro test by Canundo Crossover Crossunder Tick valuesThis is a script where I tried to check the following things:
Even thought the tick of an asset is, for example 0.5, there are calculated prices, like SMA's that have even more decimals. Leading to crosses happening that for example happen at the same price. Consequently triggering totally useless in side markets. What happens if SMA values are restricted to the tick resolution? (Option works on it's own or with a combination of the others.)
What happens if I set my own tick value, like 0.8 instead of 0.5, what will be the effect for calculated values that are used for crossings? Will tick sizes improve the success rate? (This option will work only when the first option is active.)
Can success rate, especially for sideway markets be improved when adding a spread between MA's, so that it triggers less in sideway markets? (Option works on it's own or with a combination of the others.)
First of all, I had a hard time to round prices properly when it needs to be dynamic and working for different assets with different amounts of decimal values in the tick. The solution is that abs(floor(syminfo.mintick)) will give you the amount of decimals a tick has. It works for all ticks that are at least lower than 10. I'm not sure how huge ticks are out there. I did not implement this solution at the end since I found another way to test it.
Findings:
The first option, when activated, takes out half the trades and raises the percent profitability by 8% so there is some effect. However, all of the tested options have less advantage than I hoped for but are nevertheless something worthy for sideway markets. The first option just forces the MA's from the example to use the tick resolution.
See these two images. One when the first option is off, the second when it's active.
The lines are the MA's with adjusted values, the crosses are the places of the MA's when left as is.
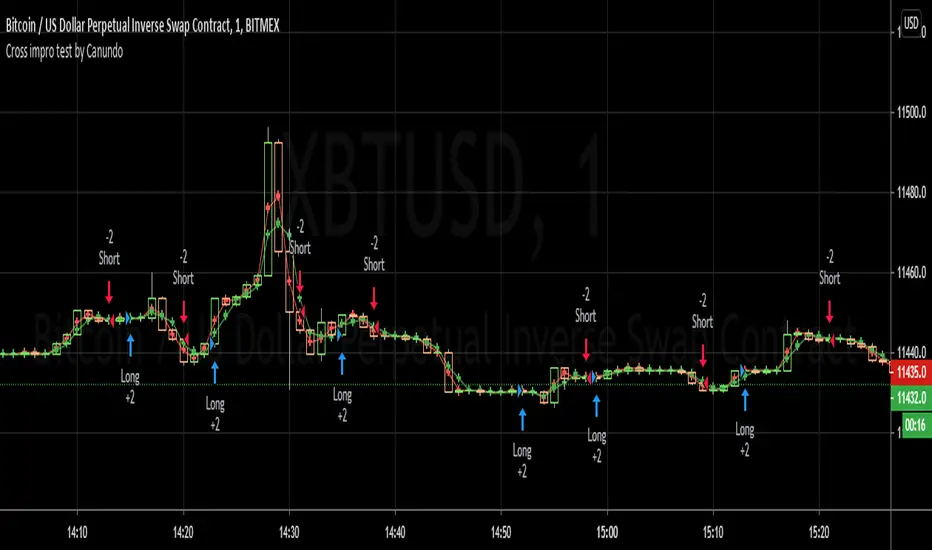
Here a screenshot of the third option set to the value 2 on the 1 minute XBTUSD chart.
The advantage is that less trades trigger that have a low change in price and so less trading fees will happen.
The disadvantage is that all options can implement some delay for a crossing since the crossing will trigger once a slightly bigger move into the direction was taken.
This test environment was not meant to be profitable but to test the effects.
Maybe someone finds it interesting or wanted to test the same, so here you can save some work.
TICK IndicatorThis indicator is meant for primarily day trading. This indicator displays TICK in an easy to follow format and becomes more visible when there is a strong move in either direction
NYSE Volume UP FLOW VS Down FLOW ULTIMATE VOLDNYSE Volume UP FLOW VS Down FLOW ULTIMATE StokedStocks
BASED OFF THE VOLD INDEX
The VOLD (also $VOLD) is the difference between the up volume and down volume on the NYSE. i.e. NYSE $UVOL minus $DVOL; the net up volume.
If you consider that VOLD is the net value between UVOL (up volume) and DVOL (down volume) then you need to understand these two to understand VOLD.
UVOL or DVOL are a total of the volume on all stocks that are up or down in price. Up or down is based on the previous session's closing price. The size of the stock's price change is irrelevant.
If the stock is up only $.01, then its volume is grouped into the UVOL total. If that stock's price then drops by $.02 it will be down $.01 and the day's volume for that stock will now be grouped with the DVOL total.
Note that when a stock moves from being an up stock to a down stock its volume will be removed from the UVOL total and added to the DVOL total. Say the stocks volume is 1 million shares when it moves from up to down. The DVOL will increase by 1 million and the UVOL will decrease by 1 million which means that VOLD will decrease by 2 million.
NYSE Up/Down Volume Ratio is often used as a barometer for stocks trading on all U.S. Exchanges even though it is calculated based on stocks listed on the New York Stock Exchange.
NYSE Up/Down ratio represents the volume of NYSE stocks that are advancing divided by the volume of declining stocks.
The volume of advancing stocks or upside volume is the sum of the volume or the number of shares traded associated with stocks that closed higher.
The downside volume is the total number of shares traded that are associated with stocks that closed lower.
The interpretation of the NYSE Up/Down ratio is rather simple. A value higher than one indicates that there is more volume associated with up stocks than with down stocks and it is usually interpreted as a bullish signal.
Obviously, a bearish signal occurs when the NYSE Up/Down ratio is lower than one, which tells us that there are more volume associated with down stocks than with up stocks.
Check out my other indicators and website stokedstocks.wordpress.com for tons of free stock training books and pictures and settings

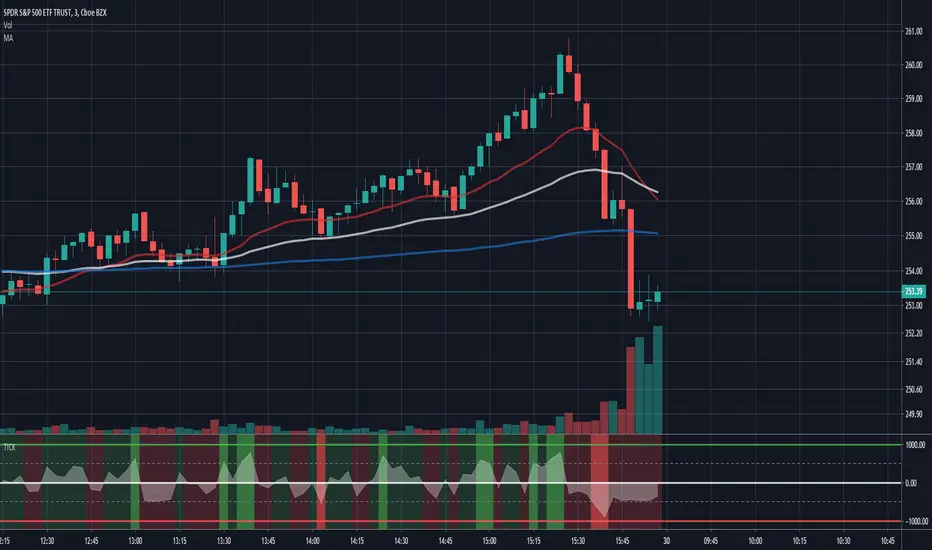
Market Internals [Makit0] MARKET INTERNALS INDICATOR v0.5beta
Market Internals are suitable for day trade equity indices, named SPY or /ES, please do your own research about what they are and how to use them
This scripts plots the NYSE market internals charts as an indicator for an easy and full visualization of market internal structure all in one chart, useful for SPY and /ES trading
Description of the Market Internals
- TICK: NYSE stocks ticking up vs stocks ticking down, extreme values may point to trend continuation on trending days or reversal in non trending days, example of extreme values can be 800 and 1000
- ADD: NYSE stocks going up vs stocks going down, if price auctions around the zero line may be a non trend day, otherwise may be a trend day
- VOLD: NYSE volume of stocks up vs volume of stocks going down, identify clearly where the volume is going, as example if volume is flowing down may be a good idea no to place longs
- TRIN: NYSE up stocks vs down stocks ratio divided by up volume vs down volume ratio. A value of 1 indicates parity, below that the strength is on the long side, above the strength is in the short side.
A basic use of market internals may be looking for divergences, for example:
- /ES is trading in a range but ADD and VOLD are trending up nonstop, may /ES will break the range to the upside
- /ES is trading in a range and ADD and VOLD are trading around the zero line but got an extreme reading on TICK, may be a non trending day and the TICK extreme reading is at one of the extremes of the /ES range, may be a good probability trade to fade that move
- /ES is trading in a trend to the downside, ADD and VOLD too, you catch a good portion of the move but are fearful to flat and miss more gains, you see in the TICK a lot of extreme values below -800 so your're confident in the continuation of the downtrend, until the TICK goes beyond -1000 and you use that signal to go flat
Market internals give you context and confirmation, price in /ES may be trending but if market internals do not confirm the move may a reversal is on its way
Price is an advertise, you can see the real move in the structure below, in the behavior of the individual components of the market, those are the real questions:
- How many stocks are going up/down (ADD)
- How many volume is flowing up/down (VOLD)
- How many stocks are ticking up/down (TICK)
- What is the overall volume breath of the market (TRIN)
FEATURES:
- Plot one of the four basic market internal indices: TICK, ADD, VOLD and TRIN
- Show labels with values beyond an user defined threshold
- Show ZERO line
- Show user defined Dotted and Dashed lines
- Show user defined moving average
SETTINGS:
- Market internal: ticker to plot in the indicator, four options to choose from (TICK, ADD, VOLD and TRIN)
- Labels threshold: all values beyond this will be ploted as labels
- Dot lines at: two dotted lines will be plotted at this value above and below the zero line
- Dash lines at: two dashed lines will be plotted at this value above and below the zero line
- MA type: two options avaiable SMA (Simple Moving Average) or EMA (Exponential Moving Average)
- MA length: number of bars to calculate the moving average
- Show zero line: show or hide zero line
- Show dot line: show or hide dotted lines
- Show dash line: show or hide dashed lines
- Show labels: show or hide labels
GOOD LUCK AND HAPPY TRADING

TICK Extremes IndicatorSimple TICK indicator, plots candles and HL2 line
Conditional green/red coloring for highs above 500, 900 and lows above 0, and for lows below -500, -900, and highs above 0
Probably best used for 1 - 5 min timeframes
Always open to suggestions if criteria needs tweaking or if something else would make it more useful or user-friendly!
