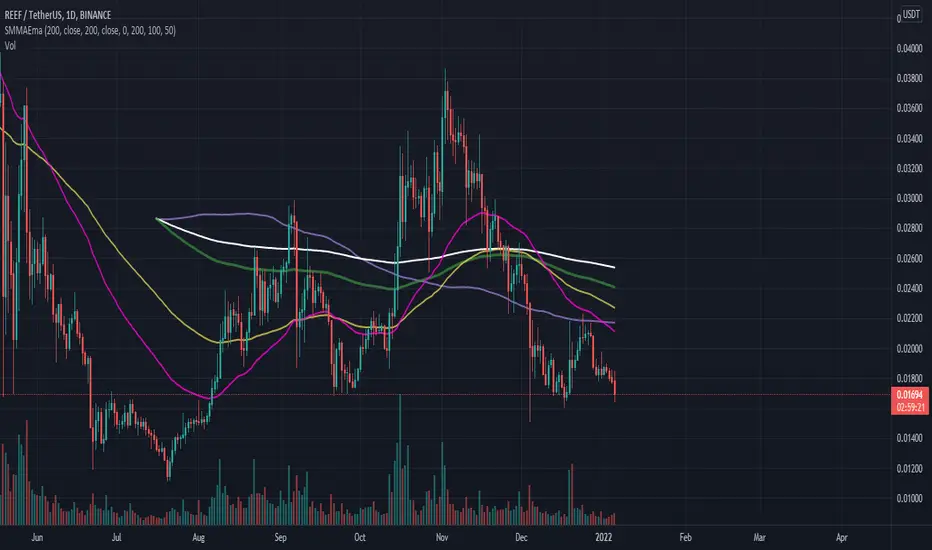
Smamaema1 SMA, 3 EMA, 1 MA. The SMA in white is an amazing support/resistence level on 4h charts with a long history, the three EMA are good indicators of buy/sell zones and and the MA is the same as EMA but with lag. Indicador Pine Script®por alintheter1112
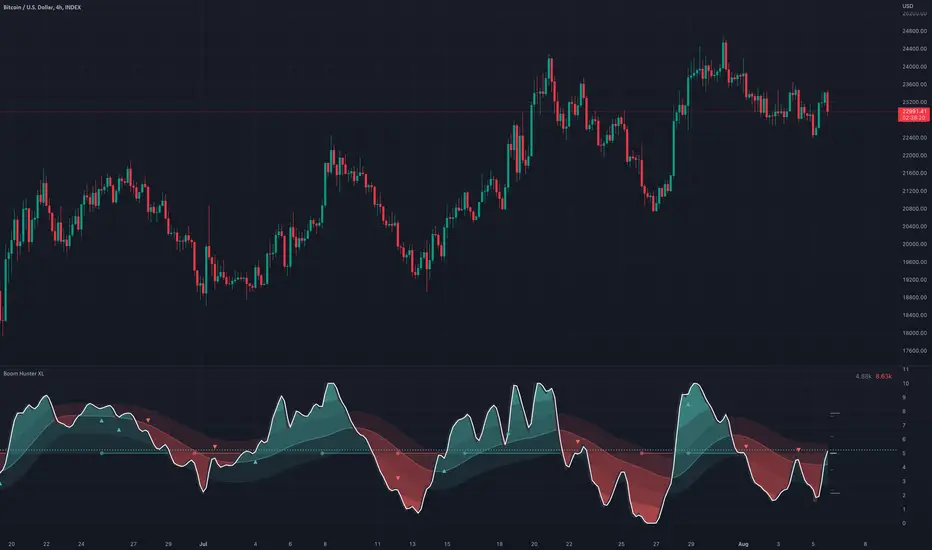
Boom Hunter XLBoom Hunter XL is a professional trading tool designed to expose perfect entries and incredible exits. This complete ground up rebuild of Boom Hunter Pro is an absolute essential for any professional trader or anyone serious about trading. Boom Hunter XL includes many upgrades to the Pro version such as volume pressure analysis, improved pressure dots, two new support and resistance lines and volume breakout detection. It also has options to display current volume and average volume it the top right corner. A new and improved Volume Pressure Analysis exclusive to Boom Hunter XL can be turned on or off in the settings. This provides relative volume information highlighting anomalies and key movements. It also shows volume pressure. Sometimes when crossing a support or resistance line it takes a lot of volume to move price just a little. When price action crosses or bounces off a SR line it requires very little volume to move the price a lot. What this means is traders can visually see price action getting pulled in or pushed away from a SR line. The current bar shows live directional pressure. Volume pressure is used to confirm entries and continuations. Red wave is the main support resistance line dictating short term trend direction. Enter trades after the oscillator crosses through or even better with pressure dots or volume pressure. If the oscillator is above the red wave it is an up trend and if it is below its a down trend. The gray wave shows medium term support/resistance and general trend. This line is much harder to cross. Price action can easily bounce within this wave or get rejected. The strongest SR lines are the top and bottom gray lines. The resistance line will bottom out under pressure and expose a low point. Likewise the support line will roof and expose a high point. When there is extreme pressure the gray line will drag. This signal suggests that price action will will pullback and retest and push again. Avoid entering trades in these moments as the true bottom/top has not been exposed. Following price action along longer timeframe charts will help find the true low/high. Tracking traditional patterns makes it easy to find the next breakout and direction. Bear patterns Bull patterns Volume breakouts Drawing support and resistance lines Example of some of the signals: Indicador Pine Script®por veryfidAtualizado 136136 1.2 K
Universal logarithmic growth curves, with support and resistanceLogarithmic regression is used to model data where growth or decay accelerates rapidly at first and then slows over time. This model is for the long term series data (such as 10 years time span). The user can consider entering the market when the price below 25% or 5% confidence and consider take profit when the price goes above 75% or 95% confidence line. This script is: - Designed to be usable in all tickers. (not only for bitcoin now!) - Logarithmic regression and shows support-resistance level - Shape of lines are all linear adjustable - Height difference of levels and zones are customizable - Support and resistance levels are highlighted Input panel: - Steps of drawing: Won't change it unless there are display problems. - Resistance, support, other level color: self-explanatory. - Stdev multipliers: A constant variable to adjust regression boundaries. - Fib level N: Base on the relative position of top line and base line. If you don't want all fib levels, you might set all fib levels = 0.5. - Linear lift up: vertically lift up the whole set of lines. By linear multiplication. - Curvature constant: It is the base value of the exponential transform before converting it back to the chart and plotting it. A bigger base value will make a more upward curvy line. FAQ: Q: How to use it? A: Click "Fx" in your chart then search this script to get it into your chart. Then right click the price axis, then select "Logarithmic" scale to show the curves probably. Q: Why release this script? A: - This script is intended to to fix the current issues of bitcoins growth curve script, and to provide a better version of the logarithmic curve, which is not only for bitcoin , but for all kinds of tickers. - In the public library there is a hardcoded logarithmic growth curve by @quantadelic . But unfortunately that curve was hardcoded by his manual inputs, which makes the curve stop updating its value since 2019 the date he publish that code. Many users of that script love using it but they realize it was stop updating, many users out there based on @quantadelic version of "bitcoin logarithmic growth curves" and they tried their best to update the coordinates with their own hardcode input values. Eventually, a lot of redundant hardcoded "Bitcoin growth curve" scripts was born in the public library. Which is not a good thing. Q: What about looking at the regression result with a log scale price axis? A: You can use this script that I published in a year ago. This script display the result in a log scale price axis. Indicador Pine Script®por BillionaireLauAtualizado 1515 1 K
Support Resistance Zones using confluence & Std. DeviationOverview: This indicator takes (interactive) input from the user for support and resistance levels and plots important zones considering the other confluence levels in the indicator. Working of indicator: This indicator takes six input of Support/resistance level form the user It has following 32 confluence levels a.4 Recent positive Divergence levels (DN1, DN2, DN3, DN4) b.4 recent negative divergence levels (DP1, DP2, DP3, DP4) d.5 Fibonacci levels (Fib0, Fib236, Fib5, Fib618, Fib786) e. 7 Pivot levels (P, PR1, PR2, PR3, PS1, PS2, PS3) f.4 EMAs (E20, E200, E100, E50) g. ATH, ATL, Weekly High, Weekly Low, two days ago high, two days ago low, previous day high , previous day low The code checks nearest ‘n’ CONFLUENCE for each level (“Number of confluences to check”) in the indicator, after getting the nearest confluence it calculates the standard deviation of those levels WITH RESPECT TO THE MANUAL INPUT LEVELS. If the Std. Deviation is less than the input value (“Minimum standard deviation” option) then the zone is displayed on the chart. How to use: Add the indicator on the chart select your important support and resistance levels. Set standard deviation, if the confluence is less than the input standard deviation then you will see those zones on the chart. You can display all divergence levels; you can display all fib levels. All confluences can be displayed by using the setting of the indicator How to read the indicator values: The zone will show all the confluence it has in its zone, Example: Table details: The table shows the maximum and minimum deviation out of all six levels .To see at least one zone you have to make sure that Input value Std. Deviation must be greater than Min Std. Deviation of the table Sources & refences : Big thank to www.pinecoders.com and kodify.net Standard deviation : www.investopedia.com function to find 'k' closest elements : www.techiedelight.com Interactive support resistance : Divergence for many indicators: Auto fib level by DGT: www.tradingview.com Indicador Pine Script®por TJalam1313604
session min/max support&resistance [LM]Hello traders, I would like to present you session min/max support&resistance indicator. The idea behind is to calculate min and max per session and render line at those levels and bars until the price reach the level. With this you can see levels where the price didn't reach with granular control over how many lines can be shown. Indicator has following settings: General control - where you can select session interval and show/hide labels Line control - where you can adjust type of line, color of up/bottom level.. I hope you will enjoy it, Lukas Indicador Pine Script®por lmatlAtualizado 77408
Pivot Support & ResistanceHere signals are based on the pivot high and pivot lows. Factors taken into account in understanding the breakout or breakdown are: volume candle bar is not opening candle must be near pivot high or low Recommendation: Use once candle closes else you might get trapped in certain cases so be carefulIndicador Pine Script®por iitiantradingsageAtualizado 1414 1.5 K
Divina - Support and ResistanceGiven the positive feedback received on the first Dynamic Support/Resistance script, I've decided to rewrite it on Pine Script v5 and publish it with open source code. The main Divina area (box) is derived from change in price and volume, while the other support and resistance levels are based on the golden ratio (Divina proportione) or Fibonacci numbers. The box will start to paint if the previous closed bar satisfy a condition and it will be never be repainted in the future. Anyway the box and the levels will be extended until a new signal is detected. The Divina Support and Resistance will help you to find good price zones on wich the market might take trading decision. It is not a strategy by per se, it should be used with other good trading techniques. Indicador Pine Script®por UnknownUnicorn769475Atualizado 1010324
Auto S/R v2This script allows users to plot automatic support and resistance lines on their chart from any timeframe. This allows them to automatically overlay daily support and resistance lines on an intraday chart. 1. First we get a value from a 5 bar pivot. 2. From that pivot we calculate the ATR. 3. We draw lines above and below by either adding or subtracting from our value in step 1. The user has the option to turn off the price labels, set the number of lines they want displayed, and adjusting the closeness of each line by using the adjuster.Indicador Pine Script®por GM_Trades22239
[MF] CURRENT AND NEXT CPR LEVELSThis is CPR with Monthly, Weekly and Daily time frames of the current and next* CPR levels. * The following lines only become relevant at the end of the cycle. CPR LEVELS: P (pivot point) = (H + L + C) / 3 BC (Bottom Central) = (H + L) / 2 TC (Top Central) = (P - BC) + P Resistance Levels - Green = R1 Levels ( 2×P - L ) - Green = R2 Levels ( P + (H - L) ) - Green = R3 Levels ( H + 2 * (P - L) ) Support Levels - Red = S1 Levels ( 2×P - H ) - Red = S2 Levels ( P - (H - L) ) - Red = S3 Levels ( L - 2 * (H- P) ) Description and Refrences: en.wikipedia.org(technical_analysis) Rules For BUY Setup with CPR 1) Today's Pivot Level Should be higher than Previous Day's Pivot Level 2) The previous day's close should be near day high. Rules For SELL Setup with CPR 1) Today's Pivot Level Should be lower than Previous Day's Pivot Level 2) The previous day's close should be near day low. CPR or central pivot range is the best tool available for the trader to see the price base indicator. You can use this tool i.e CPR (central pivot range) to check the price indicator in the stock market. You know the price of shares sometimes goes up or sometimes goes down in the stock market. So it will be best to stay updated and know it before the time the share market/stock market fall or rises.Indicador Pine Script®por MF_CryptoAtualizado 3333595
Auto Price Action - Multi Time Frame [Mehrok]Auto Price Action - Volume Price and Spread - Multi Time Frame Volume Price and Spread script generates important support and resistance levels basis activity happening in price, volume and candle spread. The basic idea has been taken from concepts of VSA which underlies that weakness appears in uptrend and strength in downtrend. Script will try to find candles which have volume higher then average and candle spread. Underlying logic: Script generates significant high's as resistance and lows as support basis activity happened on volume , price and candle spread. Multi Time Frame gives ability to find strong support and resistance levels on higher time frames and display on lower time frame chart. Usage: As it records and maintain important high and lows happening on candles till the time new levels are generated therefore generated price levels act as significant support or resistance. Higher the activity in volume , price and spread stronger that price level would act as support or resistance in future. Script work on all time frame where volume information is available. In absence of volume information script would only generate optional levels and that too if activated.Indicador Pine Script®por MrGaggiAtualizado 33292
Divergence-Support/ResistenceAnother script based on zigzag, divergence, and to yield support and resistence levels. This idea started with below two concepts: ▶ Support and resistence are simply levels where price has rejected to go further down or up. Usually, we can derive this based on pivots. But, if we start looking at every pivot, there will be many of them and may be confusing to understand which one to consider. ▶ Lot of people asked about one of my previous script on divergence detector on how to use it. I believe divergence should be considered as area of support and resistence because, they only amount to temporary weakness in momentum and nothing more. As per my understanding Trend > Hidden Divergence > Divergence > Oscillator Levels of Overbought and Oversold ⬜ Process ▶ Now combining the above two concepts - what we are trying to do here is draw support resistence lines only on pivots which has observed either divergence or hidden divergence. Continuation and indecision pivots are ignored. ▶ Input requires only few parameters. Zigzag lengths and oscillator to be used. Oscillator periods are automatically calculated based on zigzag length. Hence no other information required. You can also chose custom oscillator via external source. ▶ Display include horizontal lines of support/resistence which are drawn from the candle from where divergence or hidden divergence is detected. ▶ Support resistence lines are colored based on divergence. Green shades for bullish divergence and bullish hidden divergence whereas red shades for bearish divervence and bearish hidden divergence. Please note, red and green lines does not mean they only provide resistence or support. Any lines which are below the price should be treated as support and any line which are above the price should be treated as resistence. ▶ Divergence symbols are also printed on the bar from where divergence/hidden divergence is detected. ↗ - Bullish Hidden Divergence ↘ - Bearish Hidden Divergence ⤴ - Bullish Divergence ⤵ - Bearish Divergence ▶ Script also demonstrates usage of libraries effectively. I have used following libraries in this code. import HeWhoMustNotBeNamed/ zigzag /2 as zg import HeWhoMustNotBeNamed/enhanced_ta/8 as eta import HeWhoMustNotBeNamed/ supertrend /4 as st Can be good combination to use it with harmonic patterns. Indicador Pine Script®por TrendoscopeAtualizado 3939 3.9 K
Levels High LowEnglish: Indicator for quickly identifying support and resistance levels. It is possible to use the parameter of the length of the upper and lower levels. The larger it is, the stronger the levels of the levels. The smaller it is, the less strong the levels are. It is possible to go back and turn off labels and lines. By default, the labels and lines are scale, and the length is 20. Русский: Индикатор предназначен для быстрого определения уровней поддержки и сопротивления. Есть возможность изменять параметр длинны верхних уровней и нижних. Чем он больше, тем более сильные уровни отображаются. Чем он меньше, тем менее сильные уровни отображаются. Есть возможность включать и отключать метки и линии. По умолчанию метки и линии отображаются, а длинна равна 20.Indicador Pine Script®por nikfilippov0555380
[AB] Support/Resistance Drawing ToolThis script is designed to help you identify viable support and resistance levels by automatically creating lines that become less transparent when said levels hold. It is based on Donchian Channels created by rounded closes, not by highs and lows. You can use it as an aid to draw your levels manually, or stick exclusively to automatic charting. Available settings are as follows: Source - highly recommended to use Close, but other options are available if you'd like to do some experimentation. Source Rounding - the accuracy of price sampling; higher rounding will make your lines more visible at the expense of precision. It is highly recommended to use decimals. Length (Array) - the overall lookback of the script (length of the array). This value shouldn't be higher than 500 if skip = 2, or 250 if skip = 1. If you'd like to reach further back into the past, I'd recommend switching timeframes instead of increasing this beyond 500. Sampling Skip - how frequently the data is sampled. I wouldn't recommend going beyond 2, especially with the default settings. Transparency Skip - you can think of it as "pencil hardness". The higher the skip, the bigger the imprint of a single level detection will be. Wouldn't recommend going beyond 10. Color R, G, and B - you can use these settings to adjust the color of the lines.Indicador Pine Script®por akalibot198755100
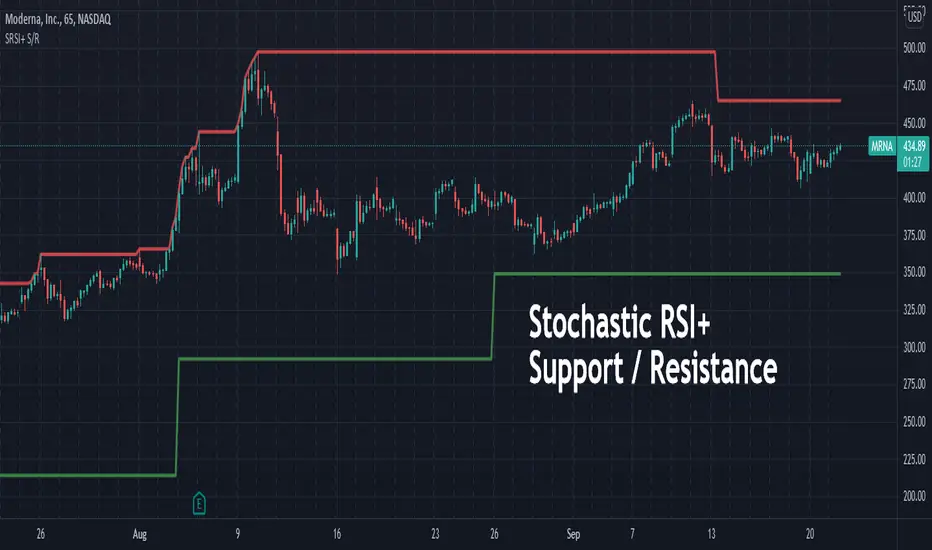
Stochastic RSI+ Support/Resistance (beta)This indicator uses Stochastic RSI+ as a means to determine overbought and oversold conditions which subsequently define recent support and resistance levels.Indicador Pine Script®por ElectrifiedAtualizado 22483
Vision Reversal ZonesVision Reversal Zones is our twist on Fibonacci Retracements to help identify areas of possible retracement. It's important to understand that in real-time the retracement levels of the past are not to be mistaken as retracement levels of the future. The goal is to provide yourself with an idea of general ranges you could potentially expect a retracement based on recent activity. This indicator should not be used as your only source of trade ideas... Build a strategy around your preferred setups, and leverage it for confirmation. What makes this indicator different? Our indicator outputs averaged metrics with retracement ratios Our indicator adjusts it's averaging decisions automatically based on your chart Our indicator focuses on the outer ratios of retracement How do I use this indicator? To use this indicator simply apply it to your chart. With this version there are no user required settings or adjustable values. The indicator will make adjustments itself based on your chart. To understand the use of the indicator you'll need to understand the basic principles of support & resistance. We recommend reading up on Fibonacci Retracements as well, however you'll first want to understand support & resistance. Indicador Pine Script®por VisionTradingAppAtualizado 55236
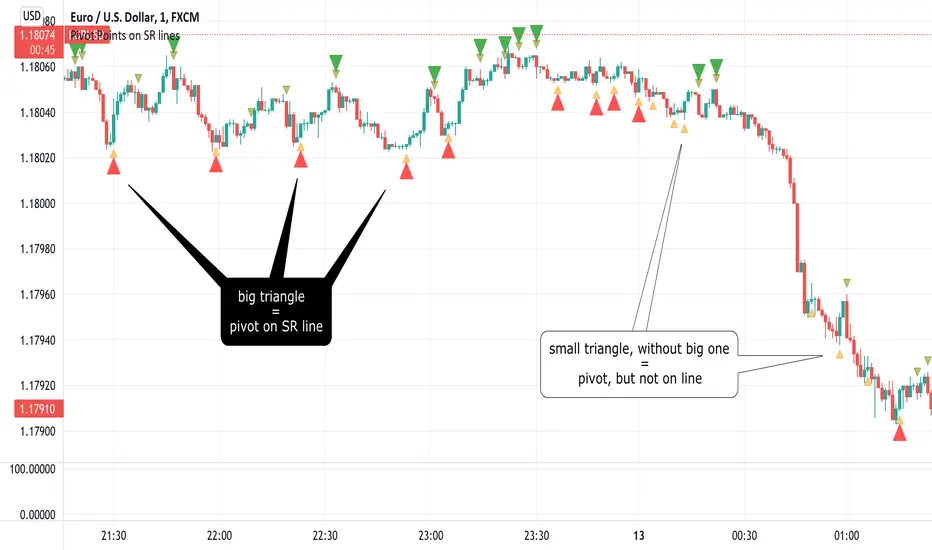
Pivot Points on SR linesAnalyzing price movements for a few years taught me one thing - markets always reverse bouncing off some horizontal Support/Resistance level. The only exception to this rule is when market pops new ATH (All Time High), which certainly happened in so-called "price discovery" run - this asset has never been in this space before, so no Support/Resistance could have been formed, while the rally had to stop at some point anyway. In all other cases, analyzing past market movements, you will be able to find a place where the market reversed or gathered before. The difficulty is to understand (or guess?) from which S/R level market will reverse right now, because there are many of them. Even if this is probably not possible to make such guess correctly and always, it is good to know when potential reversal shown by whatever indicator you're using happened on SR line or in the middle of nowhere. That last case would turn out to be fake to your worst regrets. Ability to filter-out all those fake pivots is a value my indicator delivers. Example? It is very often considered an entry signal when Stochastic %K and %D lines cross each other, especially in overbought/oversold area. It could work quite well in sideways markets, but when a trend begins, Stochastic would report CONSECUTIVE counter-trend signals, draining your trading balance to zero quickly. But this trend took place in price-discovery area (not necessarily when going for the new ATH ), so all those counter-trend signals happened not at S/R levels. Hence, they should be ignored. Big triangles mark pivot point which happened on the S/R line. Small triangles - in the middle of nowhere. How good is it? I compared it with one of my previous scripts, the "PivotPoints with Momentum confirmation" (), this new script confirms only 1/3 of pivots in the old script on 1m EURUSD chart. Filtering out 2/3 of potentially bad entries is a good result, I'd say :) This script also fires alerts - alert is triggered as soon as PivotPoint is noticed, on a candle close. I strongly recommend NOT using it not using this indicator as a standalone indicator. There is so much information you should take into consideration as well - market bias, volume , higher timeframe trend... To make it convenient to join PivotPoints information with other indicators, I have "exported" one plot so you can include it in your own - just use input.source in your own code to have it return 1 for PivotLow ( aka Long entry) and -1 for PivotHigh ( aka Short entry).Indicador Pine Script®por Peter_OAtualizado 1313331
MTF Order Block FinderAn Order Block is a special type of pivot point that satisfies the following requirement: A Bull/Bear candle followed by X consecutive candles in the opposite direction. Order Blocks are interesting areas that are frequently revisited and can be treated as Support/Resistance levels. Often, you can see explosive price rejection of these areas via long wicks, high volume, and rapid price change. Features Choose from two themes: - LIGHT: a classic Red and Green representing Bearish and Bullish OBs, respectively - DARK: a clean Blue and White scheme Choose from two drawing styles: - LINE: three lines representing the High, Low, and Mid price levels of the OB candle - BOX: a bounded area similar to the "rectangle" tool Chose a custom timeframe: - From 1 Minute (useful for Seconds interval) up to 1 Month Note, this setting is experimental and choosing a timeframe that is extraordinarily large may not function properly. Filter order blocks with two settings: - Number of consecutive bars - Minimum % change of the potential OB bar (default 0.25%) Keep your charts clean and show only relevant OBs - Maximum number of Bullish zones to show - Maximum number of Bearish zones to show FAQ Q: How do I trade with this indicator? A:Personally, I use a fast entry indicator to confirm Long/Short position when price is rejected. I set my SL and TP based on the current Zone and the next one, if available. Q: Does this repaint? A:Yes and this is okay! The "Bear" and "Bull" signals are not meant for taking positions, only showing which candle reveals the Order Block. The Zone is much more useful to us and can result in several successful trades in the near future when treated as a support/resistance area. Q What's the winrate? A:Hard to say - this isn't a standalone strategy and I haven't been able to properly backtest it quite yet.Indicador Pine Script®por DasanCAtualizado 129129 7.7 K
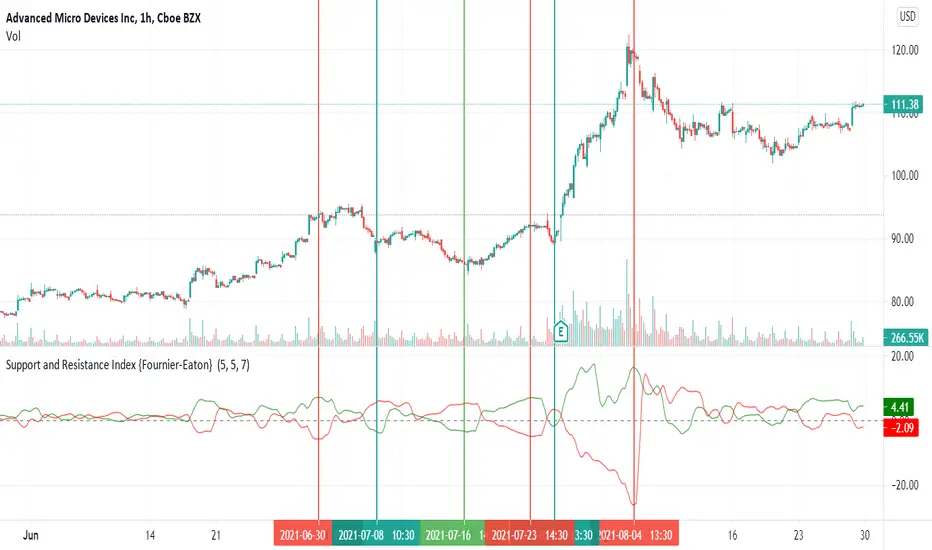
Support and Resistance Index {Fournier-Eaton} This algorithm quantifies the amount of pressure applied by support and resistance and helps confirm trend initiation as levels, relative to horizontal supports and resistances are broken. Look for spread in the red and green lines A low spread will usually indicate a rangebound stock as it is pressured on both sides equally by resistance and support A high spread will typically indicate a stock prepared to make a new directional move. A widening spread will indicate the continuation of a trend A narrowing spread will indicate the beginning of a reversal. More succinctly: A large spread with RED OVER GREEN indicates a high probability of upward reversal -- think downtrend is exhausted. A large spread with GREEN OVER RED indicates a high probability of downward reversal -- think uptrend is exhausted. Shape and relative values (wide green over red etc), not indicator values are of importance, are the most important. Feedback is always helpful and I hope you find this useful. Indicador Pine Script®por etothepii56
CryptoKiller Support ResistanceThe CK family is ready to welcome a new indicator: CryptoKiller Support Resistance. Our oscillator determines the levels where the price has congestion, both up and down. This is why we decided to exploit these signals so as to make an indicator capable of tracking supports and resistances. The indicator marks the support and resistance levels found by CryptoKiller Oscillator, the blue / light blue lines are found during bullish movements; purple and magenta lines are found during bearish movements. The light blue and magenta colors indicate probable support levels, the blue and purple colors indicate probable resistance levels. If multiple lines occur in a narrow price range, the price is in an area where there is a high probability of reversal (probable market top or bottom). As well as CryptoKiller and CryptoKiller Oscillator it is optimized for ETHUSDTPERP 30 min, BTCUSDTPERP 30 min and BNBUSDTPERP 30 min, but it can be used on any chart and timeframe, there is a custom mode with which to change the input parameters. This script is provided together with CryptoKiller and CryptoKiller Oscillator. It is also possible to have it separately from the others, as always with a free trial week. Indicador Pine Script®por cryptokillerlabAtualizado 6620
Marked Highs - Support & Resistance [LevelUp]This indicator mimics the functionality of marked highs/lows in MarketSmith, a charting tool available from Investor's Business Daily. Marked highs/lows, sometimes referred to as pivot highs/lows, can be used to locate areas of support and resistance. These same points can also be helpful when drawing trendlines and channels. I've added several customization options that add to the flexibility and overall usefulness of this technical indicator. Custom Ranges for Marked Highs/Lows In MarketSmith, a marked high is the highest high going back nine bars and forward nine bars. The number of required bars with lower highs on each side of the high is referred to as the period. The default for the indicator is a nine bar period, however, you can configure the period to fit with your trading style. View Marked Highs/Lows on Any Timeframe MarketSmith only supports marked highs/lows on daily charts. With this indicator you can view marked highs/lows on any timeframe. Suggestions ■ Draw horizontal rays from the most recent marked high and low to help visualize areas of support and resistance. ■ Create a channel to show the current trading range. Draw a trendline across marked highs and a separate trendline across marked lows. ■ Increase the marked high/low periods to find more significant highs and lows. Indicador Pine Script®por LevelUpToolsAtualizado 7171 1.7 K
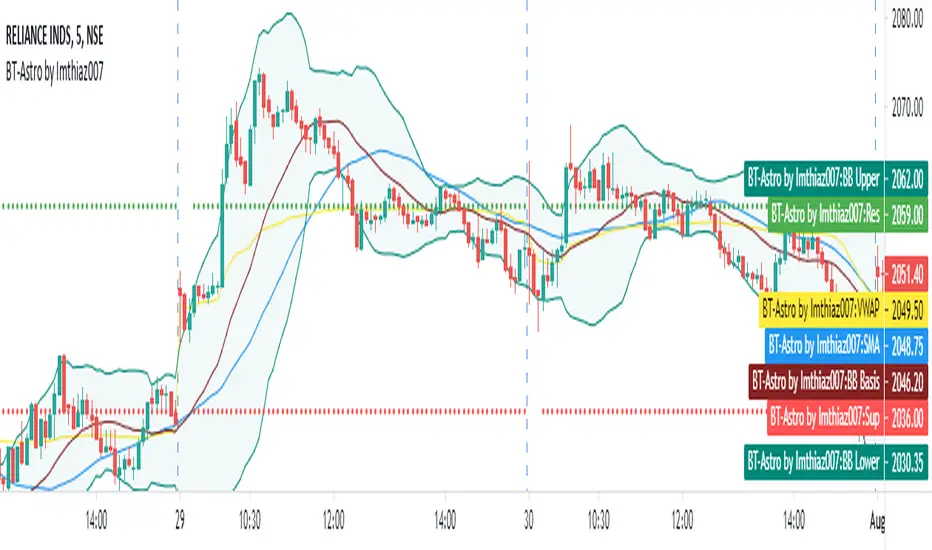
BT Astrology Indicator by Imthiaz007 BT-Astrology Indicator is fine tuned indicator to calculate and draw daly support and resistance based on Gann level for intraday trade or swing trade. The original Idea is given by Mr. Alex from Badshai Trading; I am a Software Developer by profession so that I just coded it and add some signals for back testing. I also add following Indicator for better view: a) Simple Moving Average b) VWAP c) Bollinger Band The Input section of the Indicator : SMA :- Length 35 as per Mr. Alex suggestion Minutes : Enter minutes in terms of number of minutes on which VWAP value will be taken for calculating the levels. By default it will be 20 means VWAP value of 9:35 AM candle will be consider for drawing levels. How it works ? Buy : When resistance is broken with higher high formation and candle is above 35 SMA Sell : When support is broken with lower low formation and candle is below 35 SMA Hope you like it!!! Indicador Pine Script®por imthiaz0072267
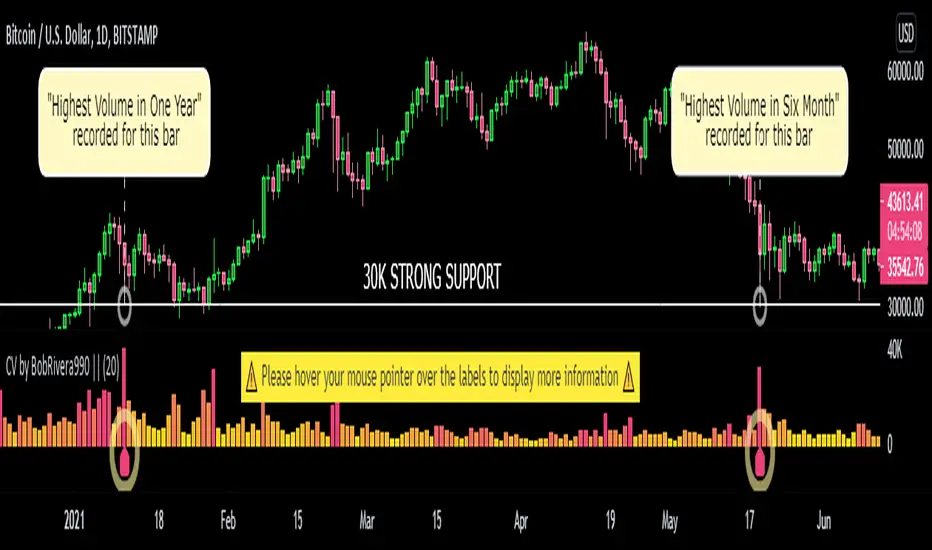
Custom Volume - Periodic Peaks & Troughs + AlertThis script is a custom volume indicator with additional features. But why is this useful? The minimum and maximum volumes, in different time periods, are displayed by labels below the bars. I call them "Peaks" and "Troughs". Hover your mouse cursor over the labels to see more details. These parameters are widely used in technical analysis. If traders want to confirm a reversal on a level of support–or floor–they look for high buying volume. Conversely, if traders are looking to confirm a break in the level of support, they look for low volume from buyers. If traders want to confirm a reversal on a level of resistance–or ceiling– they look for high selling volume. Conversely, if traders are looking to confirm a break in the level of resistance, they look for high volume from buyers. For example, take a look at the chart. Settings menu parameters {Dialog Box} => Parameter to show / hide the dialog box. {Visual Parameters} => Parameters to personalize the appearance of the indicator. { Alert Conditions Part 01: Peaks ⏰ "} => Parameters to customize the alert. { Alert Conditions Part 02: Troughs ⏰ "} => Parameters to customize the alert. {Volume MA} => Moving average settings How to use alerts Note that by creating an alert, an instance of the indicator, with all your settings, will be activated on the site's server and alerts will be triggered by it. After that, changing the indicator settings on the chart will no longer affect the alert. Open the settings window and select the alert conditions as you wish Click the Create Alert button (or press the A key while holding down the ALT key) In the Condition section, select the name of the indicator. Make the rest of the settings as you wish. Finally, click on the Create button. It's finished. After a few moments, your alert will be added to the Alerts menu. Limits The labels are displayed after the bars close. Labels are displayed for the last 10,000 bars. References: InvestopediaIndicador Pine Script®por BobRivera990Atualizado 3232 2.3 K
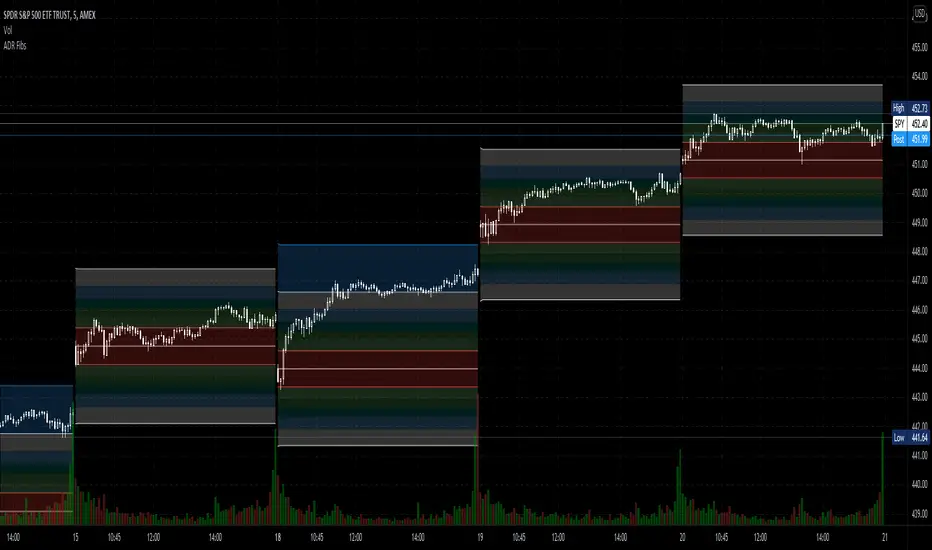
Average Daily Range Fibonacci LevelsThe Average Daily Range is a simple concept, calculated as the difference between daily highs and lows averaged over some period. This indicator uses that range in conjunction with Fibonacci ratios to create zones centered on the day's open that tends to act as areas of support and resistance. The thicker White lines are the ADR levels; all other lines are the same value adjusted by the various Fibonacci values. A simpler version of this concept can be seen in my other script, Average Daily Range Zones, which does not include the Fibonacci ratio zones. Thanks to @Hank Hill for the original idea and TV for the feedback and support on the use of the security() function. Also thanks to @GoldenCross for the Fibonacci obsession. Indicador Pine Script®por colejusticeAtualizado 2424 1.1 K