*Backtesting System ⚉ OVERVIEW ⚉
One of the best Systems for Backtesting your Strategies.
Incredibly flexible, simple, fast and feature-rich system — will solve most of your queries without much effort.
Many systems for setting StopLoss, TakeProfit, Risk Management and advanced Filters.
All you need to do is plug in your indicator and start Backtesting .
I intentionally left the option to use my System on Full Power before you load your indicator into it.
The system uses the built-in simple and popular moving average crossover signal for this purpose. (EMA 50 & 200).
Also Highly Recommend that you Fully use ALL of the features of this system so that you understand how they work before you ask questions.
Also tried to leave TIPS for each feature everywhere, read Tips, activate them and see how they work.
But before you use this system, I Recommend you to read the following description in Full.
—————— How to connect your indicator in 2 steps:
Adapt your indicator by adding only 2 lines of code and then connect it to this Backtesting System.
Step 1 — Create your connector, For doing so:
• 1 — Find or create in your indicator where are the conditions printing the Long-Buy and Short-Sell signals.
• 2 — Create an additional plot as below
I'm giving an example with a Two moving averages cross.
Please replicate the same methodology for your indicator wether it's a MACD, RSI , Pivots, or whatever indicator with Clear Buy and Sell conditions.
//@version=5
indicator('Moving Average Cross', overlay = true)
MA200 = ta.𝚎𝚖𝚊(close, 200)
MA50 = ta.𝚎𝚖𝚊(close, 50)
// Generate Buy and Sell conditions
buy = ta.crossover (MA200, MA50)
sell = ta.crossunder (MA200, MA50)
plot(MA200, color=color.green)
plot(MA50 , color=color.red )
bgcolor(color = buy ? color.green : sell ? color.red : na, title='SIGNALS')
// ———————————————— SIGNAL FOR SYSTEM ————————————————
Signal = buy ? +1 : sell ? -1 : 0
plot(Signal, title='🔌Connector🔌', display = display.none)
// —————— 🔥 The Backtesting System expects the value to be exactly +1 for the 𝚋𝚞𝚕𝚕𝚒𝚜𝚑 signal, and -1 for the 𝚋𝚎𝚊𝚛𝚒𝚜𝚑 signal
Basically, I identified my Buy & Sell conditions in the code and added this at the bottom of my indicator code
Now you can connect your indicator to the Backtesting System using the Step 2
Step 2 — Connect the connector
• 1 — Add your updated indicator to a TradingView chart and Add the Backtesting System as well to the SAME chart
• 2 — Open the Backtesting System settings and in the External Source field select your 🔌Connector🔌 (which comes from your indicator)
_______________________________
⚉ MAIN SETTINGS ⚉
‾‾‾‾‾‾‾‾‾‾‾‾‾‾‾‾‾‾‾‾‾‾‾‾‾‾‾‾‾‾‾
𝐄𝐱𝐭𝐞𝐫𝐧𝐚𝐥 𝐒𝐨𝐮𝐫𝐜𝐞 — Select your indicator. Add your indicator by following the 2 steps described above and select it in the menu. To familiarize yourself with the system until you select your indicator, you will have an in-built strategy of crossing the two moving EMA's of 50 and 200.
Long Deals — Enable/Disable Long Deals.
Short Deals — Enable/Disable Short Deals.
Wait End Deal — Enable/Disable waiting for a trade to close at Stop Loss/Take Profit. Until the trade closes on the Stop Loss or Take Profit, no new trade will open.
Reverse Deals — To force the opening of a trade in the opposite direction.
ReEntry Deal — Automatically open the same new deal after the deal is closed.
ReOpen Deal — Reopen the trade if the same signal is received. For example, if you are already in the long and a new signal is received in the long, the trade will reopen. * Does not work if Wait End Deal is enabled.
𝐓𝐚𝐤𝐞 𝐏𝐫𝐨𝐟𝐢𝐭:
None — Disables take profit. Useful if you only want to use dynamic stoplosses such as MA, Fast-Trailing, ATR Trail.
FIXED % — Fixed take profit in percent.
FIXED $ — Fixed Take in Money.
ATR — Fixed Take based on ATR.
R:R — Fixed Take based on the size of your stop loss. For example, if your stop is 10% and R:R=1, then the Take would be 10%. R:R=3 Take would be 30%, etc.
HH / LL — Fixed Take based on the previous maximum/minimum (extremum).
𝐒𝐭𝐨𝐩 𝐋𝐨𝐬𝐬:
None — Disables Stop Loss. Useful if you want to work without a stop loss. *Be careful if Wait End Deal is enabled, the trade may not close for a long time until it reaches the Take.
FIXED % — Fixed Stop in percent.
FIXED $ — Fixed Stop in Money.
TRAILING — Dynamic Trailing Stop like on the stock exchanges.
FAST TRAIL — Dynamic Fast Trailing Stop moves immediately in profit and stays in place if the price stands still or the price moves in loss.
ATR — Fixed Stop based on the ATR.
ATR TRAIL — Dynamic Trailing Stop based on the ATR.
LO / HI — A Fixed Stop based on the last Maximum/Minimum extemum. Allows you to place a stop just behind or above the low/high candle.
MA — Dynamic Stop based on selected Moving Average. * You will have 8 types of MA (EMA, SMA, HMA, etc.) to choose from, but you can easily add dozens of other MAs, which makes this type of stop incredibly flexible.
Add % — If true, then with the "𝗦𝘁𝗼𝗽 %" parameter you can add percentages to any of the current SL. Can be especially useful when using Stop - 𝗔𝗧𝗥 or 𝗠𝗔 or 𝗟𝗢/𝗛𝗜. For example with 𝗟𝗢/𝗛𝗜 to put a stop for the last High/Low and add 0.5% additional Stoploss.
Fixed R:R — If the stop loss is Dynamic (Trailing or MA) then if R:R true can also be made Dynamic * Use it carefully, the function is experimental.
_________________________________________
⚉ TAKE PROFIT LEVELS ⚉
‾‾‾‾‾‾‾‾‾‾‾‾‾‾‾‾‾‾‾‾‾‾‾‾‾‾‾‾‾‾‾‾‾‾‾‾‾‾‾‾‾
A unique method of constructing intermediate Take Profit Levels will allow you to select up to 5 intermediate Take Profit Levels and one intermediate Stop Loss.
Intermediate Take Profit Levels are perfectly calculated into 5 equal parts in the form of levels from the entry point to the final Take Profit target.
All you need to do is to choose the necessary levels for fixing and how much you want to fix at each level as a percentage. For example, TP 3 will always be exactly between the entry point and the Take Profit target. And the value of TP 3 = 50 will close 50% of the amount of the remaining size of the position.
Note: all intermediate SL/TP are closed from the remaining position amount and not from the initial position size, as TV does by default.
SL 0 Position — works in the same way as TP 1-5 but it's Stop. With this parameter you can set the position where the intermediate stop will be set.
Breakeven on TP — When activated, it allows you to put the stop loss at Breakeven after the selected TP is reached. For this function to work as it should - you need to activate an intermediate Take. For example, if TP 3 is activated and Breakeven on TP = 3, then after the price reaches this level, the Stop loss will go to Breakeven.
* This function will not work with Dynamic Stoplosses, because it simply does not make sense.
CoolDown # Bars — When activated, allows you to add a delay before a new trade is opened. A new trade after CoolDown will not be opened until # bars pass and a new signal appears.
_____________________________
⚉ TIME FILTERS ⚉
‾‾‾‾‾‾‾‾‾‾‾‾‾‾‾‾‾‾‾‾‾‾‾‾‾‾‾‾‾
Powerful time filter code that allows you to filter data based on specific time zones, dates, and session days. This code is ideal for those who need to analyze data from different time zones and weed out irrelevant data.
With Time Filter, you can easily set the starting and ending time zones by which you want to filter the data.
You can also set a start and end date for your data and choose which days of the week to include in the analysis. In addition, you can specify start and end times for a specific session, allowing you to focus your analysis on specific time periods.
_________________________________
⚉ SIGNAL FILTERS ⚉
‾‾‾‾‾‾‾‾‾‾‾‾‾‾‾‾‾‾‾‾‾‾‾‾‾‾‾‾‾‾‾‾‾
Signal Filters — allows you to easily customize and optimize your trading strategies based on 10 filters.
Each filter is designed to help you weed out inaccurate signals to minimize your risks.
Let's take a look at their features:
__________________________________
⚉ RISK MANAGEMENT ⚉
‾‾‾‾‾‾‾‾‾‾‾‾‾‾‾‾‾‾‾‾‾‾‾‾‾‾‾‾‾‾‾‾‾‾
Risk management tools that allow you to set the maximum number of losing trades in a row, a limit on the number of trades per day or week and other filters.
Loss Streak — Set Max number of consecutive loss trades.
Win Streak — Max Winning Streak Length.
Row Loss InDay — Max of consecutive days with a loss in a row.
DrawDown % — Max DrawDown (in % of strategy equity).
InDay Loss % — Set Max Intraday Loss.
Daily Trades — Limit the number of MAX trades per day.
Weekly Trades — Limit the number of MAX trades per week.
* 🡅 I would Not Recommend using these functions without understanding how they work.
Order Size — Position Size
• NONE — Use the default position size settings in Tab "Properties".
• EQUITY — The amount of the allowed position as a percentage of the initial capital.
• Use Net Profit — On/Off the use of profit in the following trades. *Only works if the type is EQUITY.
• SIZE — The size of the allowed position in monetary terms.
• Contracts — The size of the allowed position in the contracts. 1 Сontract = Сurrent price.
________________
⚉ NOTES ⚉
‾‾‾‾‾‾‾‾‾‾‾‾‾‾‾‾
It is important to note that I have never worked with Backtesting and the functions associated with them before.
It took me about a month of slow work to build this system.
I want to say Big Thanks:
• The PineScripters🌲 group, the guys suggested how to implement some features. Especially @allanster
• Thanks to all those people who share their developments for free on TV and not only.
• I also thank myself for not giving up and finishing the project, and not trying to monetize the system by selling it. * Although I really want the money :)
I tried hard to make it as fast and convenient as possible for everyone who will use my code.
That's why I didn't use any libraries and dozens of heavy functions, and I managed to fit in 8+-functions for the whole code.
Absolutely every block of code I tried to make full-fledged modular, that it was easy to import/edit for myself (you).
I have abused the Ternary Pine operator a little (a lot) so that the code was as compact as possible.
Nevertheless, I tried very hard to keep my code very understandable even for beginners.
At last I managed to write 500 lines of code, making it one of the fastest and most feature-rich systems out there.
I hope everyone enjoys my work.
Put comments and write likes.
Strategy

Kitchen [ilovealgotrading]
OVERVIEW:
Kitchen is a strategy that aims to trade in the direction of the trend by using supertrend and stochRsi data by calculating at different time values.
IMPLEMENTATION DETAILS – SETTINGS:
First of all, let's understand the supertrend and stocrsi indicators.
How do you read and use Super Trend for trading ?
The price is often going upwards when it breaks the super trend line while keeping its position above the indication level.
When the market is in a bullish trend, the indicator becomes green. The indicator level will act as trendline support in such a scenario. The color of the indicator changes to red to indicate a negative trend once the price crosses the support line. The price uses the super trend level as a trendline resistance during a bearish move.
In our strategy, if our 1-hour and 4-hour supertrend lines show the up or down train in the same direction at the same time, we can assume that a train is forming here.
Why do I use the time of 1 hour and 4 hours ?
When I did a backtest from the past to the present, I discovered that the most accurate and consistent time zones are the 1 hour and 4 hour time zones.
By the way we can change our short term timeframe(1H) and long term timeframe(4H) from settings panel.
How do you read and use the Stoch-RSI Indicator?
This indicator analyzes price dynamics automatically to detect overbought and oversold locations.
The indicator includes:
- The primary line, which typically has values between 0 and 100;
- Two dynamic levels for overbought and oversold conditions.
IF our stoch-rsi indicator value has fallen below our lower boundary line, the oversold event has been observed in the price, if our stoch-rsi value breaks up our bottom line after becoming oversold, we think that the price will start the recovery phase.(The case is also true for the opposite.)
However, this does not always apply and we need additional approvals, Therefore, our 1H and 4H supertrrend indicator provides us with additional confirmation.
Buy Condition:
Our 1H(short term) and 4H(long term) supertrrend indicator, has given the buy signal(green line and yellow line), and if our stochrsi indicator has broken our oversold line up on the past 15 bars, the buy signal is formed here.
Sell Condition:
Our 1H(short term) and 4H(long term) supertrrend indicator, has given the sell signal(red line and orange line), and if our stochrsi indicator has broken our overbuy line down on the past 15 bars, the sell signal is formed here.
Stop Loss or Take Profit Conditions:
Exit Long Senerio:
All conditions are completed, the buy signal has arrived and we have entered a LONG trade, the 1-hour supertrend line follows the price rise(yellow line), if the price breaks below the 1-hour super trend line and a sell condition occurs for 1H timeframe for supertrend indcator, LONG trade will exit here.
Exit Short Senerio:
All conditions are completed, the Sell signal has arrived and we have entered a SHORT trade, the 1-hour supertrend line follows the price down(orange line), if the price breaks up the 1-hour super trend line and a buy condition occurs for 1H timeframe for supertrend indcator, SHORT trade will exit here.
What can you change in the settings panel?
1-We can set Start and End date for backtest and future alarms
2-We can set ATR length and Factor for supertrend indicator
3-We can set our short term and long term timeframe value
4-We can set StochRsi Up and Low limit to confirm buy and sell conditions
5-We can set stochrsi retroactive approval length
6-We can set stochrsi values or the length
7-We can set Dollar cost for per position
8- We can choose the direction of our positions, we can set only LONG, only SHORT or both directions.
9-IF you want to place automatic buy and sell orders with this strategy, you can paste your codes into the Long open-close or Short open-close message sections.
For example
IF you write your alert window this code {{strategy.order.alert_message}}.
When trigger Long signal you will get dynamically what you pasted here for Long Open Message
ALSO:
Please do not open trades without properly managing your risk and psychology!!!
If you have any ideas what to add to my work to add more sources or make calculations cooler, suggest in DM .

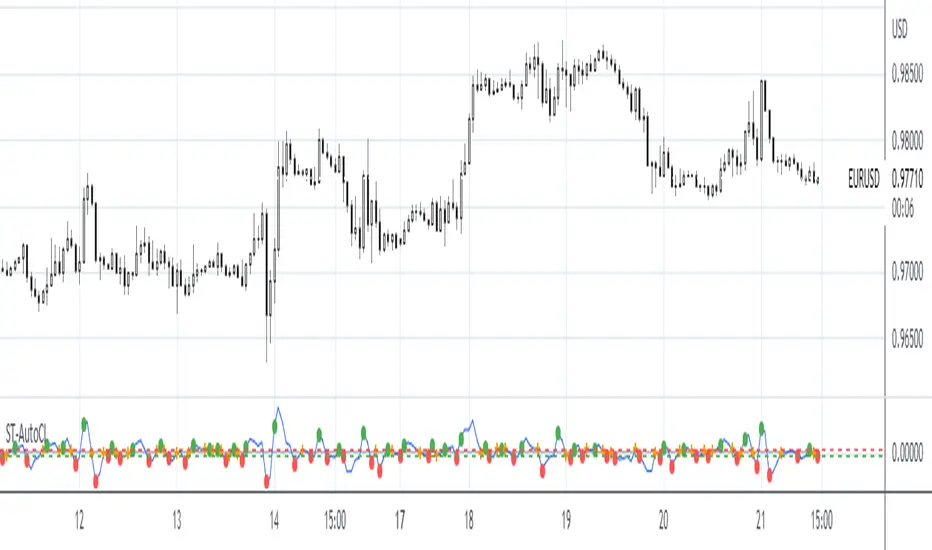
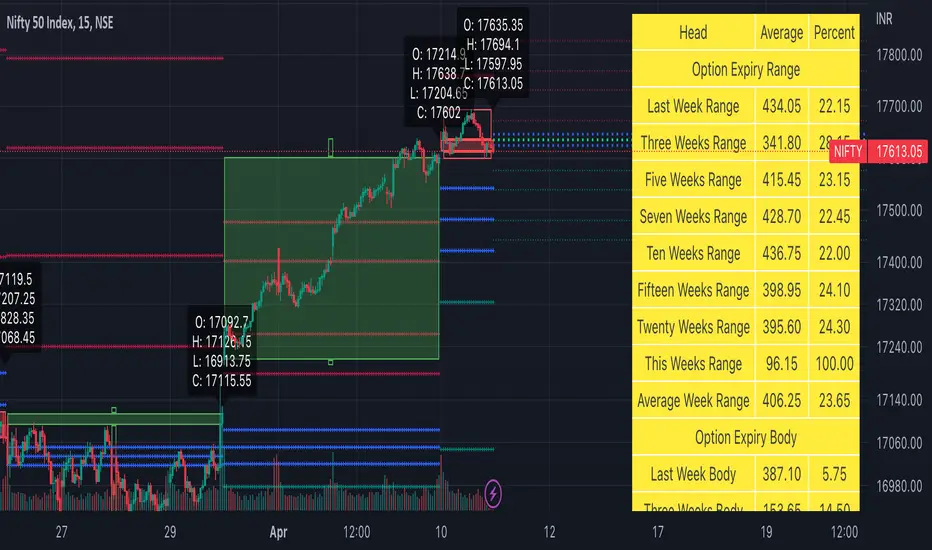
Weekly Options Expiry Candle V.2In India Weekly options expire on Thursday and that creates a different price action candle than the week timeframe.
My previous script Weekly Options Expiry Candle has some limitations. This script overcame those limitations and added some features.
You can use this in any intraday time frame candle.
It will show:
All expiry candle in box format
Expiry OHLC label
Pivot (Floor or Fibonacci) based on expiry OHLC data
Developing Expiry candle and Pivot
A table showing expiry range(high-low) and Expiry body abs(open-close) stats.
You can turn on or off any feature.
Please let me know if you found this script useful or have any questions or suggestions.
NSE:BANKNIFTY
NSE:NIFTY
Divergence for Many [Dimkud - v5]Strategy is based on "Divergence for Many Indicators v4 ST" strategy by CannyTolany01
which is based on "Divergence for Many Indicator" indicator by LonesomeTheBlue
This strategy is searching for divergences on 18 indicators which you can select and optimise one by one.
Additionally you can connect any other External Indicator value. (just add this indicator the the chart and select option in settings)
To the original indicator/strategy I have added 9 additional indicators:
( Money Flow Index, Williams_Vix, Stochastic RSI , SMI Ergodic Oscillator, Volume Weighted MACD , Bull Bear Power, Balance of Power , Relative Volatility Index , Logistic Settings).
Converted strategy to v5 of Pine Script.
Added Static SL/TP in percents (%).
Added filters to filter enters:
1. Volume Weighted MACD - Multi-TimeFrame Filter
(It checks for histogram to falling or rising for a set periods of bars)
2. Money Flow Index - Multi-TimeFrame Filter
(It checks if MFI Oscillator is in the set diapason.
Also It checks if MFI is falling or rising for a set periods of bars )
3. ATR filter
(check changes in fast ATR to slow ATR )
Strategy shows good backtest results on many crypto tokens on 45m - 1h periods. (with parameters optimisation for every indicator)
To find best parameters - you can enable indicators one-by one, and optimise best parameters for each of them.
Then enable all indicators with successful results.
Optimise SL/TP.
Then try to enable and optimise filters (channels etc.)
The better is to optimise parameters separately for Short and Long trading. And run two separate bots (in settings enable only Long or only Short.)
Updates:
- Added visualisation for open trades (SL/TP)
- Added Volatility filter by ATR with many options for tests.
- Fixed some small bugs.
- Added second RSI filter (you can use two RSIs with different TF or settings)
- Updated ATR volatility and MFI filter. Removed non-effective options
- Added CCI filter
- Added option to Enable/Disable visualisation of TP/SL on chart
- Fixed one small quick bug. ("ATR filter short" was not working)
- Added Super Trend filter
- Added Momentum filter
- Added Volume Filter
- All "request.security" MultiTimeFrame calls changed to 100% non-repait function "f_security()"

Baseline Cross Qualifier Volatility Strategy with HMA Trend BiasFor trading ES on 30min Chart
Trading Rules
Post Baseline Cross Qualifier (PBCQ): If price crosses the baseline but the trade is invalid due to additional qualifiers, then the strategy doesn't enter a trade on that candle. This setting allows you override this disqualification in the following manner: If price crosses XX bars ago and is now qualified by other qualifiers, then the strategy enters a trade.
Volatility: If price crosses the baseline, we check to see how far it has moved in terms of multiples of volatility denoted in price (ATR x multiple). If price has moved by at least "Qualifier multiplier" and less than "Range Multiplier", then the strategy enters a trade. This range is shown on the chart with yellow area that tracks price above/blow the baseline. Also, see the dots at the top of the chart. If the dots are green, then price passes the volatility test for a long. If the dots are red, then price passes the volatility test for a short.
Take Profit/Stoploss Quantity Removed
1 Take Profit: 100% of the trade is closed when the profit target or stoploss is reached.
2 Take Profits: Quantity is split 50/50 between Take Profit 1 and Take Profit 2
3 Take Profits: Quantify is split 50/25/25.
Stratgey Inputs
Baseline Length
37
Post Baseline Cross Qualifier Enabled
On
Post Baseline Cross Qualifier Bars Ago
9
ATR Length
9
Volatility Multiplier
0
Volatility Range Multiplier
10
Volatility Qualifier Multiplier
2
Take Profit Type
1 Take Profit
HMA Length
11

Kimchi Premium StrategyThis strategy is based on the Korea Premium, also known as the “Kimchi Premium,” which indicates how expensive or cheap the price of Bitcoin in Korean Won on a Bitcoin exchange in South Korea is relative to the price of Bitcoin being traded in USD or Tether. Inverse Kimchi Premium RSI was newly defined to create a strategy with Kimchi Premium. Assuming that the larger the kimchi premium, the greater the individual's purchasing power. In this case, if the Inverse Kimchi Premium RSI falls and closes the candle below the bear level, a short is triggered. Long is the opposite.
This strategy defaults to a combination of the traditional RSI and the Inverse Kimchi Premium RSI. If the user wishes to unlock the Inverse Kimchi Premium RSI combination and only use it as a traditional RSI strategy, the following settings can be used.
Use Combination of Inverse Kimchi Premium RSI: Uncheck
Resolution: Chart (4hr Candle)
Source: Close
Length of RSI: 14
Bull Level: 74
Bear Level: 25
__________________________________________________________________________________
김치프리미엄(김프) 전략은 달러 혹은 테더로 거래되고 있는 비트코인 가격 대비 한국에 있는 비트코인 거래소의 비트코인 원화 가격이 얼마나 비싸고 싼 지를 나타내는 코리아 프리미엄, 일명 "김치 프리미엄" 지표를 기반으로 만들어졌습니다. 김치 프리미엄을 가지고 전략을 만들기위해 Inverse Kimchi Premium RSI를 새롭게 정의하였습니다. 김치 프리미엄이 커질수록 개인의 매수세가 커진다고 가정하고, 이 경우 Inverse Kimchi Premium RSI이 하락하여 Bear Level 아래에서 캔들 마감을 하면 Short을 트리거 합니다. Long은 그 반대입니다.
이 전략은 전통적인 RSI와 Inverse Kimchi Premium RSI을 조합하여 기본값을 설정하였습니다. 유저가 원한다면 Inverse Kimchi Premium RSI의 조합을 해제하고 전통적인 RSI 전략으로만 사용하려면 아래 다음의 설정값을 사용할 수 있습니다.
Use Combination of Inverse Kimchi Premium RSI: 체크 해제
Resolution: Chart (4hr Candle)
Source: Close
Length of RSI: 14
Bull Level: 74
Bear Level: 25

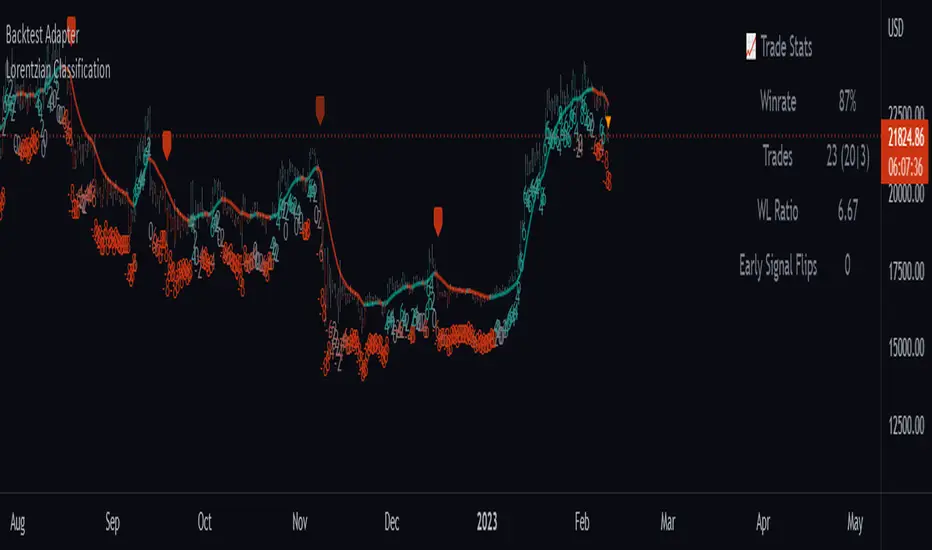
Backtest AdapterThis is a proof-of-concept Backtest Adapter that can be used with my recent publication "Machine Learning: Lorentzian Classification" located here:
This adapter is helpful because it enables interactive backtesting with TradingView's built-in "Strategy Tester" framework without the need to translate the logic from an "indicator" script to a "strategy" script.
To use this, one must have the "Machine Learning: Lorentzian Classification" script and this Backtest Adapter open simultaneously on the same chart. From there, simply change the "Source" setting of the Backtest Adapter to "Lorentzian Classification: Backtest Stream" to transfer the entry/exit signals stream to the Backtest Adapter.
For an example of how to implement your own backtest stream in your indicators, please refer to the "Backtesting" section in the source code of the "Machine Learning: Lorentzian Classification" script, which is shown below for convenience:
Rocket Grid Algorithm - The Quant ScienceThe Rocket Grid Algorithm is a trading strategy that enables traders to engage in both long and short selling strategies. The script allows traders to backtest their strategies with a date range of their choice, in addition to selecting the desired strategy - either SMA Based Crossunder or SMA Based Crossover.
The script is a combination of trend following and short-term mean reversing strategies. Trend following involves identifying the current market trend and riding it for as long as possible until it changes direction. This type of strategy can be used over a medium- to long-term time horizon, typically several months to a few years.
Short-term mean reversing, on the other hand, involves taking advantage of short-term price movements that deviate from the average price. This type of strategy is usually applied over a much shorter time horizon, such as a few days to a few weeks. By rapidly entering and exiting positions, the strategy seeks to capture small, quick gains in volatile market conditions.
Overall, the script blends the best of both worlds by combining the long-term stability of trend following with the quick gains of short-term mean reversing, allowing traders to potentially benefit from both short-term and long-term market trends.
Traders can configure the start and end dates, months, and years, and choose the length of the data they want to work with. Additionally, they can set the percentage grid and the upper and lower destroyers to manage their trades effectively. The script also calculates the Simple Moving Average of the chosen data length and plots it on the chart.
The trigger for entering a trade is defined as a crossunder or crossover of the close price with the Simple Moving Average. Once the trigger is activated, the script calculates the total percentage of the side and creates a grid range. The grid range is then divided into ten equal parts, with each part representing a unique grid level. The script keeps track of each grid level, and once the close price reaches the grid level, it opens a trade in the specified direction.
The equity management strategy in the script involves a dynamic allocation of equity to each trade. The first order placed uses 10% of the available equity, while each subsequent order uses 1% less of the available equity. This results in the allocation of 9% for the second order, 8% for the third order, and so on, until a maximum of 10 open trades. This approach allows for risk management and can help to limit potential losses.
Overall, the Rocket Grid Algorithm is a flexible and powerful trading strategy that can be customized to meet the specific needs of individual traders. Its user-friendly interface and robust backtesting capabilities make it an excellent tool for traders looking to enhance their trading experience.

Price Swing Detection - Smart Money ConceptSince my own style is Smart Money Concept and these days I have seen a lot of my friends who are having trouble identifying structures for their indicators and strategies. I wrote this code so they could use it in their strategy . In fact, this type of structure, as one of the strongest technical structures, can increase the success of your strategy according to your personalization.
The script detects swings (i.e. significant highs and lows) in a financial instrument's price action over a specified period. The user can set the lookback period (number of candles to consider) and the colors of the lines representing bullish and bearish trends.
The script has two functions: detectSwing and pivot high. The detectSwing function calculates the swing highs and lows for the specified number of candles. The function uses the ta.highest and ta.lowest functions to find the highest and lowest prices, respectively, over the lookback period. The function also determines the swing state (high or low) of the current candle and returns the calculated swing values.
The pivot high function calculates the pivot high, which is an important step in detecting bullish structures in the market. If a new top (i.e. swing high) is found, the script updates the pivot high values and creates a line from the recent top to the last bar. The script also updates the trailing maximum values, which are used to extend the top extension line.
For Strategy :
The variable "trendDirection" in the code is used to keep track of the trend state, either bullish (up trend) or bearish (down trend), in the market. The variable is initialized to 0 which represents a downtrend. The value of this variable is updated later in the code based on the calculations of swing highs and lows, pivot crosses, and the trailing maximum. If a bullish structure is detected, the value of "trendDirection" is set to 1, indicating an uptrend.

Setup Max e Min Larry WilliansLarry Williams used this system to win the trading championship
Hello friends, I bring a script with a trading strategy to be used in futures such as Index, Forex and Commodities. Developed by famous trader Larry Williams.
In them we use two 3-period Simple Moving Averages (Arithmetic) (one with the high price, the other with the low price), and a 21-period Moving Average (Arithmetic) to determine the trend. This will form an average channel with the prices of the maximums and minimums of the last three candles.
Best time charts use the strategy: from 5 minutes to 60 minutes.
This strategy is quite simple. The 21 Moving Average will color according to the trend (Green for bullish, Red for bearish and Gray for transitions). The Script will signal the entry according to the trend by the colors of the candles and also by the signal:
When green, the buy will be on the crossing of the lower Moving Average crossing the candlestick, and the exit will be on the crossing of the candlestick on the next Upper Moving Average.
When red, the sell will be at the crossing of the Upper Moving Average crossing the candlestick, and the exit will be at the crossing of the candlestick on the next Lower Moving Average.
When the Script signals the candle with a purple X, it means that the trend is changing and the entire open operation must be closed.
This system has no Stop, so be careful when using it.
Na linguagem do autor:
Larry Williams usou esse sistema ganhar campeonato de trade
Olá amigos, trago um script com uma estratégia de trade pra ser usada em futuros como Índice, Forex e Commodities. Desenvolvido pelo famoso trader Larry Willians.
Neles usamos duas Médias Móveis Simples (Aritmética) de 3 períodos (uma com o preço da máxima, outra com o preço da mínima), e uma Média Móvel (Aritmética) de 21 períodos para determinar a tendência. Nisso vai formar uma canal de médias com os preços das máximas e mínimas dos últimos três candles.
Melhores tempos gráficos usar a estratégia: de 5 minutos até 60 minutos.
Essa estratégia é bem simples. A Média Móvel de 21 irá colorir de acordo com a tendência (Green pra alta, Red para baixa e Gray para transições). O Script irá sinalizar a entrada de acordo com a tendência pela cores dos candles e também pela sinalização:
Quando green, a compra será no cruzamento da Média Móvel inferior cruzando o candle, e a saida será no cruzamento do candle na Média Móvel Superior seguinte.
Quando red, a venda será no cruzamento da Média Móvel Superior cruzando o candle, e a saida será no cruzamento do candle na Média Móvel Inferior seguinte.
Quando o Script sinaliza o candle com X purple, significa que a tendência está em mudança e deve ser fechada toda a operação em aberto.
Este sistema não possui Stop, portando cuidado quanto a seu uso.

Strategy: Range BreakoutWhat?
In the price action, levels have a significant role to play. Based on the price moving above/below the levels - the underlying instrument shows some price-action in the direction of breakout/breakdown.
There are plenty of ways level can be determined. Levels are the decision point to take a trade or not. But if we make the level derivation complex, then the execution may get hamper.
This strategy script, developed in PineScript v5, is our attempt at solving this problem at the core by providing this simple, yet elegant solution to this problem.
It's essentially an attempt to Trade Simple by drawing logical (horizontal) lines in the chart and take actions, after multiple associated parameters confirmation, on the breakout / breakdown of the levels.
How?
Let us explain how we are drawing the levels.
We are depending on some of the parameters as described below:
Open Range : During intraday movement, often if prices move beyond a particular level, it exibits more movement in the same swing in same direction. We found out, through our back testing for Indian Indices like NSE:NIFTY , NSE:BANKNIFTY or NSE:CNXFINANCE the first 15m (i.e 09:15 AM to 09:30 AM, IST) is one of such range. For Indian stocks, it is 9:15 to 9:45. And for MCX MCX:CRUDEOIL1! it's 5:00 pm to 6:00 pm. There are our first levels.
PDHCL : Previous Day High, Close, Low. This is our next level
VWAP : The rolling VWAP (volume weighted average price)
In the breakout/breakdown of the Open Range and Previous Day High/Low, we are taking the trade decisions as follows using CEST principle:
C onditions :
If current bar's (say you are in 5m timeframe) closing is broken out the Open Range High or Previous Day High, taken a Buy/Long decision (let's say buying a Call Option CE or selling a Put Option PE or buying the future or cash).
If current bar's (say you are in 5m timeframe) closing is broken down the Open Range Low or Previous Day Low, taken a Sell/Short decision (let's say buying a Put Option CE or selling a Call Option PE or selling the future or cash).
Additionally, and optionally (default ON, one can turn off): we are checking various other associated multiple confirmations as follows:
1. Momentum : Checking 14-period RSI value is more than 50 or less than 50 (all parameters like period, OB, OS ranges are configurable through settings)
2. Current bar's volume is more than the last 20 bars volume average. How much more - that multiplier is also configurable. (default is 1)
3. The breakout candle is bullish (green) or bearish (red).
E ntry :
All of these happens only on the closing of the candle . Means: Non Repainting! .
Clearly in the chart we are showing as green up arrow BO (breakout for buy) and red down arrow BD (breakdown for sell) to take your decision process smooth.
So, on the closing of the decision BO/BD candle we are entering the trade (with a thumping heart and nail biting ...)
S top Loss :
We are relying on the time tasted (last 40 years) mechanism of Average True Range (ATR) of default 14 period. This default period is also configurable.
So for Long trades: the 14 period ATR low band is the SL.
For Short trades: the 14 period ATR high band is the SL.
T arget :
We are depending on the thump rule of 1:2 Risk Reward. It's simple and effective. No fancy thing. We are closing the trade on double the favorable price movement compared to the SL placed. Of course, this RR ratio is confiurable from the settings, as usual.
What's Unqiue in it?
The utter simplicity of this trading mechanism. No fancy things like complex chart pattern, OI data, multiple candlestick patterns, Order flow analysis etc.
Simple level determination,
Marking clearly in the chart.
Making each parameter configurable in Settings and showing tooltip adjacent to the parameter to make you understand it better for your customization,
Wait for the candle close, thus eliminating the chances of repainting menace (as much as possible)
Additional momentum and volume check to trade entry confirmation.
Works with normal candlestick (nothing special ones like HA ...)
Showing everything as a Summary Table (which, again can be turned off optionally) overlaying at the bottom-right corner of the chart,
Optionally the Summary Table can be configured to alert you back (say you get it notified in your email or SMS).
That way, a single, simple, effective trade setup will ease your journey as smooth sail as possible.
Mentions
There are plenty of friends from whom time to time we borrowed some of the ideas while working closely together over last one year.
From tradingview community, we took the spirit of @zzzcrypto123 awesome work done long back (in 2020) as the indicator "ORB - Opening Range Breakout". (We tried to reach him for his explicit consent, unable to catch hold of him).
Some other publicly available materials we have consulted to get the additional checks (like RSI, volume).
Lat word
Use it please and thank you for your constant patronage in following us in this awesome platform. Let's keep growing together.
Disclaimer :
This piece of software does not come up with any warrantee or any rights of not changing it over the future course of time.
We are not responsible for any trading/investment decision you are taking out of the outcome of this indicator.

Flying Dragon Trend StrategyFlying Dragon Trend Strategy can be used to indicate the trend on all timeframes by finetuning the input settings.
The Flying Dragon Trend family includes both the strategy and the indicator, where the strategy supports of selecting the optimal set of inputs for the indicator in each scenario. Highly recommended to get familiar with the strategy first to get the best out of the indicator.
Flying Dragon Trend plots the trend bands into the ribbon, where the colours indicate the trend of each band. The plotting of the bands can be turned off in the input settings. Based on the user selectable Risk Level the strategy is executed when the price crosses the certain moving average line, or at the Lowest risk level all the bands have the same colour.
The main idea is to combine two different moving averages to cross each other at the possible trend pivot point, but trying to avoid any short term bounces to affect the trend indication. The ingenuity resides in the combination of selected moving average types, lengths and especially the offsets. The trend bands give visual hint for the user while observing the price interaction with the bands, one could say that when "the Dragon swallows the candles the jaws wide open", then there is high possibility for the pivot. The leading moving average should be fast while the lagging moving average should be, well, lagging behind the leading one. There is Offset selections for each moving average, three for leading one and one for the lagging one, those are where the magic happens. After user has selected preferred moving average types and lengths, by tuning each offset the optimal sweet spot for each timeframe and equity will be found. The default values are good enough starting points for longer (4h and up) timeframes, but shorter timeframes (minutes to hours) require different combination of settings, some hints are provided in tooltips. Basically the slower the "leading" moving average (like HMA75 or HMA115) and quicker the "lagging" moving average (like SMA12 or SMA5) become, the better performance at the Lowest risk level on minute scales. This "reversed" approach at the minute scales is shown also as reversed colour for the "lagging" moving average trend band, which seems to make it work surprisingly well.
The Flying Dragon Trend does not necessarily work well on zig zag and range bounce scenarios without additional finetuning of the input settings to fit the current condition.
Strategy direction selector by DashTrader.

Stockbee Momentum BurstThis is a script to color code bars based on the bullish- and bearish combination.
Bullish Combination
Percent: Price >= 4% from yesterday and Volume today > Yesterday
Dollar: Price >= 0.9 dollar from open
Base Requirements
- Price > Yesterday's close
- Price > Open
- Price is within 30% of high
- Todays price range >= Yesterdays price range
- Yesterday's move <= 2%
- Volume >= 100 000
Bearish Combination
Percent: Price <= 4% from yesterday and Volume today > Yesterday
Dollar: Price <= 0.9 dollar from open
Base Requirements
- Price < Yesterday's close
- Price < Open
- Price is within 30% of low
- Todays price range >= Yesterdays price range
- Yesterday's move >= -2%
- Minimum volume for each of last 3 days >= 100 000
Momentum Filter
These are based on the 10 and 20 EMA crossover, where the former above would indicate upward momentum and below downward momentum. This can help to narrow down the color code to continuation phases. The linked option will override all other momentum filters, bullish candles will be displayed when EMA 10 > 20 and bearish candles when EMA 10 < 20.

Selected Dates Filter by @zeusbottradingWe are presenting you feature for strategies in Pine Script.
This function/pine script is about NOT opening trades on selected days. Real usage is for bank holidays or volatile days (PPI, CPI, Interest Rates etc.) in United States and United Kingdom from 2020 to 2030 (10 years of dates of bank holidays in mentioned countries above). Strategy is simple - SMA crossover of two lengts 14 and 28 with close source.
In pine script you can see we picked US and GB bank holidays. If you add this into your strategy, your bot will not open trades on those days. You must make it a rule or a condition. We use it as a rule in opening long/short trades.
You can also add some of your prefered dates, here is just example of our idea. If you want to add your preffered days you can find them on any site like forexfactory, myfxbook and so on. But don’t forget to add function “time_tradingday ! = YourChoosedDate” as it is writen lower in the pine script.
Sometimes the date is substituted for a different day, because the day of the holiday is on Saturday or Sunday.
Made with ❤️ for this community.
If you have any questions or suggestions, let us know.
The script is for informational and educational purposes only. Use of the script does not constitutes professional and/or financial advice. You alone the sole responsibility of evaluating the script output and risks associated with the use of the script. In exchange for using the script, you agree not to hold zeusbottrading TradingView user liable for any possible claim for damages arising from any decision you make based on use of the script.

[-_-] Level Breakout, Auto Backtesting StrategyDescription:
A Long only strategy based on breakout from a certain level formed by High price. It has auto-backtesting capabilities (you set ranges for the three main parameters: Lookback, TP and SL; the strategy then goes through different combinations of those parameters and displays a table with results that you can sort by Percentage of profitable trades AND/OR Net profit AND/OR Number of trades). So you can, for example, sort only by Net profit to find combination of parameters that gives highest net profit, or sort by Net profit and Percentage profitable to find a combination of parameters that gives the best balance between profitability and profit. The auto-backtesting also takes into account the commission which is set in % in the inputs (make sure to set the same value in properties of the strategy so that auto-backtesting and real backtesting results match).
NOTE: auto-backtesting only find the best combinations and displays them in a table, you will then need to manually set the Lookback, TP and SL inputs for real backtesting to match.
Parameters:
- Lookback -> # of bars for filtering signals; recommended range from 2 to 5
- TP (%) -> take profit; recommended range from 5 to 10
- SL (%) -> stop loss; recommended range from 1 to 5
- Commission (%) -> commission per trade
- Min/Max Lookback -> lookback range for auto-backtesting
- Min/Max TP -> take profit range for auto-backtesting
- Min/Max SL -> stop loss range for auto-backtesting
- Percentage profitable -> sort by percentage of profitable trades
- Net profit -> sort by net profit
- Number of trades -> sort by number of trades

Chandelier Exit ZLSMA StrategyIntroduction
Heyo guys, I recently checked out some eye-catching trading strategy videos on YT and found one to test.
This indicator is based on the video.
Usage
The recommended timeframe is 5 min.
Signals
Long Entry => L Label
Price crosses above ZLSMA and Chandelier Exit shows Buy
Long Exit => green circle
Price crosses below ZLSMA
Short Entry => S Label
Price crosses below ZLSMA and Chandelier Exit shows Sell
Short Exit => orange circle
Prices crosses above ZLSMA
Ty for checking this out. Enjoy!
--
Credits to
@netweaver2011 - ZLSMA
@everget – Chandelier Exit

Ultimate Strategy Template (Advanced Edition)Hello traders
This script is an upgraded version of that one below
New features
- Upgraded to Pinescript version 5
- Added the exit SL/TP now in real-time
- Added text fields for the alerts - easier to send the commands to your trading bots
Step 1: Create your connector
Adapt your indicator with only 2 lines of code and then connect it to this strategy template.
For doing so:
1) Find in your indicator where are the conditions printing the long/buy and short/sell signals.
2) Create an additional plot as below
I'm giving an example with a Two moving averages cross.
Please replicate the same methodology for your indicator wether it's a MACD , ZigZag , Pivots , higher-highs, lower-lows or whatever indicator with clear buy and sell conditions.
//@version=5
indicator(title='Moving Average Cross', shorttitle='Moving Average Cross', overlay=true, precision=6, max_labels_count=500, max_lines_count=500)
type_ma1 = input.string(title='MA1 type', defval='SMA', options= )
length_ma1 = input(10, title=' MA1 length')
type_ma2 = input.string(title='MA2 type', defval='SMA', options= )
length_ma2 = input(100, title=' MA2 length')
// MA
f_ma(smoothing, src, length) =>
rma_1 = ta.rma(src, length)
sma_1 = ta.sma(src, length)
ema_1 = ta.ema(src, length)
iff_1 = smoothing == 'EMA' ? ema_1 : src
iff_2 = smoothing == 'SMA' ? sma_1 : iff_1
smoothing == 'RMA' ? rma_1 : iff_2
MA1 = f_ma(type_ma1, close, length_ma1)
MA2 = f_ma(type_ma2, close, length_ma2)
// buy and sell conditions
buy = ta.crossover(MA1, MA2)
sell = ta.crossunder(MA1, MA2)
plot(MA1, color=color.new(color.green, 0), title='Plot MA1', linewidth=3)
plot(MA2, color=color.new(color.red, 0), title='Plot MA2', linewidth=3)
plotshape(buy, title='LONG SIGNAL', style=shape.circle, location=location.belowbar, color=color.new(color.green, 0), size=size.normal)
plotshape(sell, title='SHORT SIGNAL', style=shape.circle, location=location.abovebar, color=color.new(color.red, 0), size=size.normal)
/////////////////////////// SIGNAL FOR STRATEGY /////////////////////////
Signal = buy ? 1 : sell ? -1 : 0
plot(Signal, title='🔌Connector🔌', display = display.data_window)
Basically, I identified my buy, sell conditions in the code and added this at the bottom of my indicator code
Signal = buy ? 1 : sell ? -1 : 0
plot(Signal, title="🔌Connector🔌", transp=100)
Important Notes
🔥 The Strategy Template expects the value to be exactly 1 for the bullish signal, and -1 for the bearish signal
Now you can connect your indicator to the Strategy Template using the method below or that one
Step 2: Connect the connector
1) Add your updated indicator to a TradingView chart
2) Add the Strategy Template as well to the SAME chart
3) Open the Strategy Template settings and in the Data Source field select your 🔌Connector🔌 (which comes from your indicator)
From then, you should start seeing the signals and plenty of other stuff on your chart
🔥 Note that whenever you'll update your indicator values, the strategy statistics and visual on your chart will update in real-time
Settings
- Color Candles: Color the candles based on the trade state ( bullish , bearish , neutral)
- Close positions at market at the end of each session: useful for everything but cryptocurrencies
- Session time ranges: Take the signals from a starting time to an ending time
- Close Direction: Choose to close only the longs, shorts, or both
- Date Filter: Take the signals from a starting date to an ending date
- Set the maximum losing streak length with an input
- Set the maximum winning streak length with an input
- Set the maximum consecutive days with a loss
- Set the maximum drawdown (in % of strategy equity)
- Set the maximum intraday loss in percentage
- Limit the number of trades per day
- Limit the number of trades per week
- Stop-loss: None or Percentage or Trailing Stop Percentage or ATR - I'll add shortly multiple options for the trailing stop loss
- Take-Profit: None or Percentage or ATR - I'll add also a trailing take profit
- Risk-Reward based on ATR multiple for the Stop-Loss and Take-Profit
Special Thanks
Special thanks to @JosKodify as I borrowed a few risk management snippets from his website: kodify.net
Best
Dave

CM_SlingShotSystem+_CassicEMA+Willams21EMA13 htc1977 editionThis strategy is a combination of 2 indicators based on EMA(actually x3 EMAs and Williams ind.
We usin this to see where EMA fast is above EMA slow(for long), entry position when price hit fast EMA and exit if trend changes or price overbought, or by stoploss 1%.
The opposite for a short position.
For better result You can change every EMA's, stoploss, Willam's ind and other visualisation in settings.
If You find good combination - please, let me know(if You want).
I will check it with ML, and attach it here.
Original indicators will write in comments

iMoku (Ichimoku Complete Tool) - The Quant Science iMoku™ is a professional all-in-one solution for the famous Ichimoku Kinko Hyo indicator.
The algorithm includes:
1. Backtesting spot
2. Visual tool
3. Auto-trading functions
With iMoku you can test four different strategies.
Strategy 1: Cross Tenkan Sen - Kijun Sen
A long position is opened with 100% of the invested capital ($1000) when "Tenkan Sen" crossover "Kijun Sen".
Closing the long position on the opposite condition.
There are 3 different strength signals for this strategy: weak, normal, strong.
Weak : the signal is weak when the condition is true and the price is above the 'Kumo'
Normal : the signal is normal when the condition is true and the price is within the 'Kumo'
Strong : the signal is strong when the condition is true and the price is below the 'Kumo'
Strategy 2: Cross Price - Kijun Sen
A long position is opened with 100% of the invested capital ($1000) when the price crossover the 'Kijun Sen'.
Closing the long position on the opposite condition.
There are 3 different strength signals for this strategy: weak, normal, strong.
Weak : the signal is weak when the condition is true and the price is above the 'Kumo'
Normal : the signal is normal when the condition is true and the price is inside the 'Kumo'
Strong : the signal is strong when the condition is true and the price is below the 'Kumo'
Strategy 3: Kumo Breakout
A long position is opened with 100% of the invested capital ($1000) when the price breakup the 'Kumo'.
Closing the long position with a percentage stop loss and take profit on the invested capital.
Strategy 4: Kumo Twist
A long position is opened with 100% of the invested capital ($1000) when the 'Kumo' goes from negative to positive (called "Twist").
Closing the long position on the opposite condition.
There are 2 different strength signals for this strategy: weak, and strong.
Weak : the signal is weak when the condition is true and the price is above the 'Kumo'
Strong : the signal is strong when the condition is true and the price is below the 'Kumo'
This script is compliant with algorithmic trading.
You can use this script with trading terminals such as 3Commas or CryptoHopper. Connecting this script is very easy.
1. Enter the user interface
2. Select and activate a strategy
3. Copy your bot's links into the dedicated fields
4. Create and activate alert
Disclaimer: algorithmic trading involves risk, the user should consider aspects such as slippage, liquidity and costs when evaluating an asset. The Quant Science is not responsible for any kind of damage resulting from use of this script. By using this script you take all the responsibilities and risks.

50 Pips A Day Strategy - Kaspricci50 Pips A Day Strategy
This strategy is designed to work on 1 hour timeframe. It is designed to capture the early market move of major forex pairs like EURUSD or GBPUSD. It takes the high and low of the first candle (7 a.m. GMT, London Stock Exchange opens) and places to pending orders at these prices levels.
High + additional gap in pips = buy stop pending order
Low + additional gap in pips = sell stop pending order
For both orders a stop loss of 15 pips and a take profit of 50 pips is used as a default. As soon as price triggers one pending order, the remaining pending order is cancelled. At the end of the configured session time all open and pending orders are closed / cancelled.
Settings
Trading Time - start and end time of session. It is configured for Monday to Friday only. At the beginning the first candle is used to define stop prices for pending orders.
Source for Buy Stop order - Default: high. Used to calculate buy stop order. You can add additional pips as a gap.
Source for Sell Stop order - Default: low. Used to calculate sell stop order. You can add additional pips as a gap.
Stop Loss in Pips - Default: 15. Used for both pending orders.
Take Profit in Pips - Default: 50. Used for both pending orders.
This strategy is for educational purposes only! It is not meant to be a financial recommendation.

Multi Trend Cross Strategy TemplateToday I am sharing with the community trend cross strategy template that incorporates any combination of over 20 built in indicators. Some of these indicators are in the Pine library, and some have been custom coded and contributed over time by the beloved Pine Coder community. Identifying a trend cross is a common trend following strategy and a common custom-code request from the community. Using this template, users can now select from over 400 different potential trend combinations and setup alerts without any custom coding required. This Multi-Trend cross template has a very inclusive library of trend calculations/indicators built-in, and will plot any of the 20+ indicators/trends that you can select in the settings.
How it works : Simple trend cross strategies go long when the fast trend crosses over the slow trend, and/or go short when the fast trend crosses under the slow trend. Options for either trend direction are built-in to this strategy template. The script is also coded in a way that allows you to enable/modify pyramid settings and scale into a position over time after a trend has crossed.
Use cases : These types of strategies can reduce the volatility of returns and can help avoid large market downswings. For instance, those running a longer term trend-cross strategy may have not realized half the down swing of the bear markets or crashes in 02', 08', 20', etc. However, in other years, they may have exited the market from time to time at unfavorable points that didn't end up being a down turn, or at times the market was ranging sideways. Some also use them to reduce volatility and then add leverage to attempt to beat buy/hold of the underlying asset within an acceptable drawdown threshold.
Special thanks to @Duyck, @everget, @KivancOzbilgic and @LazyBear for coding and contributing earlier versions of some of these custom indicators in Pine.
This script incorporates all of the following indicators. Each of them can be selected and modified from within the indicator settings:
ALMA - Arnaud Legoux Moving Average
DEMA - Double Exponential Moving Average
DSMA - Deviation Scaled Moving Average - Contributed by Everget
EMA - Exponential Moving Average
HMA - Hull Moving Average
JMA - Jurik Moving Average - Contributed by Everget
KAMA - Kaufman's Adaptive Moving Average - Contributed by Everget
LSMA - Linear Regression , Least Squares Moving Average
RMA - Relative Moving Average
SMA - Simple Moving Average
SMMA - Smoothed Moving Average
Price Source - Plotted based on source selection
TEMA - Triple Exponential Moving Average
TMA - Triangular Moving Average
VAMA - Volume Adjusted Moving Average - Contributed by Duyck
VIDYA - Variable Index Dynamic Average - Contributed by KivancOzbilgic
VMA - Variable Moving Average - Contributed by LazyBear
VWMA - Volume Weighted Moving Average
WMA - Weighted Moving Average
WWMA - Welles Wilder's Moving Average
ZLEMA - Zero Lag Exponential Moving Average - Contributed by KivancOzbilgic
Disclaimer : This is not financial advice. Open-source scripts I publish in the community are largely meant to spark ideas that can be used as building blocks for part of a more robust trade management strategy. If you would like to implement a version of any script, I would recommend making significant additions/modifications to the strategy & risk management functions. If you don’t know how to program in Pine, then hire a Pine-coder. We can help!

Power Of Stocks - Bollinger Band & 5Ema Indicator - Keanu_RiTz
Power of Stocks - Bollinger band & 5ema Strategy
In this script you get to take Buy/Sell trades using the 3 options mentioned below.(Alerts with price levels for buy/sell at , SL & Target are included in this one)
1. Combined Strategy :- uses confirmation from both strategies to trade.
2. Bollinger band Strategy :- use the Bollinger band Strategy to trade.
3. 5ema Strategy :- use the 5ema Strategy to trade.
1. Combined Strategy :-
for Selling :- we will go short/sell only when conditions of both strategies are satisfied.
i.e. when a candle is completely above the upper Bollinger band & completely above the 5ema then it will be our Alert Candle.
We Short/Sell only when the low of the Alert candle is broken or when the candle closes below the close of the Alert Candle.
SL will be above high of the Alert Candle. Target will be minimum 1:3 or as per your emotions.
for Buying:- we will go Long/Buy only when conditions of both strategies are satisfied.
i.e. when a candle is completely below the lower Bollinger band & completely below the 5ema then it will be our Alert Candle.
We go Long/Buy only when the high of the Alert candle is broken or when the candle closes above the close of the Alert Candle.
SL will be below low of the Alert Candle. Target will be minimum 1:3 or as per your emotions.
2. Power of Stocks - Bollinger Band Strategy :-
Bollinger band with standard deviation = 1.5
when a candle is completely above the upper Bollinger band, that candle will be called a signal/alert candle.
Initiate a Sell trade when that alert candles low is broken. SL will be above high of that alert candle.
Risk to reward ratio will be 1:4 i.e. target will be 4 times the SL.
when a candle is completely below the lower Bollinger band, that candle will be called a signal/alert candle.
Initiate a Buy trade when that alert candles high is broken. SL will be below low of that alert candle.
Risk to reward ratio will be 1:4 i.e. target will be 4 times the SL.
other rules for Options buying:- minimum 15min timeframe
The day you initiate the position , you should be in profit above 10%-15% then only you should carry forward that position overnight, otherwise squareoff your trade on that day only.
Buy ATM or slightly OTM, SL max 100 points , target 1:4
for Long-term/Investing :- Minimum Weekly
If candle is outside the lower band then initiate a Buy trade when that candles High is broken. Sl will be below Low of that candle.
for Long-term Target will be according to your emotions.
3. Power of Stocks - 5ema Strategy (target minimum 1:3)
Timeframe -
5 min for Selling (Sell Futures/index/stocks or buy Put)
15 min for Buying (Buy Futures/index/stocks or sell Put)
for selling stocks :-
you should enter trade within 10am , don't look for entries after that time. take only 2 entries a day.
for selling Index(Banknifty) :-
you can take trade at anytime of the day whenever conditions get satisfied. you can take multiple entries in banknifty as it is very volatile.
for options choose atm strikes: selling trade
sl for premium between 200-300 :- 20-30 points SL
sl for premium between 400-500 :- 40-50 points SL
sl for premium between 500-600 :- 50-60 points SL
Subhashish Pani's (power of stocks) 5 EMA Strategy:-
It plots 5 EMA and Buy/Sell signals with Target & Stoploss levels.
What is Subhashish Pani's (power of stocks) 5 EMA Strategy :-
His strategy is very simple to understand. for intraday use 5 minutes timeframe for selling. You can sell futures, sell call or buy Puts in selling strategy.
What this strategy tries to do is , it tries to catch the tops, so when you sell at top & it turns out to be a reversal point then you can get good profit.
this will hit stop losses often, but stop losses are small and minimum target should be 1:3. but if you stay with the trend you can get big profits.
According to Subhashish Pani this strategy has 60% success rate.
Strategy for Selling (Short future/Call/stock or buy Put)
When ever a Candle closes completely above 5 ema (no part of candle should be touching the 5ema), then that candle should be considered as Alert Candle.
If the next candle is also completely above 5 ema and it has not broken the low of previous alert candle, Then the previous Alert Candle should be ignored and the new candle should be considered as new Alert Candle.
so if this goes on then continue shifting the Alert Candle, but whenever the next candle breaks the low of the Alert Candle we should take the Short trade (Short future/Call/stock or buy Put).
Stoploss will be above high of the Alert Candle and minimum target will be 1:3.
Strategy for Buying (Buy future/Call/stock or sell Put)
When ever a Candle closes completely below 5 ema (no part of candle should be touching the 5ema), then that candle should be considered as Alert Candle.
If the next candle is also completely below 5 ema and it has not broken the high of previous alert candle, Then the previous Alert Candle should be ignored and the new candle should be considered as new Alert Candle.
so if this goes on then continue shifting the Alert Candle, but whenever the next candle breaks the high of the Alert Candle we should take the Long trade (Buy future/Call/stock or sell Put).
Stoploss will be below low of the Alert Candle and minimum target will be 1:3.
Buy/Sell with extra conditions :
it just adds 1 more condition to buying/selling
1. checks if closing of current candle is lower than alert candles closing for Selling & checks if closing of current candle is higher than alert candles closing for Buyling.
This can sometimes save you from false moves but by using this, you can also miss out on big moves as you'll enter trade after candle closing instead of entering at break of high/low.
Note :- According to Subhashish Pani Timeframe for intraday buying should be 15 minutes Timeframe.
If you haven't understood the strategy by reading above description, then search for "Subhashish Pani's (power of stocks) 5 EMA Strategy" on YouTube to get a deeper understanding.
Note:- This is not only for Intraday trading , you can use this strategy for Positional/Swing trading as well. If you use this on Monthly Timeframe then it can be very good for Long Term Investing as well.
Rules will be same for all types of trades & Timeframes.

SpreadTrade - Auto-Cointegration (ps5)Decsription: Auto-Cointegration-Based Pair Trading Strategy (revised version)
To review, there are three popular styles of Pair trading: distance-based pair trading, correlation-based pair trading and cointegration-based pair trading. Typically, they require preliminary statistical estimation of the viability of the corresponding strategy.
Basically a pair trade strategy boils down to shorting the outperforming instrument and going long on the underperforming instrument whenever the temporary correlation weakens which means one instrument is going up and another is going down. Apart from the typical cointegration strategy which employs two cointegrated instruments, this script uses just one instrument, in base timeframe and in lagged timeframe, actually making it an auto-cointegration, or better still, an auto-correlation strategy.
Notice that each moving average function may require different Threshold settings.The orange cross symbol indicates the exit points. To filter out the signals use higher values for the LongWindow and the Threshold parameters. Also pay attention that in some cases with some moving averages the color of the signals has to be inverted.