Vix FIX / Stochastic Weights StrategyThis script is based off of Chris Moody's Vix Fix Indicator modified by OskarGallard and BigBitsIO's Stochastic Weights.
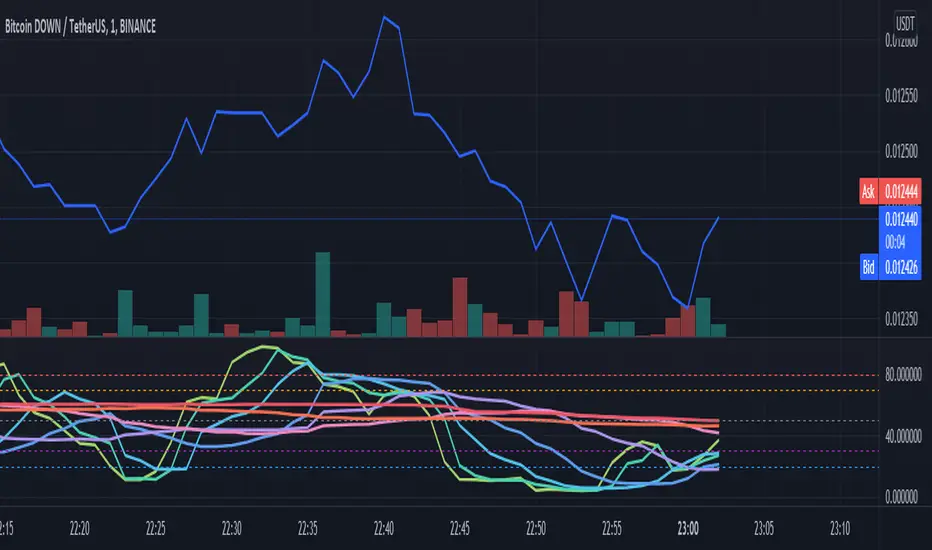
This script is a compilation of several different stochastic indicators (and RSI ) where the K value of each indicator is equally weighted. The purpose of the indicator is to combine many indicators together in a fashion that weights them easier. By default, the Stochastic and Stochastic RSI are both enabled - the idea is to speed up the relatively slower Stochastic and to slow down the relatively fast Stochastic RSI . BigBitsIO's Stochastics are also available that can also be added to the weighted calculation. Only the K value is weighted, as the D value is just a moving average of the weighted K.
- Why is this modifed stochastic useful?
- To weight multiple indicators together so that you can attempt to find optimal values shared amongst the indicators. Ex: If Stochastic RSI is 100 and Stochastic is 50, K would be 75 and not particularly high. If you add in a 50 RSI , the K would be 67 in this example. If we weight indicators together that all have a high value they could potentially help find elements that align together to produce a stronger signal.
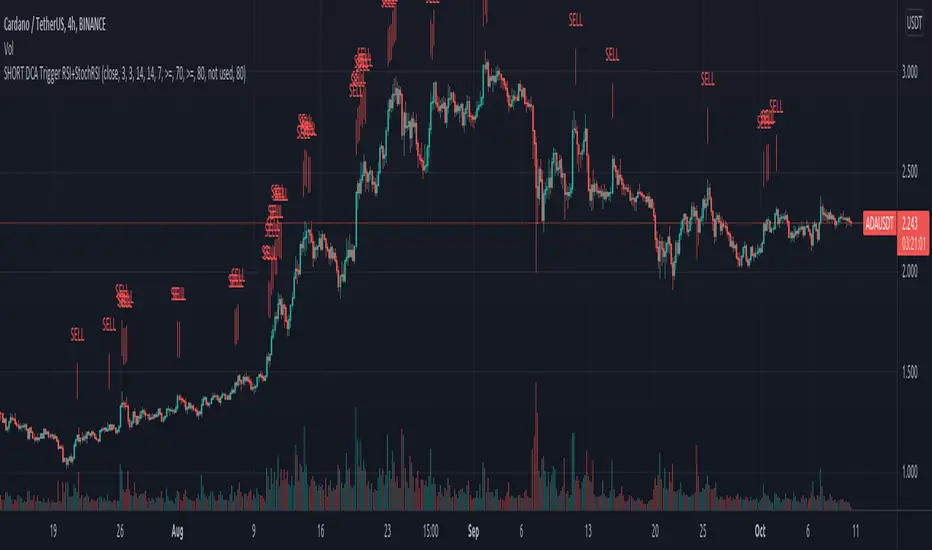
In this script we have the red "S" triangles which are Exits (overbought stochastic crosses).
Added alerts for stochastic exit signals. Alerts are Pre-Set to only Alert on Bar Close.
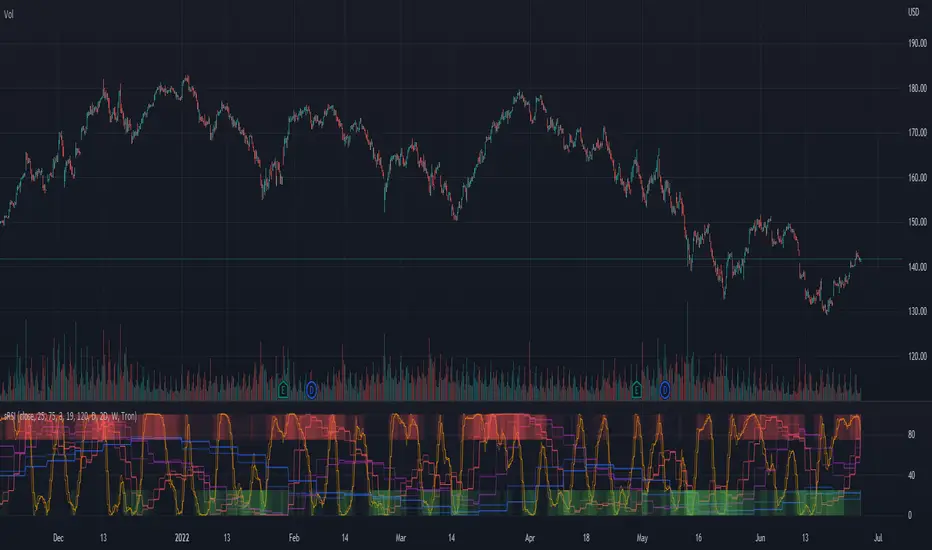
The "Williams Vix Fix" is one of the most reliable indicators in history for finding market bottoms. The Vix Fix is simply a code from Larry Williams creating almost identical results for creating the same ability the Vix has to all assets.
The VIX has always been much better at signaling bottoms than tops. Simple reason is when market falls retail traders panic and increase volatility , and professionals come in and capitalize on the situation. At market tops there is no one panicking... just liquidity drying up.
The FE green triangles are "Filtered Entries".
The AE green triangles are "Aggressive Filtered Entries".
Added Alerts to Williams Vix Fix (Aggressive Entry and Filtered Entry). Alerts are Pre-Set to only Alert on Bar Close.
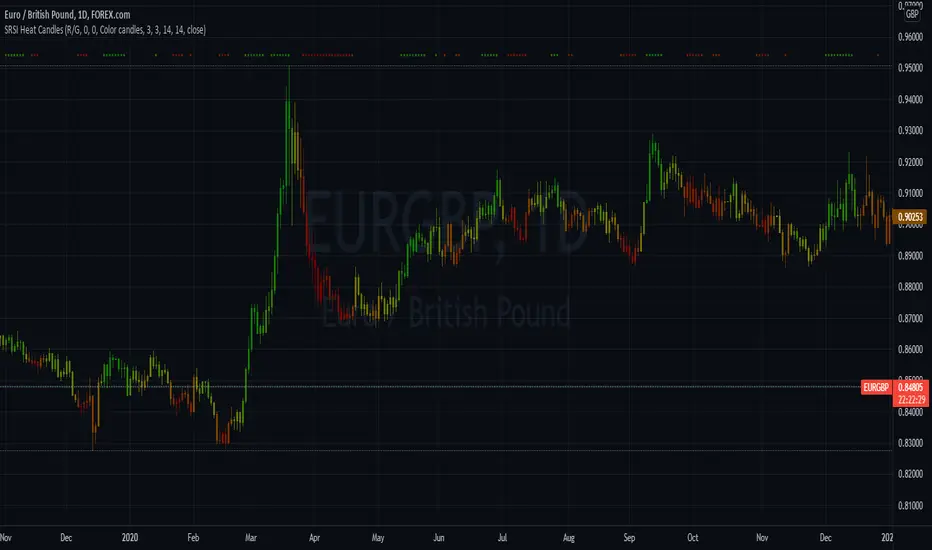
Added "Ehlrers StochCCI" indicator of user @glaz
The Ehlrers StochCCI is a variation of Ehlers Stochastic RSI replaced with CCI.
The John Ehlers' article in August, 2006, "Modeling The Market = Building Trading Strategies," describes a process for extracting trend and cyclic elements from market data, then recombining them for trading purposes. He used the Stochastic RSI denoted the cyclic elements.
Added ability to show Dots when StochCCI Crosses.
Sell: fuchsia dots.
Buy: green dots.
Added alerts for (Buy / Sell) StochCCI. Alerts are Pre-Set to only Alert on Bar Close.
DISCLAIMER: For educational and entertainment purposes only. Nothing in this content should be interpreted as financial advice or a recommendation to buy or sell any sort of security or investment including all types of crypto. DYOR, TYOB.
Indicador Pine Script®