Média Móvel Simples (MMS)

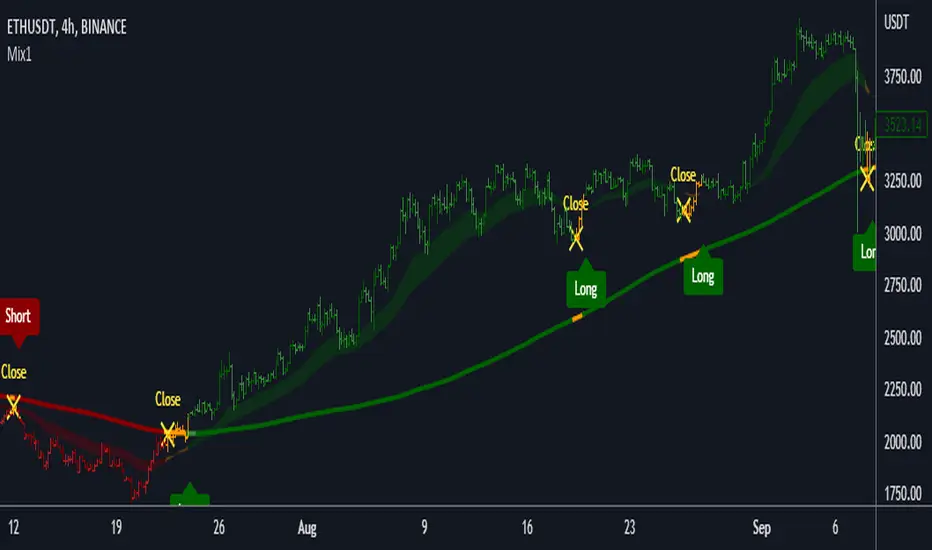
Mix1 : Ema Cross + Trend Channel [Gu5]Based on Trend Channel
Ema-crossover is added
Crossing alerts, only on trend
Basado en mi anterior indicador, Trend Channel
Se agrega Cruce de Medias Moviles (Ema-crossover)
Las alertas solo son en favor a la tendencia
El valor de SMA Range es arbitrario (No Backtesting). Cambia la amplitud de canal que determina cuando es rango (barras amarillas por estar muy cerca del SMA200, sin tendencia definida)
Range Multiplier adapta el indicador a distintos mercados
//Setting recommended for SMA Range
//BTCUSD = 100
//EURUSD = 1000
//SPX = 100
//ETHUSD = 10
Si te fue útil este indicador, puedes comprarme una cerveza ;)

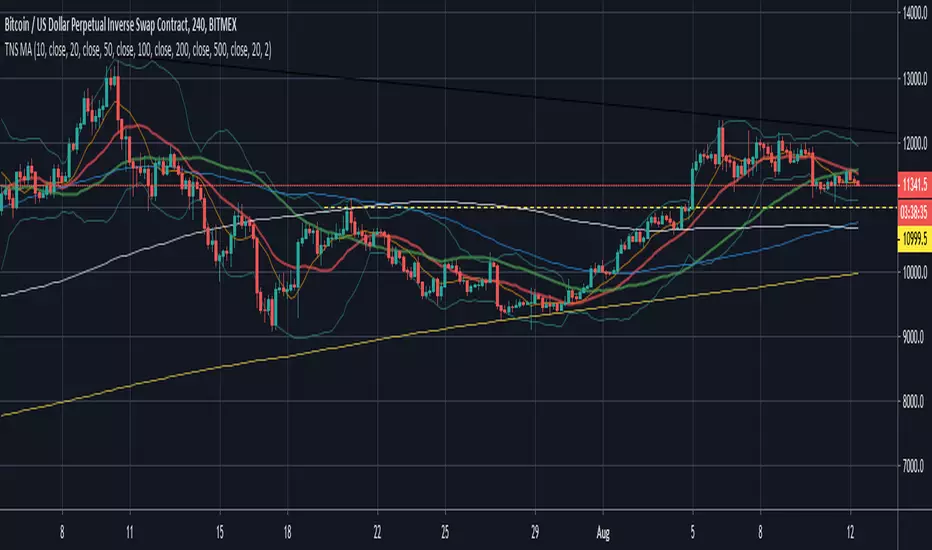
M&Ms - Multiple Moving AveragesThe (M&Ms) Multiple Moving Average Crossing allows the investor identify trends in different time frames and indicates when to entry short or long.

Highly Optimized (Aroon, DMI, RWI)It is a highly optimized script for H4, D1. Backtests from (2016 - 2019, depending on the currency pair). Optimization still
going on.
Following alerts can be activated:
-
Buy-Signal (Baseline-Cross)!
Sell-Signal (Baseline-Cross)!
Buy Signal (Aroon)!
Sell Signal (Aroon)!
Buy Signal (DMI)!
Sell Signal (DMI)!
Buy Signal (RWI)!
Sell Signal (RWI)!
Can be used by the following pairs:
AUDCAD
AUDCHF
AUDJPY
AUDNZD
AUDSGD
AUDUSD
CADCHF
CADJPY
CHFJPY
CHFSGD
EURAUD
EURCAD
EURCHF
EURGBP
EURJPY
EURNZD
EURSGD
EURTRY
EURUSD
GBPAUD
GBPCAD
GBPCHF
GBPJPY
GBPNZD
GBPSGD
GBPUSD
NZDCAD
NZDCHF
NZDJPY
NZDUSD
SEKJPY
SGDJPY
USDCAD
USDCHF
USDCNH
USDJPY
USDSGD
USDTRY
XRPUSD
Price is 5€ per Month or 75€ lifetime. One week free for testing.

Golden Cross by -Westy-Quick Guide
- Yellow cross and green MA on top = Potential uptrend
- Yellow cross and red MA on top = Potential downtrend
A simple golden cross indicator of the green 50 and red 200 SMA with a yellow cross for ease of visibility and backtesting.
Generally, longer time frames more powerful signals but are less frequent. I typically use it on the 4 hour, daily and weekly.

Trend Channel [Gu5]SMA 200 determines the trend
Bullish trend, green candles. Down trend, red candles.
If the market value is narrow to the SMA200 channel, yellow candles.
Setting recommended for SMA Range
BTCUSD = 100
EURUSD = 1000
SPX = 100
ETHUSD = 10

Triple Moving Average HeatmapHi everyone
I didn't publish on Friday because I was working on an Expert Advisor in MT4. The day I don't publish, some scripts spamming guys published many (not useful) scripts the same to kick me out of the TOP #1 ranking.
So what I'm going to do about it? crying or sharing more quality scripts than before? :)
I guess you know the answer :) I'm gonna share a few quality scripts that I have in my library. I noticed that you guys tend to like more the scripts useful for your trading actually making you money rather than a copy-paste (of another copy-paste)
Alright, enough for the trolling now let's introduce the Three MA heatmap which is an upgrade of that script : MA-heatmap-Double-cross-edition/
The challenge was to keep the heatmap not rolling and to make it match with the MA cross. I did it using this
```
since_ma_buy = barssince(macrossover)
since_ma_sell = barssince(macrossunder)
heatmap_color() =>
since_ma_buy < since_ma_sell ? color.new(color.green, 20) : since_ma_buy > since_ma_sell ? color.new(color.red, 20) : na
```
This is a technique that I found after drinking three glasses of red wine (#french) to keep the heatmap stable and not rolling.
To get what I'm saying I invite you to replace the piece of code above by what everyone would normally do
```
heatmap_color() =>
macrossunder() ? color.new(color.green, 20) : macrossover() ? color.new(color.red, 20) : na
```
Ah and I'm not done sharing for the day, a few scripts are coming also after that one and tonight !!!!! I want to live in a world where you guys can enjoy quality scripts (mostly) :)
PS
____________________________________________________________
Feel free to hit the thumbs up as it shows me that I'm not doing this for nothing and will motivate to deliver more quality content in the future.
- I'm an officially approved PineEditor/LUA/MT4 approved mentor on codementor. You can request a coaching with me if you want and I'll teach you how to build kick-ass indicators and strategies
Jump on a 1 to 1 coaching with me
- You can also hire for a custom dev of your indicator/strategy/bot/chrome extension/python

MAJESTIC {SMA}The thickest blue line is the Momentum oscillator
The lime colored line is the Acceleration oscillator
The red colored line is the Jerk oscillator
This is the {SMA} implementation.
~JuniAiko
(=^~^=)v~

Triple Moving Average & Elder ImpulseThis is an updated version of my previous Triple Moving average script.
This one plots 3 moving averages + Elder impulse system.
The user has an option to choose from EMA or SMA.
User can also choose the length and source for moving averages.
The user also has an option to turn ON/OFF the use of the Elder impulse system.
All this utilizing the space for a single indicator. This is especially helpful for free users with a limit of only 3 indicators per chart.
This way you can add the 4 above + 2 more indicators of your choice.
Hope it helps.

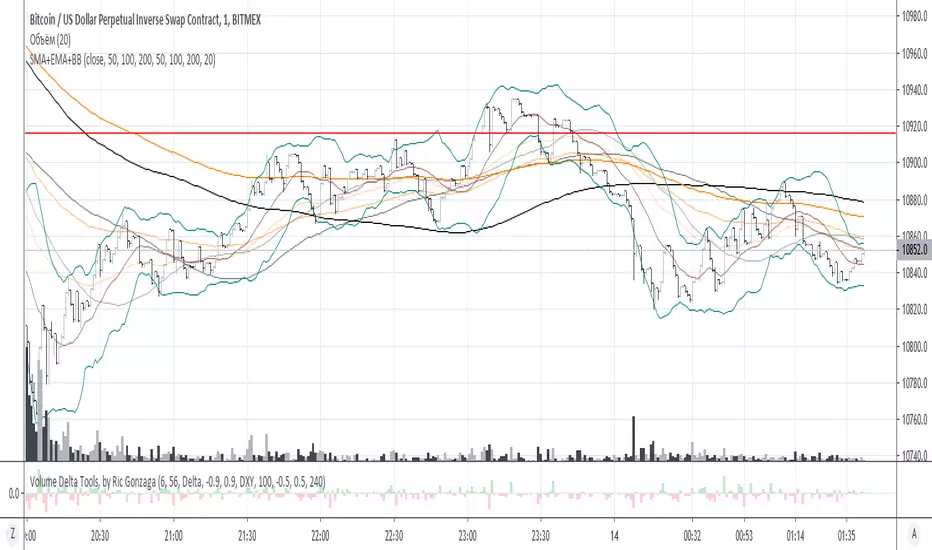
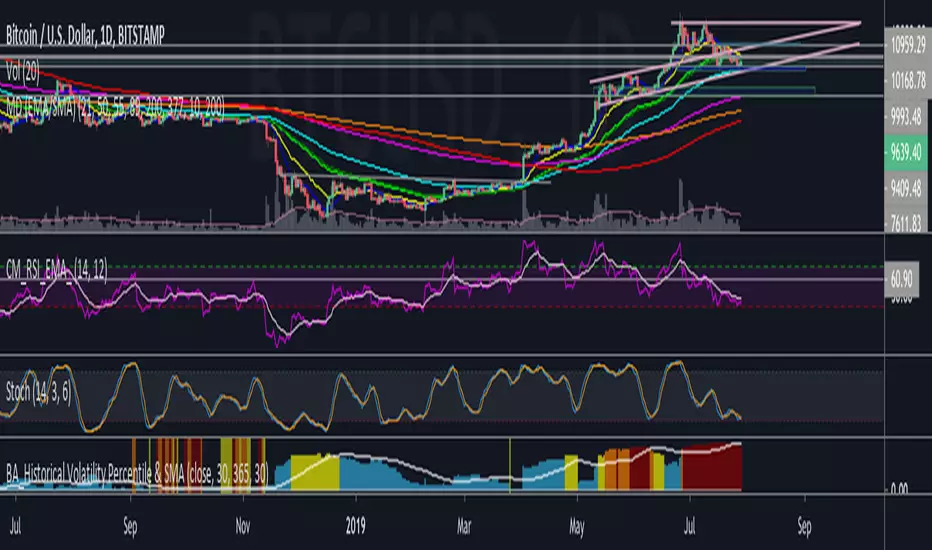
Ultimate Moving Average Package (17 MA's)Included is the:
VWAP
Current time frame 10 EMA
Current time frame 20 EMA
Current time frame 50 EMA
Current time frame 10 SMA
Current time frame 20 SMA
Current time frame 50 SMA
Daily 10 EMA
Daily 20 EMA
Daily 50 EMA
Daily 50 SMA
Daily 100 SMA
Daily 200 SMA
Weekly 100 SMA
Weekly 200 SMA
Monthly 100 SMA
Monthly 200 SMA
All Daily/Weekly/Monthly MA's can be seen on intraday charts. Current time frame MA's change depending on your time frame. Obviously you dont need all 17 on your chart but you can pick the ones you like and disable the rest.

ck - 10 MA Combo (5 EMAs, 5 SMAs)Yet another MA and EMA indicator.
These are my favourite presets & colour combos for Tradingview Dark Theme.
Enjoy!

Intelligent Exponential Moving Average Private AccessView the full documentation on this indicator here: www.kenzing.com
Note: This indicator is now intended for those who have been granted private access and may be more frequently updated than the previous versions.
Introduction
This indicator uses machine learning (Artificial Intelligence) to solve a real human problem.
The Exponential Moving Average ( EMA ) is one of the most used indicators on the planet, yet no one really knows what pair of exponential moving average lengths works best in combination with each other.
A reason for this is because no two EMA lengths are always going to be the best on every instrument, time-frame, and at any given point in time.
The " Intelligent Exponential Moving Average " solves the moving average problem by adapting the period length to match the most profitable combination of exponential moving averages in real time.
How does the Intelligent Exponential Moving Average work?
The artificial intelligence that operates these moving average lengths was created by an algorithm that tests every single combination across the entire chart history of an instrument for maximum profitability in real-time.
No matter what happens, the combination of these exponential moving averages will be the most profitable.
Can we learn from the Intelligent Moving Average?
There are many lessons to be learned from the Intelligent EMA . Most will come with time as it is still a new concept. Adopting the usefulness of this AI will change how we perceive moving averages to work.
Limitations
Ultimately, there are no limiting factors within the range of combinations that has been programmed. The exponential moving averages will operate normally, but may change lengths in unexpected ways - maybe it knows something we don't?
Thresholds
The range of exponential moving average lengths is between 5 to 40.
Additional coverage resulted in TradingView server errors.
Future Updates!
Soon, I will be publishing tools to test the AI and visualise what moving average combination the AI is currently using.
Follow and like for more content!

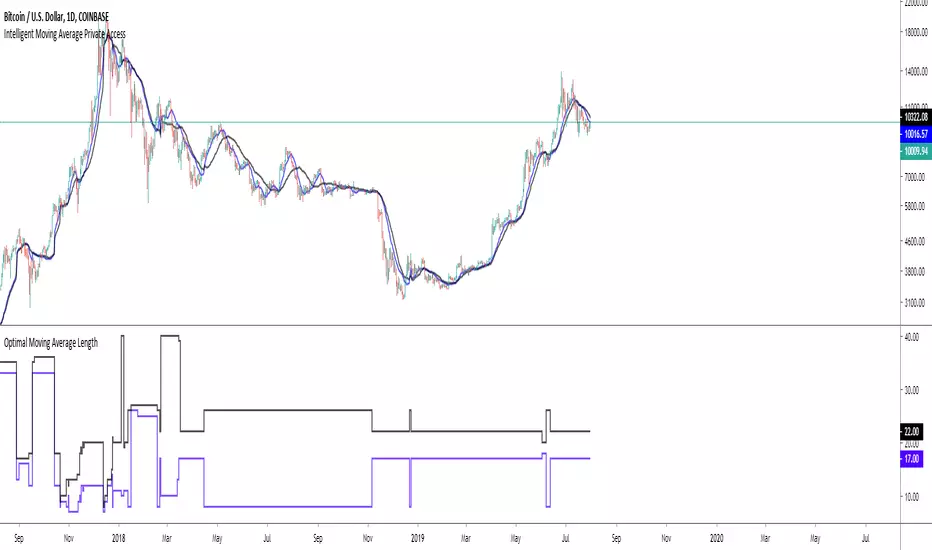
Intelligent Moving Average Private AccessNote: This indicator is intended for those who have been granted private access and may be more frequently updated than the previous versions.
Introduction
This indicator uses machine learning (Artificial Intelligence) to solve a real human problem.
The Moving Average is the most used indicator on the planet, yet no one really knows what pair of moving average lengths works best in combination with each other.
A reason for this is because no two moving averages are always going to be the best on every instrument, time-frame, and at any given point in time.
The " Intelligent Moving Average " solves the moving average problem by adapting the period length to match the most profitable combination of moving averages in real time.
How does the Intelligent Moving Average work?
The artificial intelligence that operates these moving average lengths was created by an algorithm that tests every single combination across the entire chart history of an instrument for maximum profitability in real-time.
No matter what happens, the combination of these moving averages will be the most profitable.
Can we learn from the Intelligent Moving Average?
There are many lessons to be learned from the Intelligent Moving Average. Most will come with time as it is still a new concept.
Adopting the usefulness of this AI will change how we perceive moving averages to work.
Limitations
Ultimately, there are no limiting factors within the range of combinations that has been programmed. The moving averages will operate normally, but may change lengths in unexpected ways - maybe it knows something we don't?
Thresholds
The range of moving average lengths is between 5 to 40.
Additional coverage resulted in TradingView server errors.
Future Updates!
This indicator will be maintained and many updates will come in the near future! Stay tuned.
View the documentation on this indicator here: www.kenzing.com
Triple Moving AverageSimple indicator combining up to three moving averages. Uses simple moving average (SMA) and exponential moving average (EMA).

Dual Moving AverageBasic dual moving average indicator supporting both simple moving average (SMA) and exponential moving average (EMA).

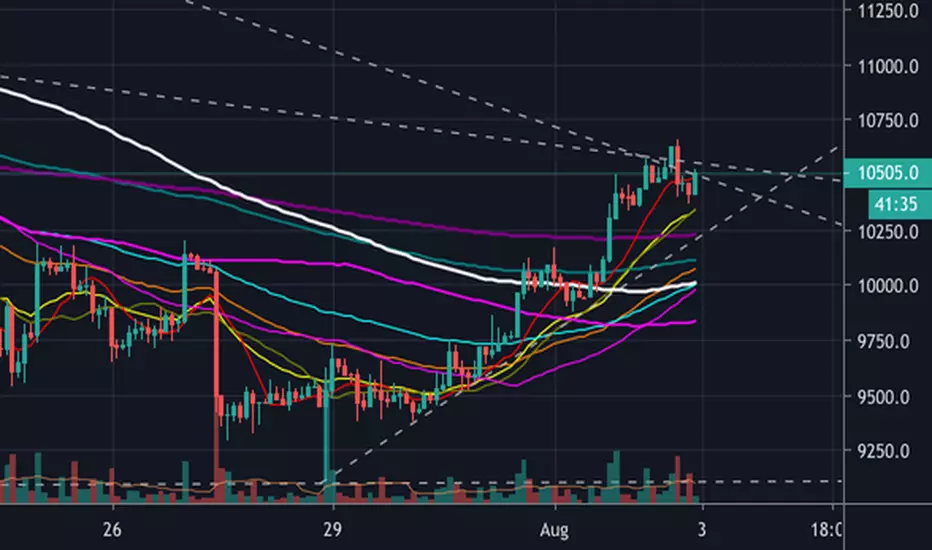
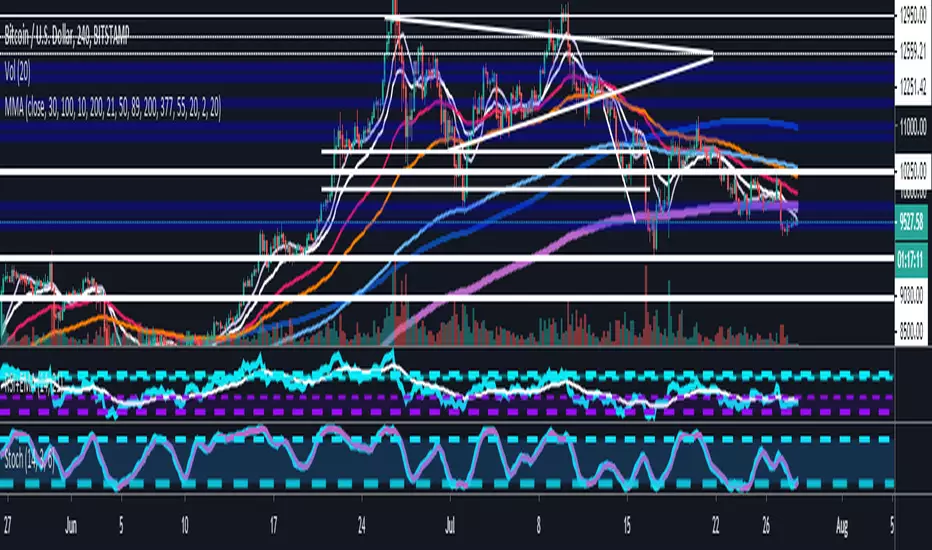
Multiple Moving AveragesThis is an indicator with 4 moving average slots and 6 exponential moving average slots
It also has bollinger bands and a volume weighted moving average slot
Feel free to edit this and add/remove some and publish your own
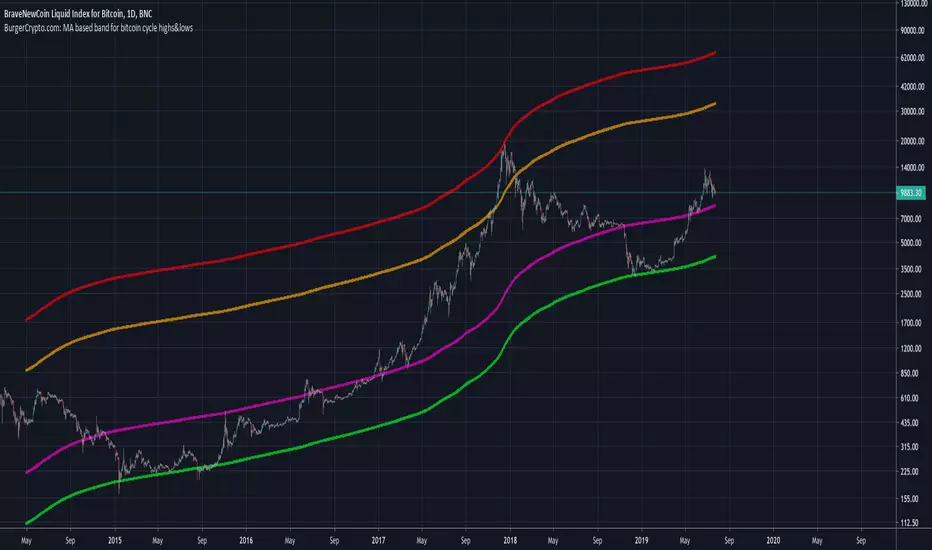
BurgerCrypto.com: MA based band for bitcoin cycle highs&lowsWarning: This script works only on a daily chart and only works for bitcoin charts with a long history. Best to be used on the BLX chart as it goes back to July 2010.
This script shows you the Moving Average with the length of a full bitcoin cycle, in which a cycle is defined as a period between two reward halvings; i.e. 210.000 blocks.
After data analysis in Python, I found that the average inter arrival time is a bit lower than the often communicated 10minutes; it's 9.46minutes, which makes the 210.000 block interval equal to 1379days.
The 1379d Moving Average seems to serve well as a support for the price of bitcoin over time and it's 4th 2^n multiple did a good job in catching the cycle tops.
If you like this indicator, please leave some claps for the Medium article in which I introduced this indicator:
medium.com
EMA / SMA MultiCombo 3.0 All the moving averages you'll ever need!!!
5 EMAs
5 SMAs
3 static EMAs
3 static SMAs
Static EMAs and SMAs are shown on every timeframe. For example, you can set static EMAs or SMAs to show 21 day EMA on 1 hour chart or for example 50 week SMA on 1 day chart, or 200 4 hour EMA on 5 minute chart and so on, possibilities are endless!!! Plus standard 5 EMAs and 5 SMAs (user-defined) are showing for specific chosen timeframe. No need to show them all, just check how many you want.
