Moving Averages DifferenceSimple indicator for crossing moving averages to identify trend and adjust bias
Sellsignal
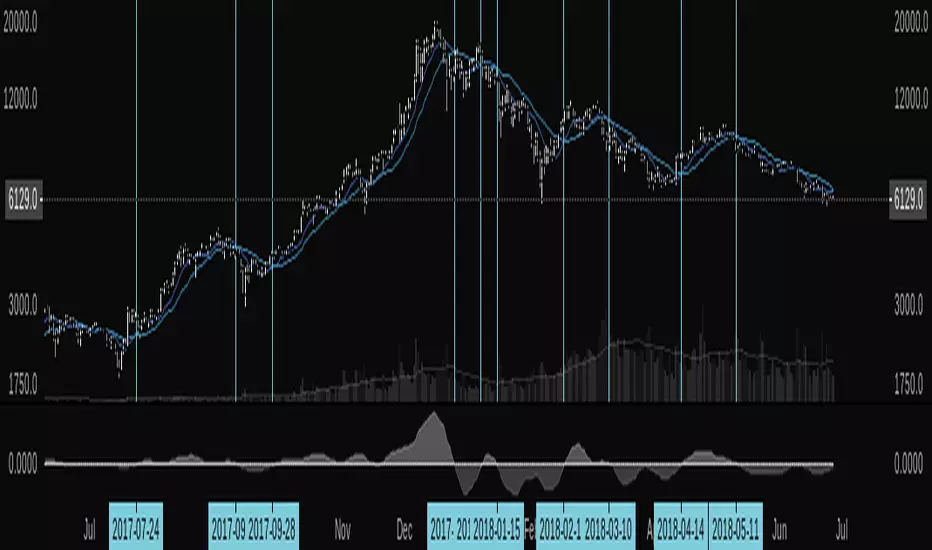
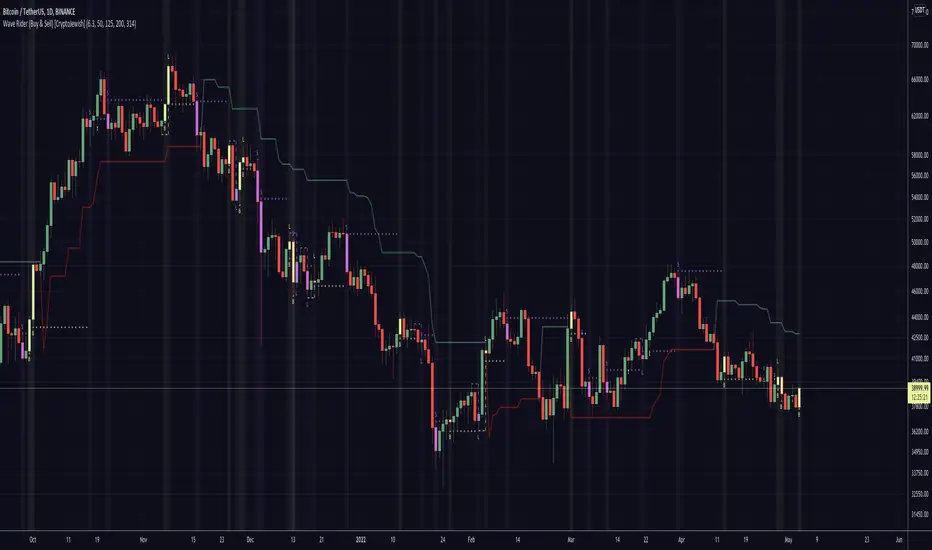
TPA BTC INDEX COLOR only for BTC/Legal currency, 4H(240min)TPA BTC INDEX COLOR only for BTC/Legal currency, 4H(240min)
또땃 비트 인덱스컬러 (BTCUSD나 KRW용)
Because we use Google Translator, translation may not be smooth.
------------------------------------------------
1.단기존 (Short term zone)
라임색에 줍고 주황~빨간색에 턴다.
빨강->라임 또는 라임->빨강 손에서는 주의한다.
알트존이 초록불일때는 단기존이 초록일때 줍지만 알트존이 붉은색으로 변하면 빨리 털거나 단기존이 주황~빨강쯤 왔을때 턴다
Pick it up in lime and sell it in orange to red.
Be careful in the red - > lime or lime - > red section.
When alt zone is a green light, pick it up when it is green. When Alt Zone turns red, it sells quickly or when it comes to orange or red.
------------------------------------------------
2.알트존 (Alt zone)
알트코인 투자시 급락 가능성이 적고 상방추세를 탔을때 투자를하기 위해서는 알트존이 초록불일때 투자를 하면 된다.
There is little possibility of a sharp drop in investment when investing in alt coins, and investment can be made when Alt Zone is green.
------------------------------------------------
3.계절 존(Season zone)
계절존이 초록색(여름)이면 향후 상방을 향해 갈 확률이 높은 상황이다.
적색이면 하락할 확률이 전체적으로 높다.방어적 투자할것
If the zone is green (summer), chances are high that it will move upward.
There is a high overall probability of falling in red.We need defensive investment.
------------------------------------------------
4.광기장 고점파악용(Madness zone)
광기장 판단은 장기존이 붉은색인체로 지속될때 광기장으로 명한다. 해당 구간은 급격한상승 하락이 있으므로(퍼센티지상)
4번라인의 색이 붉게 되면 매도한다. 옅은 주황이나 연두에 줍고 해당라인이 붉게된 근처에서 설거지 파동에 매도를 하면 된다.
The decision to determine whether " Madness Zone " is to be made by longtermzone as the continuation of red. Because of the sharp decline in the corresponding section, sell the fourth line when it turns red. You can pick it up in light orange or green tea and sell it on last waves near the line.
------------------------------------------------
5.장기존(long term zone)
저점매수하기 좋은 라인은 초록색으로 매도가 인접하면 붉은색으로 표기된다.
A good line to buy a low point is green, and if a sell is adjacent, it is marked red.
------------------------------------------------
Only for BTC/ Chart(4h, 240min)
알트존,계절존 모두 녹색인 구간에서 투자하는게 가장 안전하다.
계절존이 붉은데 알트존이 초록이라면 보험용 금액을 만들어라.
계절존이 초록인데 알트존이 붉은 색 이라면 단기존이 초록일때 주워라.
It is safest to invest in green zone, alt zone and season zone.
If the season zone is red and the alt zone is green, make an insurance premium.
If the season zone is green and the alt zone is red, pick it up when the original is green.
------------------------------------------------
업그레이드 예정:
색 변경시 알람 컨디션.
알트코인 차트를 켜도 TPA BTC INDEX COLOR 를 사용할수 있게 하는 기능.
Upcoming upgrade:
Alarm condition when color change.
Ability to use TPA BTC INDEX COLOR even when turning on an Altcoin chart.

RSI-MTF-Histo-EntryThis indicator gives a histogram of RSI in relation to an ema of the RSI.
The histogram is then smoothed to reduce false signals.
The actualiteit RSI line with overbought/overvols signals can be added or omitted as preferred.
The background can be color coded if the RSI is above or below 50.
Version 2. Added support for MTF. Longer timesframes (1h-3h) tend to give better entry results.
As an example the indicator was added two times, one for the current timeframe and one for a longer timeframe.


Trend Continuation FactorTrend Continuation Factor indicator script.
This indicator was originally developed by M.H. Pee (Stocks & Commodities V. 20:3 (58-64): Trend Continuation Factor).

RSI-Histo-Entry_JDThis indicator shows a histogram of the RSI in relation to an ema of the RSI.
The histogram is then smoothed to give early reversal/entry signals.
The actual RSI line with oversold/overbought indication can be displayed or omitted, as preferred.
In addiction to the RSI line or as an alternative to it, the background colour can be set to change folowing the RSI signals.
JD.

VJ_Volume_Longs_Shorts_IndicatorThe indicator is based on the real-time volume in the market, Macd and Bollinger Band.
Green Bars in the histogram indicate high buy volume and prospective long position
Gray Bars indicate low volume and no trade zone
Red Bars indicate high sell volume and prospective short position
Best used with Bitcoin.
Could use this indicator along with your favorite indicator to get to know the direction of the market with respect to volume and since this is a script, you can set alerts too.
Happy Trading

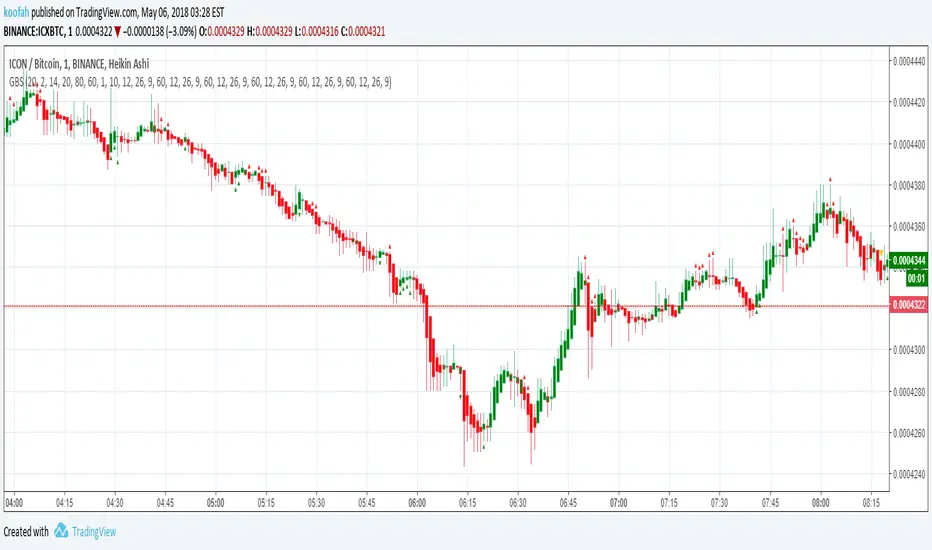
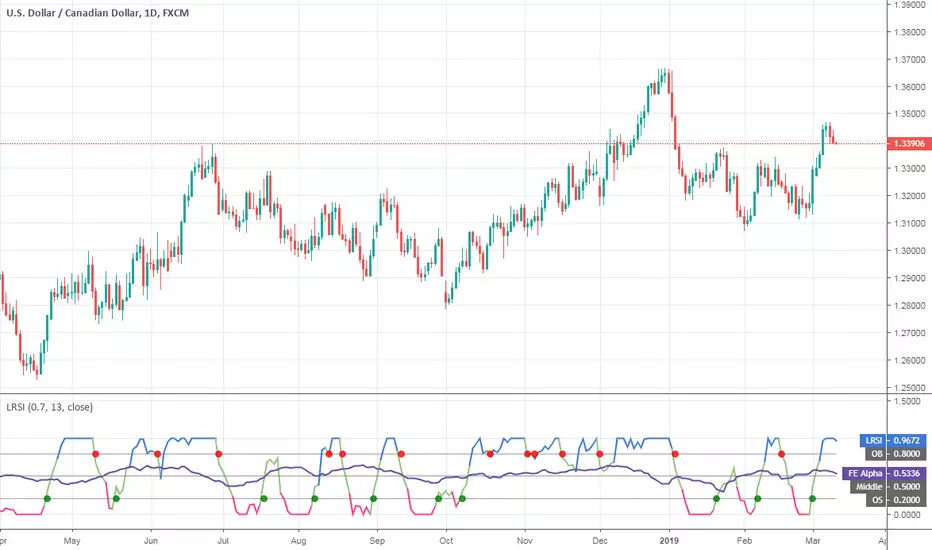
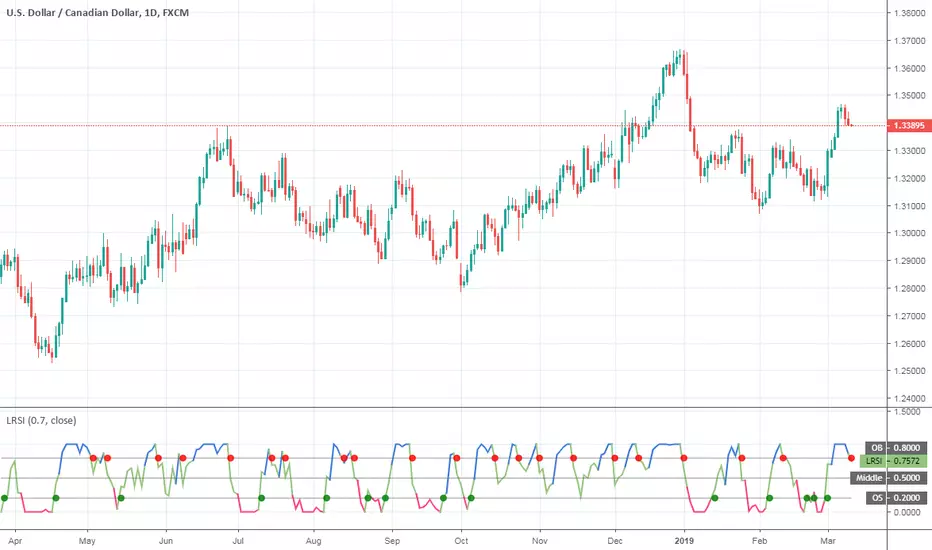
Laguerre RSI (Self Adjusting Alpha with Fractals Energy)Laguerre RSI (Self Adjusting Alpha with Fractals Energy) indicator script. I adopted idea from www.prorealcode.com and
If you disable `Apply Fractals Energy` option, you will get the original Laguerre RSI.
SMMA Analyses - Buy / Sell signals and close position signals This script combines the usage of the SMMA indicator in order to provide signals for opening and closing trades, either buy or sell signals.
It uses two SMMA , a fast and a slow one, both configurable by the users.
The trigger of Buy and Sell Signals are calculated through the SMMA crosses:
Buy Signals : The fast SMMA crosses over the slow SMMA . They are highlighting by a green area and a "B" label.
Sell Signals : The fast SMMA crosses under the slow SMMA . They are highlighting by a red area and a "S" label
The trigger of Close Buy and Close Sell Signals are calculated through the close price crosses with the fast SMMA:
Close Buy Signals : The fast SMMA crosses under the close price and at the same time the trend is bullish , so the fast SMMA is greater than the slow SMMA . They are highlighted by a lighter green area
Close Sell Signals : The fast SMMA crosses over the close price and at the same time the trend is bearish , so the fast SMMA is lower than the slow SMMA . They are highlighted by a lighter red area
Few important points about the indicator and the produced signals :
This is not intended to be a strategy, but an indicator for analyzing the SMMA conditions. It gives you the triggers depending on the real time analysis of the SMMA and prices, but not being a proper strategy, pay attention about "fake signals" and add always a visual analysis to the provided signals
Following this indicator, the trade positions should be opened only when a cross happens. Either in this case, analyse the chart in order to see if the signals are a "weak" ones, due to "waves" around the SMMA . In these cases, you might wait for the next confirmation signals after the waves, when the trend will be better defined
The close trade signals are provided in order to help to understand when you should close the buy or sell trades. Even in this case, always add a visual analysis to the signals, and pay attention to the support/resistance areas. Sometimes, you can have the close signals in correspondence to support/resistance areas: in these cases wait for the definition of the trend and eventually for the next close trade signals if they will be better defined

Relative Strength Money Flow RibbonThis is a hybrid of both the RSI and MFI indicators.
Includes options to show coloured alert bars when threshold limits are reached.
Includes:
RSI indicator - yellow line
MFI indicator - green line
Customisable limits include:
Top threshold - 80
Upper limit - 70
Middle line - 50
Lower limit - 30
Bottom limit - 20

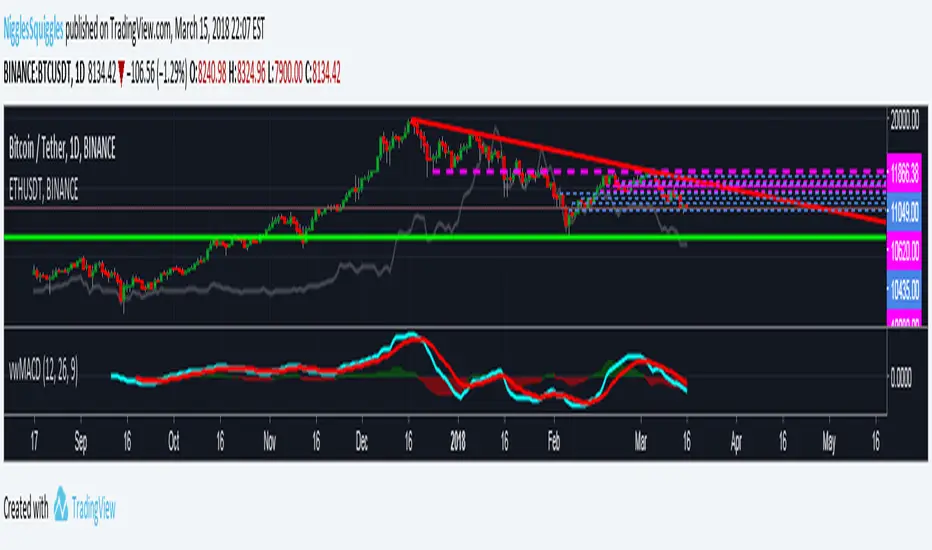
Volume Weighted MACDThis is just like the normal MACD indicator, except that the values are Volume Weighted and the Histogram changes colour depending on the positive or negative value

1min_&15min_Crypto_indicatorDear users,
This indicator used Fibonacci, MACD, RSI and Volume.
You just need to consider the "B" signal for Buy and "S" for sell your position...
Color candles stick are just here to confirm the position and use different setting less risky than B and S signals.
If you want to use the maximal potential of this indicator to buy and sell correctly I suggest you to buy and sell with B and S signal and to cut your position to the next B and S signal. You can also choose to cut your position to the next candle stick color... for less risky.
The backtesting of this indicator is 73.6% of good trades on 15 min candlestick and 81,6% on 1 minute candlesticks on BTCUSD. Same indicator is available for equities. (Min&15min_Equity_indactor_V14_Moriceau)
If you have any comment, let me know.

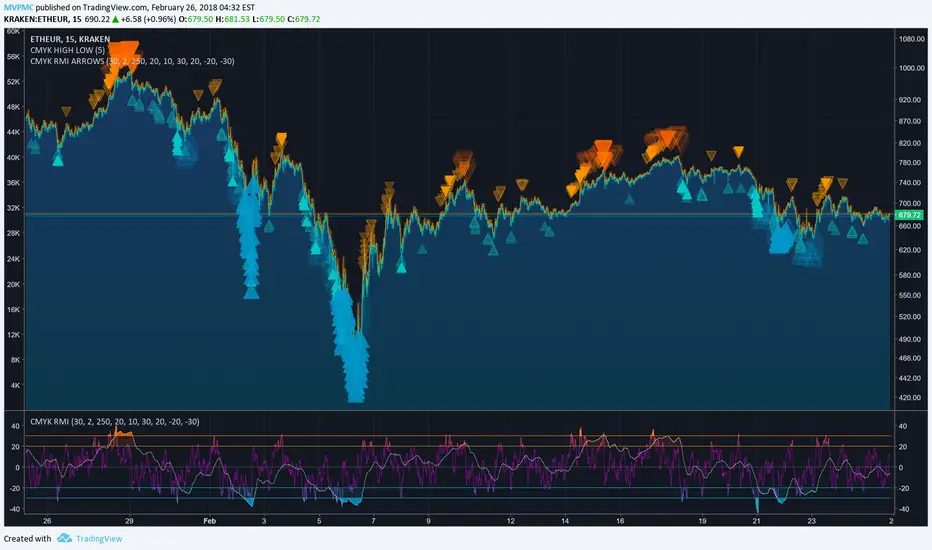
CMYK RMI ARROWS◊ Introduction
I started using this script because of its fast reaction, and good tell for buy/sell moments.
For larger timescales, the overall trend should be taken into account regarding the levels.
In the future i will update this indicator, to automatically adjust those.
This is the Overlay expansion of the Indicator Linked below.
◊ Origin
The Relative Momentum Index was developed by Roger Altman and was introduced in his article in the February, 1993 issue of Technical Analysis of Stocks & Commodities magazine.
While RSI counts up and down days from close to close, the Relative Momentum Index counts up and down days from the close relative to a close x number of days ago.
This results in an RSI that is smoother.
◊ Adjustments
CMYK color theme applied.
Four levels to indicate intensity.
Two Timescales, to overview the broader trend, and fast movements.
◊ Usage
RMI indicates overbought and oversold zones, and can be used for divergence and trend analysis.
◊ Future Prospects
Self adjusting levels, relative to an SMA trend.
Alternative RMI, which functions as an overlay.
◊ ◊ ◊ ◊ ◊ ◊ ◊ ◊ ◊ ◊ ◊ ◊ ◊ ◊ ◊ ◊ ◊ ◊ ◊ ◊ ◊ ◊ ◊ ◊ ◊ ◊ ◊ ◊ ◊ ◊ ◊ ◊ ◊ ◊ ◊ ◊ ◊ ◊ ◊ ◊ ◊ ◊ ◊ ◊ ◊ ◊ ◊ ◊ ◊ ◊ ◊ ◊ ◊ ◊ ◊ ◊ ◊ ◊ ◊ ◊ ◊ ◊ ◊ ◊ ◊ ◊ ◊ ◊ ◊ ◊ ◊ ◊ ◊ ◊ ◊ ◊ ◊ ◊ ◊ ◊ ◊ ◊ ◊ ◊ ◊ ◊ ◊ ◊ ◊ ◊ ◊ ◊ ◊ ◊ ◊ ◊ ◊ ◊ ◊ ◊ ◊ ◊ ◊ ◊ ◊ ◊
░▒▓█ CMYK ◊ RMI █▓▒░
GR-Moving Average CrossA simple indicator that contains all the main Moving Averages you'll probably need.
This indicator can be used on any time frame you wish.
The default periods for the moving averages are 5, 10, 20, 50, 100 & 200.
However you can set these values to whatever works for you, for example 5, 8, 10, 21, etc.
Please let me know in the comments below which values you use the most, so that I can adjust the defaults accordingly.
The lines get darker and thinker the more periods the MA covers.
You can easily adjust the colours of the lines and their thickness too.
The current colours seem to work OK on both the light and dark TradingView themes, but please do make suggestions for better default value.
You can also choose between 7 different ways of calculating the moving averages:
!None = You don't want to see this line
SMA ( Simple Moving Average )
EMA ( Exponential Moving Average )
WMA ( Weighted Moving Average )
DEMA ( Double Exponential Moving Average )
TEMA (Triple Moving Average
HMA ( Hull Moving Average )
This indicator can also show basic buy & sell zones.
They work well after steep trends, but will give lots of poor signals in a sideways moving market.
I find that the sell signal is more reliable than the buy signal.
Use these indications with caution and definitely combine them with other data/indicators as they are only based on the moving averages.
Comments and suggestions are most welcome.
I'm available for hire to create custom indicators or to work on more complex projects.

BSES - v1Buy and Entry signals for a trading pair.
Red and Black bars are selling zone, while green and blue bars are buying zones.
Black and Blue bars are better entry points than their counterparts (red and green ones), and can be highlighted using background coloring of the script.
This is extremely useful in detecting selling zones in a downtrend or buying zones in an uptrend.
Performs best in 2h candles, but can be used on any candle length.
Here is the fun part: Use this script on a 1 minute candle for intraday trades and have fun, profiting!!!

Buy + Sell [CryptoJewish]Beta
This indicator helps identify areas of buying and selling.
There are 4 levels of signals.
1. Weak
2. Medium
3. Strong
4. Extremely strong
Also there is a lagging indicator, which gives a signal of the 2nd level.
Levels greater than 1 are highlighted with a background and the color of the last bar is mixed with the color of the signal.
Almost everything can be turned on / off.
---
Additionally included:
- Ichimoku Cloud with settings for crypto (pure cloud, no extra lines)
- Bollinger Bands
- 4x SMA with a cross between them
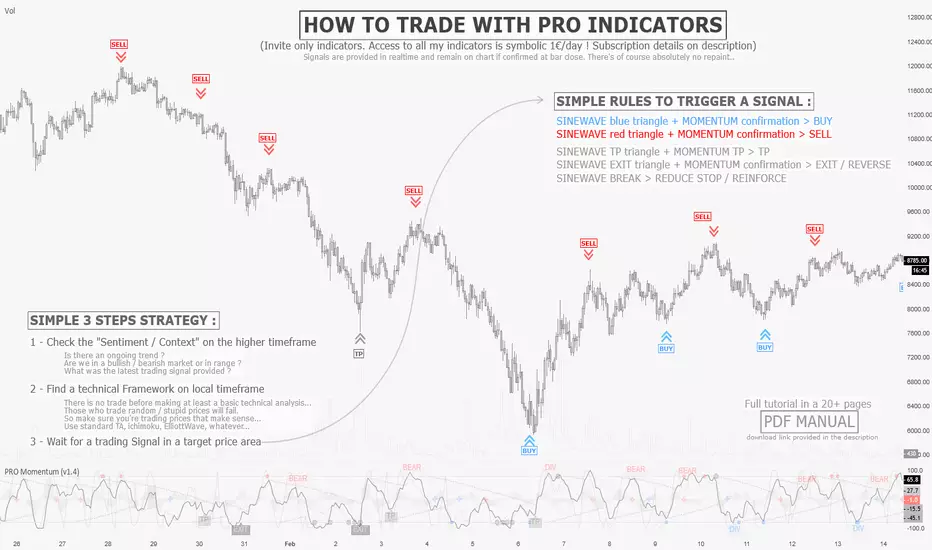
PRO MomentumINVITE ONLY SCRIPT:
FEATURES:
As its name suggests, PRO Momentum provides non-subjective momentum analysis to traders through automatic pattern detections, covering a wide range of statistically relevant structures in both ranging and trending contexts. Our goal was to provide a professional grade risk management tool capable of providing various signals, which guide the trader in its decision to engage or not in a certain price area filtered by Framework. Nevertheless, both indicators are complex tools requiring extensive learning. To support students in their journey, there is a wide open online community of users in our Discord channel, providing peer-to-peer assistance to progress with the strategy as well as tutored courses.
OUTPUTS:
To share a brief description of the PRO Momentum functioning, we will scroll through the major set of outputs that are presented to the user. Please note that the indicator is meant to assist from Junior to Senior expertise, to achieve this we have set different base templates right into the indicators. To keep this description simple, we will present the outputs you’ll see with the beginner setup:
Momentum Signals: As shown on the chart, there are multiple types of output signals, each corresponding to different momentum patterns. Detailed documentation is available on our website for those seeking in-depth information. Here's a high-level overview: The patterns are divided into three categories, each represented by different colors. Blue and Red signals are used in trending contexts, Gray signals are for ranging contexts, and dark-colored signals are exclusive to reversal contexts, suitable for more experienced traders. Momentum signals are binary outputs, making it easy for users to set alerts. The indicator includes built-in alerts for these groups to streamline the process. However, it’s crucial to remember that momentum signals are not standalone trading signals. The Framework indicator must first filter interesting prices and identify the context. Only then should traders use momentum signals to adjust risk.
Sinewave Oscillators: Cyclical analysis is a critical aspect of professional risk management. Markets naturally oscillate, and significant statistical probabilities can be derived from cycle studies. We use a custom-modified version of Ehlers’ sinewave methodology. Cyclical analysis, while somewhat predictive, scans past prices to predict probable future states. Since markets are inherently unpredictable, cycle analysis is used as a confirmation signal in our strategy. Essentially, we filter out all momentum signals that occur outside favorable cyclical conditions. Bearish signals are only exploited if the sinewave is in the top area of the oscillator, and vice-versa for bullish signals.
GENERAL STRATEGY:
Overall, the PRO Strategy combines two “core” indicators, Framework and Momentum. Framework is plotted on the main chart section as an overlay, it is definitely the most important as it guides the user through the hard process of filtering prices and timeframes that are suitable for technical analysis. On the other hand, PRO Momentum is on a separate oscillator tab under the chart section, it will study the momentum and cyclical structure, also offering automated pattern detection. Ultimately, our strategy is based on collecting and processing non-subjective rules, emanating from the indicators outputs. Essentially, this means that the indicator actually takes care of producing all the necessary binary outputs, leaving you with the remaining task of combining them correctly following the strategy’s patterns.
RISK LIMITATION:
Even if we provide automated momentum signal detection, there is no “one-click” or "easy-win” solution, the user still needs to carefully review the elements. When applicable pattern rules are confirmed, the user will gather risk-limitation information from both indicators (breakout targets, price confirmations, momentum and cyclical coordination) and decide whether or not to trade according to its own risk profile. If so, the position sizing, stop-loss positioning, risk management and profit targets will all be defined according to the same indicator’s outputs. This effectively suppresses most behavioral and personal biases the trader could introduce, creating a stable and statistical risk management structure aiming for a durable profitability.

Patrones de entrada/salida V.1.0 -BETA-Este algoritmo intenta identificar patrones o fractales dentro de los movimientos de precios para dar señales de compra o venta de activos.
