RSI Triple Time FrameThis indicator / study script can display the RSI for current chart timeframe along with the RSI of 1 to 3 other timeframes.
When all 3 additional RSI are at extreme levels (overbought/sold) or crossing the neutral line (50%) at the same moment, background chart color will change accordingly.
This indicates a strong momentum convergence between all selected timeframes, hence producing a stronger signal!
Go to settings to display/modify additional timeframes and/or to enable background colors:
Green = Overbought
Red = Oversold
Yellow = crossover neutral
Orange = crossunder neutral
NB1: For a simple and easy read of the RSI, set all additional TF to current chart TF and switch on desired colors.
NB2: Please note that current chart TF is not taken into consideration to change background color. But you can always set one of the 3 additional TF to the same TF as current chart.
Bonus: If you are also a user of my “MA Bollinger Bands + RSI” strategy script, this is particularly useful to visually detect crossover and crossunder of the RSI neutral line 😉
As always, enjoy!
Pesquisar nos scripts por "rsi"

RSI Effective Volume Reversal IndicatorAbout The Indicator
I want to start with a few short paragraphs of how this indicator came to be and why it's different than 80% of the indicators on this platform. If you are just interested in how the indicator works, you can skip the story, although I recommend at least skimming through it.
Originally, this indicator was developed to be part of a trend-trading strategy that analyzed the three main components - Price , Volume and Strength . It was broken down to 2 indicators - on-chart and off-chart, similarly to my first premium indicator "Trend Indicator for Directional Trading". Despite the similar concept, the current one is miles ahead in almost any regard.
As most of you know, strategies (especially the really good ones) are fairly more complex to use and navigate. You need to input the parameters for generating and tweaking the indicator, then you need to enter your risk management parameters like stop loss, position size, etc. and finally you need to set the exit criteria, like specified percent target, trial stop or an indicator condition. So, what was supposed to be a simple strategy that anyone can use and make money with, turned out to be a very complex one with over 20 parameters to tweak. I know from experience that when it comes to trading, less is more. This is especially true for the indicators.
As a result, I decided to split the project into two separate strategies - one for trend/directional trading and one for volume and strength (the one you are looking at right now). The problem was that as a standalone strategy it didn't perform all that well. And it shouldn't come as a surprise to anyone who has been trading long enough - divergences are one of the biggest tricksters there are - easy to identify only in hindsight. They are the new-trader's doom. I lost a decent amount of money chasing tops and bottoms through divergences and for that reason it's always been somewhat a goal of mine to create an indicator that can assist in this conquest (call it a personal vendetta). This indicator comes as close as I've ever been to this goal.
Right, but I just said a few lines above that this indicator doesn't work that well for divergences? That's true, but only if you completely automate it and let it buy every bullish and sell every bearish divergence. I have extensively tested it on the securities I actively trade (SPX500, Crude Oil, Gas, Gold, Copper) and with the right settings it does generate positive return (what strategy wouldn't with enough optimization, right?), but I would have made so much more money if I didn't fight the trend.
So, I decided to do something else - convert the strategy back to an indicator and use it for discretional trading in which it assists (not explicitly tell) me in making the decisions. And oh boy, did I hit the sweet spot there! It has been notoriously difficult for most scripts and indicators to identify proper support and resistance levels or at least not nearly as good as the human eye can do. This is especially the case with ascending and descending channels. Seeing how well it worked in helping me open longs and shorts at key levels, I decided to strip it from all unnecessary features and simplify the interface for easier navigation (about 300 lines of code less). This brings me to my next point.
How Does It Work?
The indicator relies on two main components in order to identify reversals - RSI module and Effective Volume module, hence the name RSI Effective Volume Reversal Indicator (not very creative, I know). You select which one you want to display via the dropdown menu. Now let me outline how each one works.
RSI module (top) - similarly to the traditional RSI, it is bound between 0 and 100. Oversold area is marked in green (15-25) and overbought area is marked in red (75-85). You can change those as you please, but I found those to be the perfect spots for identifying potential opportunities. This is where the similarities end. As you've noticed, it's not nearly as choppy as the traditional RSI, just the opposite - it's rather smooth, resembling Heikin-Ashi candles. Further, the way the candle is formed can indicate if we are approaching a top or bottom and if you should be looking for an opportunity to open a trade against the trend. Believe it or not, I've been developing and using this indicator for the past 6 months, so there's a lot to be said about the formation of those candles with clear examples, but I will leave those for the guide book that comes along with each purchase/subscription.
Effective Volume (bottom) - As I already have developed quite an extensive indicator that utilizes the effective volume profile, I just grabbed certain elements from it, simplified it and smoothed it via a new custom-made moving average along with some other minor updates. The results from RSI and Effective Volume may seem quite similar, but they actually reveal slightly different information and can be used to complement each other. In terms of coloring - green gradient above 50 and red gradient below 50.
What To Expect
It's important to understand that technical analysis does not predict prices. I am not claiming this indicator to be the crystal ball that will tell you when to long or short with max leverage. All I am saying is that it's a pretty good tool to help you time your trades, show real exhaustion of trends and reveal when a new direction is forming.
This indicator has been, and most likely will continue to be, work in progress. I've been experimenting with tons of features to make it better for the past 6 months and I finally believe it is stable and beneficial enough in order for you to use it. There's always something more that I would like to add and/or change, but I know that if I continue digging and improving, the indicator would have never seen the light of day. That's why I want to add the critical component to it - you. Through your feedback and recommendations, I believe we can make this indicator truly a masterpiece.
With that being said, I do have some future improvements planned, which I will be releasing on the go. Some are major, like updating it to v.5 and adding new features that are only available to the newest version of PineScript, while others are minor, such as color variations and more one-click customizations.
I hope I managed to portray an objective picture (with reasonable amount of words) of something that I've put a lot of work into, so that you can successfully use and make even more money on the markets. Once again, each purchase/subscription of this indicator comes with a guide in which I go into great detail explaining how to use the indicator, so rest assured that you will be able to take full advantage of it.

RSI CCI Correlating Oscillator (RCCO) by empowerTRCCO is pronounced "ree-koh" or "rico".
The RCCO is simply the plot of the values of both the RSI and CCI added together.
The RCCO makes some adjustments though, so that both the RSI and the CCI will fit correctly on the same scale - and so that these adjustments for scale allow reversals to be detected at crossings.
When the CCI crosses from underneath to up above the RSI, this is usually a bullish reversal. Alternatively, when the CCI crosses from above to back under the RSI, that usually signals a bearish trend. Look for the widest swings you can find to ensure good momentum. The larger the volume, the clearer and more decisive the trends. Low volume will lead to ranging and lazy momentum. High volume will create clear and forceful trends. The lowest negative RCCO in a timeframe, and then add some high volume... and you have yourself a good setup for a successful trade.
Because the RSI and CCI are adjusted, you may not recognize their values from having used the respective indicators on their own. The RSI and CCI values are less important. What matters with this indicator are the crossings and the RCCO value. The RCCO value should be negative, preferably, a deeply negative value. Look at the historical chart for the target per your selected timeframe and decide what values work for you.
I hope you enjoy the RCCO and that it can help you become a little más RICO!

RSI Back-calculation■Purpose of this script
Back-calculate the stock price limit based on the RSI formula
■Logic overview
This time, RSI calculation formula by Cutler is adopted.
In this formula, RSI is calculated from the ratio of the sum of price movements and the sum of price increases during a fixed period.
This script back-calculates future stock prices from past stock price data and set RSI values.
Therefore, you can receive the offer of the buy price in the oversold phase and the offer of the sell price in the overbought phase with reference to the RSI index.
■How to use
・Enter the following on the parameters input screen
・sauce (usually close)
・Reference period(14 is optimal by J.W. Wilder)
・RSI target value (Generally, buy below 30 and sell above 70)
・When to ask for stock price (After the latest bar closing price is decided: next. The latest bar is moving: current.)
For example, when selecting a daily chart, before trading hours: , during trading hours:
when selecting a weekly chart, the closing price is not fixed, for example on Wednesday:

RSI :: ALLinDivergence v10.0
Everything you see in this indicator has been designed with a single purpose, to ease your trading with simplify visual technical analysis of the market. It pulls data from 7 different TimeFrames and it can not be more simpler visual representation of its calculations when applied on chart.
When applied on chart, you will see GREEN/RED alternating MTF RSI line and its 70 overbought area and its 30 oversold area. There is a gentle purple colour line in the background which represents RSI line of the current TF (it is not crucial but it helps to know why MTF line turns RED or turns GREEN (crossing of those two).
HOW TO USE IT?
Rule 1.
TIMEFRAMES
Choose the best TimeFrame for the job. I use: 1min, 2min, 3min, 5min, 8min, 13min, 21min, 34min or 56min (golden ratio). You can also pick a different TF but only to up to 1h TF chart as it does not work well with TF over 1h. Smaller TF is used for SCALPING of DAY TRADING higher TF is used for SWING TRADING. You get the picture?
Rule 2
TO ENTER BUY/LONG POSITION: search for HigherLows on RSI MTF GREEN/RED LINE when it is coloured RED. To enter a position it should be confirmed with AALERT :: ALLinDivergence v 10.0 that "GREEN" Divergence is emerging.
TO ENTER SELL/SHORT POSITION: search for LowerHighs on RSI MTF GREEN/RED LINE when it is coloured GREEN. To enter a position it should be confirmed with ALERT :: ALLinDivergence v 10.0 that "RED" Divergence is emerging.
Rule 3
EXIT FROM BUY/LONG POSITION: search for HigherLows on RSI MTF GREEN/RED LINE.
EXIT FROM SELL/SHORT POSITION: search for LowerHighs on RSI MTF GREEN/RED LINE.
Rule 4
CAUTION
Do not rush to enter a position and try to predict what indicator will do next. It does not end well.
Be aware you are not exiting a position in panic that would be too soon or even worse, you get married to bad trade and you are not exiting even though you should exit by many signals you get.
Use risk management strategy to protect your capital.
Follow the rules and make your trading easier and better.

Finnie's RSI with EMA + MFI + Stoch V2RSI seams to be one of the most used indicators by far, and that comes because of merit . With that in mind, the goal of this indicator is to expand upon the tradition RSI or Relative Strength Index we all know and love :) I started by adding an EMA crossover. Which gives you, the users, a general idea of when to buy and sell outside of just watching a line go down and up. To take thinks even further, I decided to add options for both Fast and Slow Stochastic oscillators. Adding STOCH brings in another variable when deciding on an entry, technically its a bit hard to explain but in practice it would go something like this: you notice RSI is down around the level 20 mark and RSI is crossing up above it's EMA , which is BULLISH signal, and you're thinking about going long. As a second confirmation you can look at the STOCH rsi , if it's also crossing above the previously spoken EMA that's another BULLISH signal. This process can be repeated once RSI has risen to find an exit.
V2 changes:
-added MFI
-added overbought(yellow)/oversold(red) visual indicator
-removed K stoch in order to clean the indicator up visually, I haven't regretted it since :)

RSI+ by WilsonThis is a modified version of my RSI Cloud indicator. You can plot 2 moving averages over RSI. You have the option to plot moving average types like SMA, EMA, WMA, VWMA, HullMA, and ALMA. You also have the option to plot histograms based on any of the moving averages. You can fill colors between RSI and moving averages. Option to add alerts, crossover and crossunder signals are also included. I have also included a band to show the position of RSI using three colors. Green color is shown when RSI is above both the plotted moving averages. Red color is shown when RSI is below both the plotted moving averages. And Yellow color is shown when RSI is between the two plotted moving averages. Anyone is free to use the script. Wishing everyone happy and profitable trading.

RSI Multicolor editableEN:
RSI with overbought and oversold area in color and editable level. visually more interesting than the basic version the overbought and oversold areas catch the eye quickly. Depending on the strategies and your personal use of the RSI, you can modify all the lines and add colors to each defined zone.
overbought zone, oversold and editable noise zone
I wanted to have a modifiable RSI like some trading platforms.
please excuse me for my english and my code, i'm just getting started.
FR:
RSI avec zone de surachat et survente en couleur et niveau éditable. visuellement plus intéressant que la version basique les zones de surachat et survente attirent l’œil rapidement. Selon les stratégies et l'utilisation personnel que vous faite du RSI, vous pouvez modifier toutes les lignes et ajouter des couleurs à chaque zone défini.
zone de surachat, survente et zone de bruit éditable
je souhaitais avoir un RSI modifiable comme certaines plateforme de trading.
veuillez m'excuser pour mon anglais et mon code, je débute.
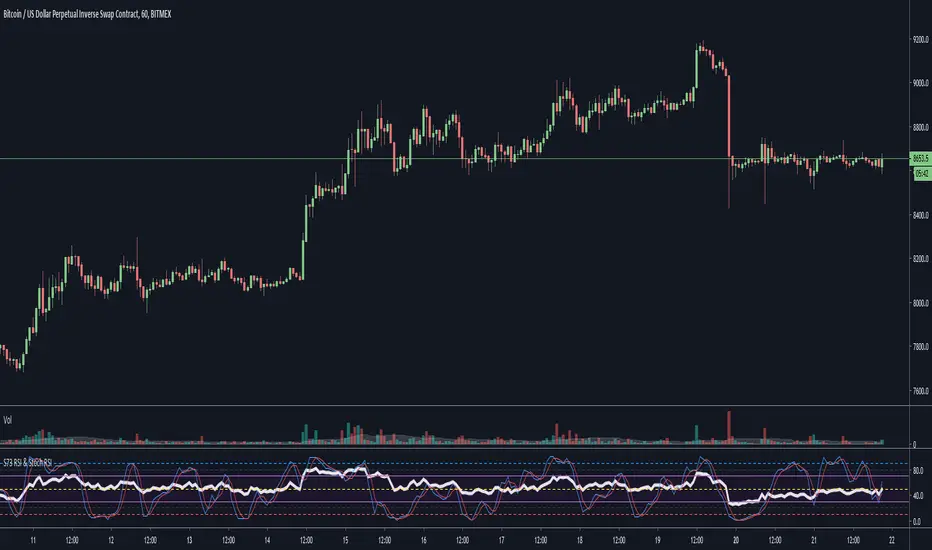
S73 RSI & Stoch RSIRSI and Stoch RSI combined into 1.
Get 2 for the price of 1.
Stoch RSI has two extra h lines, 10 an 90, as well as the traditional 20 and 80.
Remember, High Stoch RSI can mark the strength of a trend, doesn't necessarily mean there will be a change in trend once top and bottom levels are hit.
Click here to see how BTC has been topped out between levels of 90-100 for 14 weeks on the weekly chart.
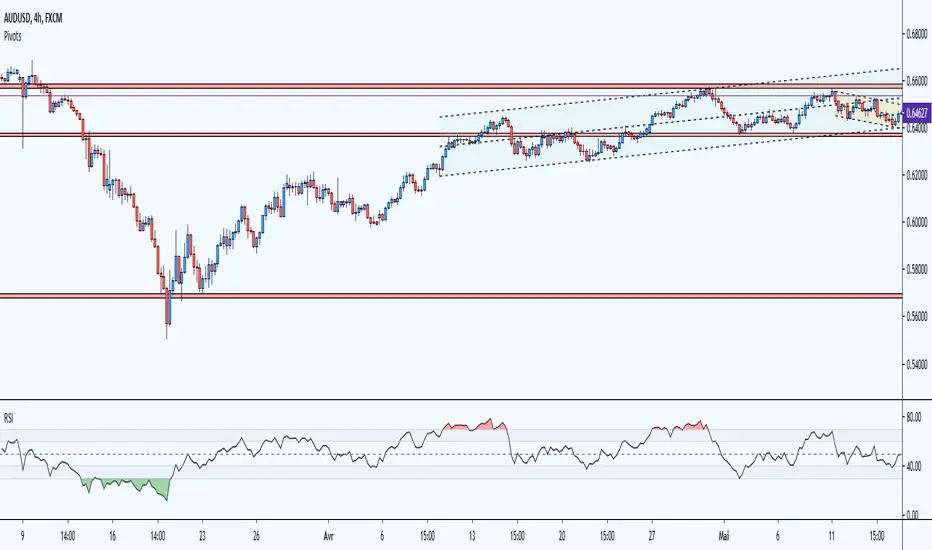
RSI + Trend Kijun LTThis script is a simple RSI + 1 indication on trend :
- RSI 14 periods that you can personalize :
- period and upper/lower boundary can be customize
- Coloration when RSI exceeds the upper/lower limits
- Indication on long term trend :
- if intraday or daily : weekly trend (haussier / baissier Ⓦ)
- if weekly : monthly trend (haussier / baissier Ⓜ)
- The trend is calculate by the following expression : last confirmed close (not real time) weekly/monthly compared to Kijun-Sen weekly/monthly
Ce script est un simple RSI + 1 indication de tendance :
- RSI 14 périodes que vous pouvez personnaliser :
- Période et limite supérieure/inférieure personnalisables
- Coloration lorsque le RSI dépasse les limites supérieures/inférieures
- Indication de la tendance à long terme :
- si intrajournalier ou journalier : tendance hebdomadaire (haussier / baissier Ⓦ)
- si hebdomadaire : tendance mensuelle (haussier / baissier Ⓜ)
- La tendance est calculée par l'expression suivante : dernière clôture confirmée (pas en temps réel) hebdomadaire/mensuelle par rapport à Kijun-Sen hebdomadaire/mensuelle.
NB : Maybe in futur, possibility to add daily trend when intraday / Peut-être à l'avenir, possibilité d'ajouter une tendance journalière en intrajournalier.
RSI|The Wave PrincipleThe Wave Principle | Modified RSI
30 green | 70 red = Strong Movement (Possible Impulse)
20 cyan | 80 Yellow = Strongest Movement
Support and Resistance Level (Trend Continuation)
Uptrend= 40
Downtrend = 60
Break+Retest = BR
Div = Divergence (Change in trend)
--------------------------------------------
This indicator has been modified from original RSI to fit Wave Principle characteristics:
Uptrend Impulsive Wave over 70 RSI it changes color to red, and > 80 yellow stronger impulse | Usually means continuation, at least once more.
Downtrend Impulsive Wave under 30 RSI it changes color to green, and < 20 cyan stronger impulse | Usually means continuation, at least once more.
Once RSI reached these levels, it doesn't mean trend reversal but a correction is expected. If it shows divergence along with an Ending Diagonal, it's a confirmation for trend reversal.
In a corrective wave, levels 40-60 represents support and resistance levels where price won't go further. Indicating Corrective Waves, not as strong as Impulsives.
Prices can breakout RSI trend lines and retest from the other side before continue the new trend as also described in the Wave Principle.
--------------------------------------------

RSI Bands Multi Time Frame [Jigga + LazyBear]This is a modified version of LazyBear's RSI Bands script. I added the possibility to display multiple RSI bands, so you can see the zones, where it is viable to enter a long or a short. You can also use different time frames, so you can visually see where any specific value of RSI is for your given time frame. This gives you a lot of possibilities. Default settings use 1h time frame and the most common reversal areas for RSI. Feel free to change the settings as you see fit. If the script makes your candles too small, you can go to style and turn off individual RSI bands. After that you will still be able to see the zones, but the scale of your chart won't be affected.
It also displays the middle line, which shows you the current trend and can prevent you from entering a long, when RSI is oversold during a strong downtrend or a short, when RSI is overbought during a strong uptrend.
Do not forget to use a proper stop loss and risk management.
Here you can see it in action in different markets:
BTC - BitMex
NASDAQ Composite - Stocks
EUR / USD - Forex

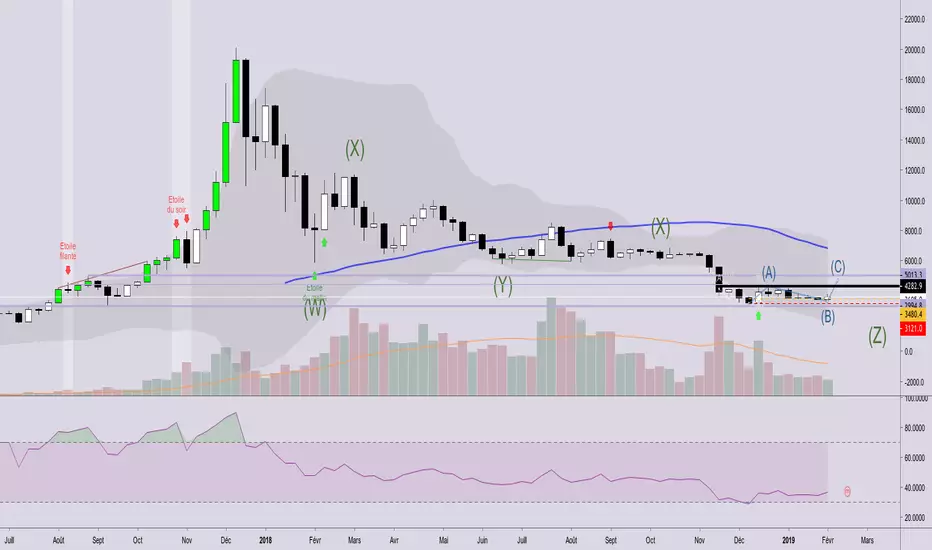
RSI Divergence - Baby WhaleThis RSI script will show you the following things:
When the RSI moves between the green lines (40 - 80++) we are in a Bull market.
If the RSI moves between the middle green and red line (40-60) we have some sideways action.
And yes, when the RSI is between the red lines (60 - 20--) we can say that we are in a Bear market.
The dashed lines in between are on every 10 points on the RSI.
All colors and lines are customisable.
The real MVP of this scrip is the RSI Divergence spotter.
A little green or red triangle will show up on the chart when a RSI Divergence is formed.
The Divergence is only shown when it happens in overbought (70+) or oversold (30-) regions to avoid too many signals.
I highly recommend not to jump in on every signal you get, but also use multiple reasons, like Elliot Wave or fib levels, before entering a trade.
If you want access, just send a message please.
Much love from Baby Whale!!
🙏❤️🐳

RSI StrapFollowers, this RSI is for you!
RSI Strap uses a normal Relative Strength Index (RSI) to determine what price level is in the over-bought or over-sold range.
This minimalist overlay improves the technical trading experience as indicators take up a lot of space and leave your chart area cluttered.
Change the RSI length, as well as the overbought and oversold levels in the indicator settings panel.
The default RSI length is set at 14, and the overbought and oversold levels are 70% and 30% respectively.
Happy Trading!
Find this indicator by searching "RSI Strap" in the public indicator library.
Don't forget to like!

RSI Exhaustion • Minimalist TradingThe RSI Exhaustion is an essential replacement of the standard RSI indicator because it is able to identify and highlight hidden exhaustion levels .
The indicator is crucial, even to the novice trader, to accurately spot trend reversal or trend continuation opportunities particularly when the RSI is neither overbought nor oversold. Additionally, the RSI Exhaustion becomes helpful in confirming extreme overbought or oversold RSI conditions.
By identifying hidden exhaustion levels, the RSI Exhaustion indicator represents an essential support to the trader in effectively reading the market and taking only the best opportunities.
The indicator is available via subscription and you can enjoy a free trial . To know more about the indicator and start the trial simply visit the link below.
➡ Try the indicator

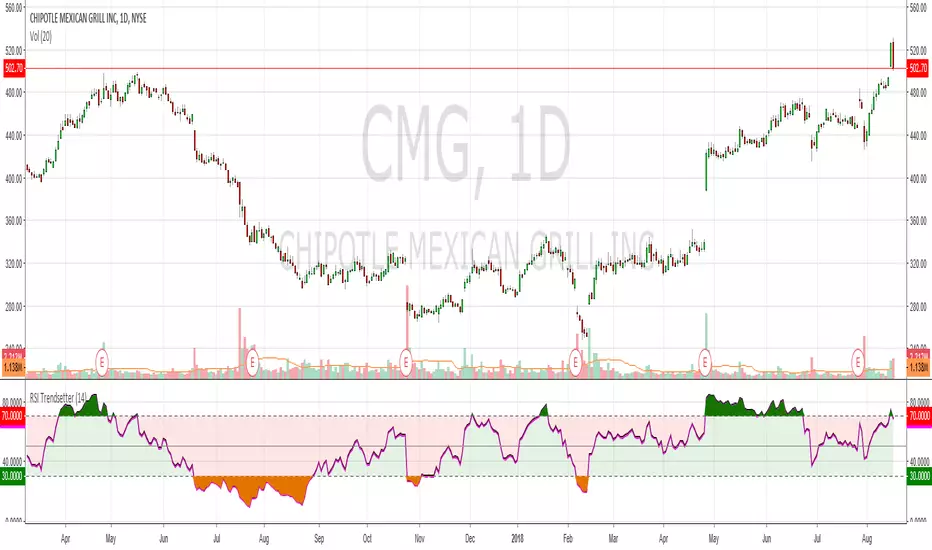
RSI TrendspotterHad a bit of a TA epiphany with RSI so bear with me. The time since RSI was last overbought/sold is a solid trend indicator. This may seem obvious but after x number of years trading it hit me like a smack in the face. I've coded this for easy visualisation. They're fairly simple changes but it's making a big difference in my trendspotting already.
In the example CMG hasn't been overbought for 183 days, so the RSI is mostly green:
Before that it hadn't been oversold for 199 days, so RSI is mostly red:
And before that it was ranging like a maf*ckin' sine wave, so the RSI shows green, red, green, red, etc.:
Finally, normal RSI for comparison. Same data, but now with pretty colours:
I've also added overbought/oversold highlights cause that just makes the whole charting thing a lot easier. Enjoy!
RSI buy/sell partitionsLook overbought and overbought to predict the time of the transaction.
RSI overbought:
- RSI = 21 to 30 (default configuration): The graph showing the letters 'Buy' and candles will have different colors.
- RSI < 21 (default configuration): The graph showing the letters 'Buy' displays bold and the candles will have high light background colors.
RSI oversold:
- RSI = 70 to 79 (default configuration): The chart that shows the word 'sell' and the candlestick will have different colors.
- RSI > 80 (default configuration): Display chart for 'Sell' displays bold and candles will have high light background colors.

RSI Multi-TimeframeThe Relative Strength Index (RSI) is an extremely useful oscillating momentum indicator that was developed by J. Welles Wilder and is one of the most widely used indicators in technical analysis.
HOW IS IT USED ?
In the classic view, a security is thought to be overbought when its RSI reading is above 70 and oversold when its RSI reading falls below 30. This makes it a good indicator for mean-reversion systems. Wilder recommended using the 70 and 30 levels as overbought and oversold levels respectively. When the RSI moves up over the 30 line it is considered a possible bullish reversal while a move down below the 70 line is considered a possible bearish reversal.
When the RSI is above 70 it is a potential exit signal if you are in a long position and when it is below 30 it is a potential exit signal if you are in a short position. Some traders use extreme readings for entry points in the direction of the long-term trend. Thus, if the long-term trend is bullish, then you'd wait for the RSI to reach oversold territory, which would be a potential entry point for a long position. Conversely, if the long-term trend is bearish, then overbought conditions could be a potential point to short the security.
I added the possibility to add on the chart a 2nd timeframe for confirmation.
If you found this script useful, a tip is always welcome... :)

SCOTTGO - RSI Divergence IndicatorRSI Divergence Indicator
This indicator combines the Relative Strength Index (RSI) with an automatic divergence detection system.
It is designed to help traders spot potential trend changes by:
Color-Coded RSI: The main RSI line dynamically changes color (e.g., green/red) above and below a user-defined threshold (default 50) to highlight strong or weak momentum instantly.
Divergence Signals: It automatically identifies and plots four types of RSI divergences (Regular Bullish, Hidden Bullish, Regular Bearish, and Hidden Bearish) between the price and the oscillator.
Custom Alerts: Includes alerts for all divergence types so you can be notified when a new signal is found.
This tool helps visualize momentum shifts and potential reversals in the market.

Yash RSI Bars - Multi Timeframersi time frame testing
Only bar coloring - No extra plots or lines
✅ Custom timeframe - Colors bars based on RSI from your selected timeframe
✅ White bars - When RSI is above overbought level (default 70)
✅ Yellow bars - When RSI is below oversold level (default 30)
✅ No color - When RSI is in neutral zone
Clean and simple! 🎯

RSI to 50 (decimal version) - TemujinTradingSimple indicator that shows the price levels required for the RSI to get to the value of 50.
What I observe is 50 rsi often acts as support or resistance and is a fair indication of bullish/bearish sentiment and price action and bounce/rejection levels.
It provides a table showing current time frame, 4 hr, daily, weekly describing the current rsi value and the price needed for that rsi to get to 50. This table is colored red when bearish at the time frame and green when bullish (as per <50 rsi or >50rsi).
Plots historical lines of each previous candle in the series showing how price interacts.
Updated script to allow manual input of price decimals to enable more assets price to be viewable in the table format.

RSI to 50 - TemujinTradingSimple indicator that shows the price levels required for the RSI to get to the value of 50.
What I observe is 50 rsi often acts as support or resistance and is a fair indication of bullish/bearish sentiment and price action and bounce/rejection levels.
It provides a table showing current time frame, 4 hr, daily, weekly describing the current rsi value and the price needed for that rsi to get to 50. This table is colored red when bearish at the time frame and green when bullish (as per <50 rsi or >50rsi).
Plots historical lines of each previous candle in the series showing how price interacts.

RSI PriceThe relative strength index (RSI) is a momentum indicator used in technical analysis. RSI measures the speed and magnitude of a security's recent price changes to detect overbought or oversold conditions in the price of that security. The RSI is displayed as an oscillator (a line graph) on a scale of 0 to 100.
Traditionally, an RSI reading of 70 or above indicates an overbought condition. A reading of 30 or below indicates an oversold condition. In addition to identifying overbought and oversold securities, the RSI can also indicate securities that may be primed for a trend reversal or a corrective pullback in price.
