RSI and Stochastic Probability Based Price Target IndicatorHello,
Releasing this beta indicator. It is somewhat experimental but I have had some good success with it so I figured I would share it!
What is it?
This is an indicator that combines RSI and Stochastics with probability levels.
How it works?
This works by applying a regression based analysis on both Stochastics and RSI to attempt to predict a likely close price of the stock.
It also assess the normal distribution range the stock is trading in. With this information it does the following:
2 lines are plotted:
Yellow line: This is the stochastic line. This represents the smoothed version of the stochastic price prediction of the most likely close price.
White Line: This is the RSI line. It represents the smoothed version of the RSI price prediction of the most likely close price.
When the Yellow Line (Stochastic Line) crosses over the White Line (the RSI line), this is a bearish indication. It will signal a bearish cross (red arrow) to signal that some selling or pullback may follow.
IF this bearish cross happens while the stock is trading in a low probability upper zone (anything 13% or less), it will trigger a label to print with a pullback price. The pullback price is the "regression to the mean" assumption price. Its the current mean at the time of the bearish cross.
The inverse is true if it is a bullish cross. If the stock has a bullish cross and is trading in a low probability bearish range, it will print the price target for a regression back to the upward mean.
Additional information:
The indicator also provides a data table. This data table provides you with the current probability range (i.e. whether the stock is trading in the 68% probability zone or the outer 13, 2.1 or 0.1 probability zones), as well as the overall probability of a move up or down.
It also provides the next bull and bear targets. These are calculated based on the next probability zone located immediately above and below the current trading zone of the stock.
Smoothing vs Non-smoothed data:
For those who like to assess RSI and Stochastic for divergences, there is an option in the indicator to un-smooth the stochastic and RSI lines. Doing so looks like this:
Un-smoothing the RSI and stochastic will not affect the analysis or price targets. However it does add some noise to the chart and makes it slightly difficult to check for crosses. But whatever your preference is you can use.
Cross Indicators :
A bearish cross (stochastic crosses above RSI line) is signalled with a red arrow down shape.
A bullish cross (RSI crosses above stochastic line) is signalled with a green arrow up shape.
Labels vs Arrows:
The arrows are lax in their signalling. They will signal at any cross. Thus you are inclined to get false signals.
The labels are programmed to only trigger on high probability setups.
Please keep this in mind when using the indicator!
Warning and disclaimer:
As with all indicators, no indicator is 100% perfect.
This will not replace the need for solid analysis, risk management and planning.
This is also kind of beta in its approach. As such, there are no real rules on how it should be or can be applied rigorously. Thus, its important to exercise caution and not rely on this alone. Do your due diligence before using or applying this indicator to your trading regimen.
As it is kind of different, I am interested in hearing your feedback and experience using it. Let me know your feedback, experiences and suggestions below.
Also, because it does have a lot of moving parts, I have done a tutorial video on its use linked below:
Thanks for checking it out, safe trades everyone and take care!
Pesquisar nos scripts por "rsi"

RSI Multi Symbol/Time Frame DetectorThis code is an implementation of the Relative Strength Index (RSI) indicator, which is a popular momentum indicator used in technical analysis. The RSI measures the strength of an asset's price action and provides information on whether the asset is overbought or oversold. The code also calculates a moving average of the RSI and allows the user to choose the type of moving average to be calculated (SMA, EMA, SMMA, WMA, or VWMA).
The user can select from different time frames (5, 15, 60, or 240), symbols (SP:SPX, OANDA:EURUSD, or OANDA:NZDUSD), RSI lengths, and moving average types and lengths.
The code starts by defining a function called "ma" for calculating different types of moving averages. This function takes as input the source data for the moving average calculation (the RSI), the length of the moving average, and the type of moving average. The function uses a switch statement to return the appropriate calculation based on the inputted moving average type.
Next, the code calculates the RSI and its moving average. The RSI is calculated using the well-known formula for the RSI, which involves calculating the average gains and losses over a specified period of time and then dividing the average gains by the average losses. The moving average is calculated using the "ma" function defined earlier.
Finally, the code allows the user to choose the symbol and time frame to be used in the RSI calculation, as well as the length of the RSI and the moving average, and the type of moving average. The user can choose from three symbols (SP:SPX, OANDA:EURUSD, OANDA:NZDUSD) and four time frames (5, 15, 60, and 240 minutes). The code then uses the "request.security" function to retrieve the RSI calculation for the selected symbol and time frame.
Note: This code is example for you to use multi timeframe/symbol in your indicator or Strategy , also prevent Repainting Calculation

Double RSI + BBRSI stands for Relative Strength Index.
Bollinger Bands stands for a channel open by standard deviation values plotting upper, lower lines.
Double RSI with Bollinger bands adapted Bollinger bands to RSI not using overlay mode. It tries to filter fake signals while giving more good signals according to volatility even below overbought areas or above oversold areas. This way you can use greater values for RSI, like 25 and 100, increasing smoothness with less market noise.
We added an extra gap spacer to smooth Bollinger bands while widening the channel with a lower multiplier.
I found better results when Fast RSI crosses back into Bollinger bands channel.
You can play with the following settings:
• Source
Close is the most used
• Fast RSI length
Default to 25
• Slow RSI length
Default to 100
• RSI Smoothing
To filter out some graphic noise
• RSI Overbought, Oversold
Regular overbought, oversold lines handled by a single value. For 70/30, set it to 20 although with longer RSI something around 15 is enough.
• Bollinger Spacer
Ads thickness to the channel with lower multiplier
• Bollinger Length
Regular Bollinger length applied to slow RSI
• Bollinger Multiplier
Regular Bollinger multiplier applied to slow RSI
Disclaimer:
For study purposes only, trading without a good risk management can be regrettable, do your own research, always add confirmations, use it as is, at your own risk.

RSI & BB QQE Mod (highlight)This script is a combination of the RSI, QQE and BB
Here is an explanation on how I combined them, and how they are used:
- RSI (Relative Strength Index)
- Display a smoothed version of the RSI to identify "oversold" and "overbought" market phases
- Used to calculate a QQE
- QQE (Quantitative Qualitative Estimation)
- Used to identify trend direction and trend strength
- Used to set a basis for the BB
- BB (Bollinger Bands)
- Used with QQE as a basis to determine a relative definition of "high RSI" and "low RSI"
- Used with QQE as a basis to determine the volatility of the RSI at a given moment
- Used to predict pivot points
Here are the main signals:
- When "RSI Smoothed" line above the Upper BB then "RSI Smoothed" line turns green
- Also , display green background color highlight
- Also , and if "RSI Smoothed" is above the overbought line then display a second green background color highlight
- When "RSI Smoothed" line bellow the Lower BB then "RSI Smoothed" line turns red
- Also , display red background color highlight
- Also , and if "RSI Smoothed" is bellow the oversold line then display a second red background color highlight
A tool codded to be aesthetically pleasing and VERY customisable:
- Designed for both light theme and dark theme users
- Value can be easily modified in the settings
- Colors can be easily swapped in the settings
- Opacity of "fill" & "bgcolor" regrouped as a single input
A tool codded to be easy to read and to learn from:
- Sources and inspirations all listed within the script
- Structure easily identifiable (to understand with little to no effort how the script works)
Notes :
- This script is lagging, because of that I do recommend using it on relatively large timeframe
- This script is OpenSource, feel free to reuse it, but if so please remember to include a link to my script in your sources
- This script is not a magical tool, use at your own risk

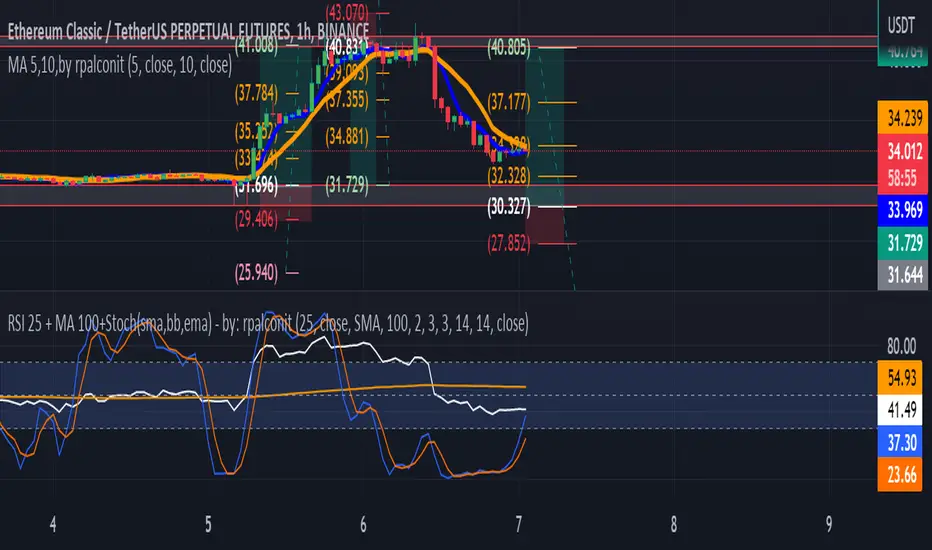
RSI 25 + MA 100+Stoch(sma,bb,ema) - by: rpalconitHello everyone,
This indicator uses RSI 25 + MA 100 + Stoch(sma,bb,ema to show buy and sell signals.
Signal Features:
• Buy Signal: It gives a buy signal when the RSI Length 25 bend upward below middle/lower bands and crosses MA 100 .
• Sell Signal: It gives a buy signal when the RSI Length 25 bend downward above middle/upper bands and crosses MA 100 .
• .
• Strong Buy Signal: It gives a strong buy signal when the RSI Length 25 bend upward below lower band and within overbought area of 30
• Storng Sell Signal: It gives a strong sell signal when the RSI Length 25 bend downward below lower band and within oversold area of 70.
You can change RSI length in any of your preference. And the Moving average you can select them from the list such as Simple Moving Average(SMA), Bollinger Bands( BB)and Exponential Moving Average (EMA.
In addition it includes momentum indicator like Stochastic RSI for more confirmation.
Details about the indicator
INPUTS
Time Frame
• Time Frames Chart: You can select your preferred timeframe at the dropdown list.
Relative Strength Index Settings
RSI Length: You can choose your preferred RSI length at the dropdown list.
RSI Source: You can choose your preferred RSI source at the dropdown list.
MA Setting:
1. MA Type: You can choose your preferred MA Type at the dropdown list.
2. MA Length: You can choose your preferred MA Length at the dropdown list.
3. stdDiv: You can choose your preferred the dropdown list.
Stochastic RSI gives you an idea about momentum if reach to the oversold and overbought areas.
Best regards,
ruelpalconit
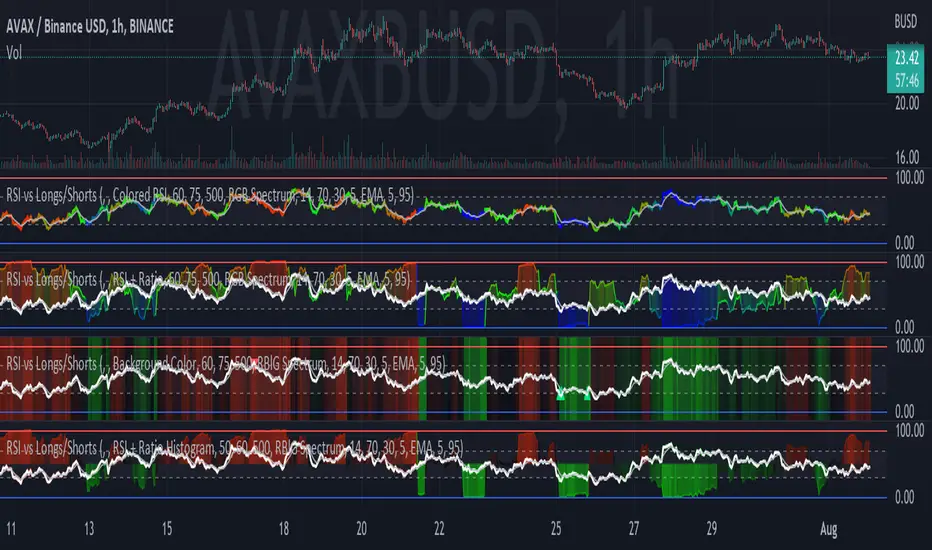
RSI vs Longs/Shorts Margin Ratio Percentage RankThis indicator plots the RSI of the current token and the percentage rank, of the RSI, of the ratio of a long margined token to a short margined token.
By default it plots the RSI of the current token with a color based on percentage rank the RSI of BITFINEX:BTCUSDLONGS divided by BITFINEX:BTCUSDSHORTS, so the assumption is that you are using it on a BTC chart. While you can select any Tradingview symbol for your Long and Short tokens I don't think you will get meaningful results unless you select a long and short margined token that matches your chart symbol, such as BITFINEX:ETHUSDLONGS and BITFINEX:ETHUSDSHORTS if you're trading ETHUSD. Even using margined tokens the results may not be meaningful, if there is not enough trade volume in the token, or if they are being manipulated, so you must backtest everything.
The three plot options are:
• Colored RSI - RSI plotted with colors based on the Longs/Shorts ratio
• Background Color - White RSI plot with Longs/Shorts ratio as background color
• RSI + Ratio - White RSI with Longs/Shorts ratio plotted in color
The chart shows all three options on an hourly BITFINEX:SOLUSD chart with BITFINEX:SOLUSDSHORTS and BITFINEX:SOLUSDLONGS.
By default it also plots a short term moving average and it can also plot the raw ratio rather than the percentage rank if selected.
This script started out as "RSI vs BITFINEX BTC Longs/Shorts Margin Ratio Percentage Rank" by me. I was interested in the ratio of BITFINEX:BTCUSDLONGS to BITFINEX:BTCUSDSHORTS as a measure of market sentiment and how that sentiment would magnify RSI changes. The volatility of the BTCUSDLONGS : BTCUSDSHORTS ratio was too low to get a good read, using a percent rank of the RSI of the ratio made the results more visible. After a discussion with @jason5480 I saw how opening it up to all margined Long / Short pairs was the best way forward. Unfortunately the name no longer matched the script, so I had to publish a new script.
RSI Levels, Multi-TimeframeThe relative strength index (RSI) is a momentum indicator that measures the magnitude of recent price changes to evaluate overbought or oversold conditions. RSI is normally displayed as an oscillator separately from price and can have a reading from 0 to 100. This indicator takes the RSI and plots the 30 & 70 levels onto the price chart so you can see when price is going to meet the 30 or 70 levels. The reason the 30 & 70 levels are important is because many traders (and bots) use those as signals to buy (at 30 RSI) or sell (at 70 RSI). Additionally, this indicator allows you to display not just the RSI levels of your currently viewed timeframe on the chart, but also shows the RSI levels of up to 6 different timeframes on the same chart. This allows you to quickly see if multiple RSI levels are aligning across different timelines, which is an even stronger indication that price is going to change direction when it meets those levels on the chart. There are a lot of nice configuration options, like:
Style customization (color, thickness, size)
Labels on the chart so you can tell which plots are the RSI levels
Optionally display the plot as a horizontal line if all you care about is the RSI level right now
Toggle overbought (RSI 70) or oversold (RSI 30) on/off completely

RSI Divergency and Golden RatioHow to calculate:
Positive mismatch finds the lowest trough within the distance you choose. It then compares it to the current closing value.
If the past low is above the current closing level, it means that the bottoms of the price are descending.
The RSI level at the furthest bottom of the price is detected. And the current RSI level is detected. If the current RSI level is higher than the previous RSI level, there is a positive divergence.
When a positive divergence occurs, a green pole forms above the RSI indicator on the chart.
Negative finds the highest peak level within the distance you choose. It then compares it to the current closing value.
If the past high is below the current close, it means that the highs of the price are rising.
The RSI level at the furthest high of the price is detected. And the current RSI level is detected. If the current RSI level is lower than the previous RSI level, there is negative divergence.
When a negative divergence occurs, a red pole forms above the RSI indicator on the chart.
As can be seen in the image, the points marked with red are the regions where incompatibility occurs. At the same time, the signals that occur when the RSI cuts its own moving average and the signals that occur when the RSI cuts its own golden ratio are also very strong signals.
Waiting for your ideas and comments. I am open to criticism. We can improve.

RSI Signals by HBRELATIVE STRENGTH INDEX (RSI)
This is a tool that is widely used
Especially for Overbought and Oversold systems, but I have made some changes in this indicator,
How to use it...!
I have set it as the default setting
- RSI Length: 7
- Overbought: 70
- Oversold: 30
What is unique about this tool?
we can see 3 conditions:
1) RSI Overbought / Oversold with Bullish Engulfing / Bearish Engulfing
2) RSI Overbought / Oversold with Hammer and Shooting Star
3) RSI Overbought / Oversold with 2 Bullish Bars / 2 Bearish Bars
4) RSI Overbought / Oversold with All Patterns at the same time
When the RSI reaches its Oversold line, the code will wait for Bullish Engulfing pattren , when oversold and Bullish engulfing matched, This indicator will generate a buy signal when the condition is met,
and same as for Bear market, When the RSI reaches its Overbought line, the code will wait for Bearish Engulfing pattren , This indicator will generate a sell/exit signal when the condition is met,
2nd condition is that a Hammer candle will be waited for when RSI touches the Overbought line, for Bullish Move
and Shooting Star candle will be waited for when RSI touches the Overbought line, for Bullish Move, for Bearish Move
3rd Condition is also the same as Condition 1 and Condition 2,
When the RSI reaches its Oversold line, the code will wait for 2 Bullish Bars , when oversold and 2 Bullish Bars matched then this indicator will generate a buy signal, and same as for Bear market,
When the RSI reaches its Overbought line, the code will wait for 2 Bearish Bars , when overbought and 2 Bearish Bars matched then this indicator will generate a Sell signal,
4th Condition is that we can use All Conditions at the same time,
- Bullish Engulfing / Bearish Engulfing
- Hammer and Shooting Star
- 2 Bullish Bars / 2 Bearish Bars

RSI Relative Strength Index 3X - DurbtradeDurbtrade Triple RSI - 3 individual RSI's on 1 indicator, each distinguishable by length, as well as line color, thickness, opacity, and type.
(note: usable line TYPES are limited... try experimenting)
1) RSI's
A) Each RSI can be customized to change color based on RSI vertical direction (default = only RSI #1 changes color).
B) All 3 RSI's use a single Source (default Close).
C) You may customize the length of each RSI individually (I LOVE my default 14, 7, and 3!).
D) RSI #1 is the primary RSI, and is plotted LAST, so that it is drawn ABOVE RSI #2, which is drawn above RSI #3.
2) Horizontal Lines
A) Horizontal lines are also drawn automatically, so you don't have to, and they don't extend past the current bar.
B) There are 11 customizable lines, and each one is set to non-customizable increments (zero, 10, 20, 30, 40, fifty, 60, 70, 80, 90, hundred).
C) The 11 lines are divided into 2 groups:
a) 4 PAIRS of lines WITH fill options (10/90, 20/80, 30/70, 40/60... 8 lines total), and
b) 3 INDIVIDUAL lines WITHOUT fill options (zero, fifty, hundred).
D) The 4 fills give you the option to fill the space between each pair with a customizable color and opacity (the default is what I personally feel is best for each).
3) Conclusion
A) As with my previous indicators, this one maximizes information, discernment, clarity, and customization.
B) It is optimized for your ability to be able to customize a relatively basic but important indicator with ease
for use on your own personal television, laptop, or cellular phone screen setup... and on all chart zoom levels and layouts.
B) And, this being my 3rd script, please feel free to comment, critique, or leave suggestions. I find them helpful!
C) Check out my previous pine scripts if you like this one. They work well together.
D) I hope that you find this useful.
E) Enjoy!
//Durbtrade

Bjorgum RSIRSI output signals are displayed with color change to reflect the plotted value. This makes evaluating RSI conditions require but a glance.
RSI momentum buy signals are given on the cross of the 50 level, whereas sell signals are given on a fall below.
Default values a 5 period RSI which gives more timely entrances and exits for swing traders. This can be adjusted to the typical 14 period if the viewer desires slower signals.
Bullish and bearish area is shaded to accentuate the signal to the eye.
Excellent results can be found when coupling BJ RSI, with BJ TSI, and the reversal system using all 3 as a complete together simultaneously
Default color changes are plotted as a recorded value falls within the following levels:
RSI < 30 = green
RSI 30-50 = red
RSI 50-70 = blue
RSI 70-80 = yellow
RSI 80-90 = orange
RSI 90-100 = white hot

RSI Season Tracker by KrisWatersSeason tracker identifies the momentum with tracking dominance and market capitalization data of Bitcoin , Altcoin and USDT .
With this indicator you can able to get know about Bitcoin, Altcoin and USDT dominance and market capitalization easily.
Backgrond Color Definations:
If the background color of indicator is ORANGE means that Bitcoin dominance is the most powerful. It is a good sign for Bitcoin.
If the background color of indicator is BLUE means that Altcoin dominance is the most powerful. It is a good sign for Altcoins.
If the background color of indicator is GREEN means that USDT dominance is the most powerful. It is a good sign for USDT.
Plus Sign (+) Meaning and Color Definations:
If ORANGE plus sign is visible on indicator means that market capitalization of Bitcoin is increasing. It is a good sign for Bitcoin.
If BLUE plus sign is visible on indicator means that market capitalization of Altcoin is increasing. It is a good sign for Altcoins.
If GREEN plus sign is visible on indicator means that market capitalization of Bitcoin and Altcoins are decreasing. It is not a good sign for both.
Light and Dark RSI Line Color Definations:
If the line of Bitcoin color is Orange means that, RSI value was increased compared with previous bar. It is one of the good sign of the momentum strength.
If the line of Bitcoin color is Yellow means that, RSI value was decreased compared with previous bar. It is not a good sign.
If the line of Altcoin color is Navy means that, RSI value was increased compared with previous bar. It is one of the good sign of the momentum strength.
If the line of Altcoin color is Blue means that, RSI value was decreased compared with previous bar. It is not a good sign.
If the line of USDT color is Green means that, RSI value was increased compared with previous bar. It is one of good the sign of the momentum strength.
If the line of USDT color is Lime means that, RSI value was decreased compared with previous bar. It is not a good sign.
Simple RSI rules are valid for this indicator.
RSI value is under 30 indicates that asset is OVERSOLD .
RSI value is upper 70 indicates that asset is OVERBOUGHT .
Important Notice: Dominance data is not correlated with price. For example; sometimes dominance is increasing but the price is not. And that's where the market capitalization comes in.
If the plus sign is not visible , you can get questioning for the movement. It is not a good sign at all.
If the plus sign is visible and RSI is increasing , It is a good sign for the strength of assets movement.
I recommended to use on DAILY timeframe . But you can use different timeframes as well.
Please leave comment below If you have any question or development idea.

RSI Call-outs Multi-resolution [BigBitsIO]This is a simple multi-resolution (multi-timeframe) RSI indicator that overlays the current chart to show labels for specified oversold and overbought areas defined with inputs.
Up to 4 different resolutions/timeframes for their respective RSI (1,2,3, or 4). RSI1 is always enabled and can not be disabled.
Red labels with white text represent overbought RSI levels as defined by the user. All enabled RSI will have to qualify as overbought based on settings.
Green labels with black test represent oversold RSI levels as defined by the user. All enabled RSI will have to qualify as oversold based on settings.
This RSI overlay help easily call-out overbought and oversold candles on a chart where other RSI values on larger resolutions/timeframes are also oversold/overbought without sacrificing screen space for a traditional RSI indicator that is not overlayed on the chart.
This indicator has alert conditions that will trigger when all enabled RSI indicators are either oversold or overbought respective to your settings.
Note: The best results are to operate your chart as your smallest RSI resolution selected. Personally, I prefer to have my smallest (shortest timeframe) in RSI1, and go larger farther out to RSI4.
RSI + Composite Index [SHK]One of the most powerful indicator based and divergence strategies i have ever seen was made by Constance Brown.
The Composite Index:
The best way to think of the Composite Index as it applies to the RSI is to think of the RSI as Windows 3.0 and the Composite Index as Windows 10. Constance Brown discovered that the RSI, while it does create and detect divergences, does is not as accurate as it could be. It’s a bit of an oxymoron to say this but the RSI is a momentum indicator without any momentum calculation attached to it. The RSI actually misses a significant amount of important moves and even generates some bad moves. What Constance Brown did with the RSI is to input a momentum calculation within the RSI itself.
Usage:
1. Check hidden and regular divergences on RSI+COMPOSITE_INDEX and PRICE+COMPOSITE_INDEX.
2. After finding divergence wait for COMPOSITE_INDEX to cross under/over it's moving averages to trigger.
Useful Note:
"RSI overbought/oversold as filter", "RSI and COMPOSITE_INDEX trendline as trigger", "RSI 50 Over/Under as trend direction detection", ... can be add to this strategy.
Enjoy!

RSI / Stoch / SRSI / MFI / Aroon Overlay [SigmaDraconis]Combines 4 popular indicators (RSI, Stoch, SRSI, MFI) and 1 peculiar one (Aroon) in 1 for those who want to save indicators but not only.
This is an evolution of my (simpler) "RSI / Stoch / Stoch RSI (SRSI) Overlay " that you can find on my scripts.
Added bands for oversold/overbought areas (70/30 common for RSI and 80/20 for SRSI and MFI), as well as a middle 50 horizontal line.
Neutral bands around 55-45 added as well that can be hidden for less clutter. I also recommend a more transparent coloring for these since Pine script doesn't allow default transparency for horizontal lines.
By default only RSI and Stoch are activated, you can activate Aroon, MFI and SRSI on the inputs window.
Some extra notes:
* RSI, Stoch and MFI can help to strengthen one's decision as well as Aroon to predict a possible trend reversal, SRSI can show when RSI has high probability of being topped or bottomed when oversold/overbought but don't forget to look at volume and how the trend progresses that can keep SRSI above 80 or below 20 while RSI and price continues to trend, divergences are most helpful here to find possible reversal areas.
* This chart depicts some interesting divergences, as well as Stoch tops and bottoms and confluences between RSI/MFI and Stoch on some over-extended tops and bottoms that shown being good reversal zones.
RSI resistances are shown as well, failing to break above 60 or the neutral zone (this is a bearish BTC trend chart after all) or failing to gain support to break up certain levels (RSI notes a more bullish trend when consistently above 60 and more bearish below 40).
If you like it and use it to profit, please tip me below :)
Tip jars:
BTC: 15nMBiEGVrdGcu9C1h6QRcTNRvugHkqrMQ
ETH: 0xC33845946c48B61fBCbEA0367ec2238CaF2b73bc
BTS: sigma-draconis

RSI Divergence + MTF Table + Price Wicks Lines - V2This script combines a classic RSI divergence indicator with a multi–timeframe RSI dashboard.
Main features:
Detects and plots:
Regular bullish & bearish RSI divergence
Hidden bullish & hidden bearish RSI divergence
Dynamic RSI line color:
Green in strong bullish zone
Red in strong bearish zone
Yellow in neutral zone
Standard RSI levels:
70 / 30 overbought–oversold
50 midline with highlighted band
MTF RSI table:
Compact RSI dashboard on the right side of the chart
Timeframes: 1m, 5m, 15m, 30m, 1h, 4h, 8h, 12h, 1D (each can be turned on/off)
Background color highlights extreme RSI:
Red / orange for overbought
Lime for oversold
This tool is designed to help traders quickly see divergence signals on the current chart while also monitoring RSI conditions across multiple timeframes in one place.

RSI Value Table – match builtin🧭 Overview
“RSI Value Table – match builtin” displays the exact RSI value (identical to TradingView’s built-in RSI) for any selected timeframe — directly on your chart.
It’s designed for professional traders who need quick RSI confirmation without switching panels or opening multiple indicators.
⚙️ Core Logic
Reads RSI from any timeframe using request.security() with gaps_off and lookahead_off — ensuring a perfect match with the native RSI.
Optional EMA smoothing (non-standard) for visual stability.
Color-coded cell:
🟩 Green → RSI > 50 (bullish momentum)
🟥 Red → RSI < 50 (bearish momentum)
🟨 Yellow → Neutral zone around 50
Adjustable table position: top/bottom, left/right corners.
⚡ Alerts
Built-in alert conditions trigger automatically:
RSI > 50 → bullish momentum confirmation.
RSI < 50 → bearish momentum confirmation.
📈 How to Use
Select your preferred RSI timeframe (e.g., Daily, Weekly, 4H).
Watch the color-coded cell:
Green → trade long bias only.
Red → short bias only.
Ideal as a confirmation module for multi-timeframe systems or smart signal engines.

RSI Shift Zone [ChartPrime]OVERVIEW
RSI Shift Zone is a sentiment-shift detection tool that bridges momentum and price action. It plots dynamic channel zones directly on the price chart whenever the RSI crosses above or below critical thresholds (default: 70 for overbought, 30 for oversold). These plotted zones reveal where market sentiment likely flipped, helping traders pinpoint powerful support/resistance clusters and breakout opportunities in real time.
⯁ HOW IT WORKS
When the RSI crosses either the upper or lower level:
A new Shift Zone channel is instantly formed.
The channel’s boundaries anchor to the high and low of the candle at the moment of crossing.
A mid-line (average of high and low) is plotted for easy visual reference.
The channel remains visible on the chart for at least a user-defined minimum number of bars (default: 15) to ensure only meaningful shifts are highlighted.
The channel is color-coded to reflect bullish or bearish sentiment, adapting dynamically based on whether the RSI breached the upper or lower level. Labels with actual RSI values can also be shown inside the zone for added context.
⯁ KEY TECHNICAL DETAILS
Uses a standard RSI calculation (default length: 14).
Detects crossovers above the upper level (trend strength) and crossunders below the lower level (oversold exhaustion).
Applies the channel visually on the main chart , rather than only in the indicator pane — giving traders a precise map of where sentiment shifts have historically triggered price reactions.
Auto-clears the zone when the minimum bar length is satisfied and a new shift is detected.
⯁ USAGE
Traders can use these RSI Shift Zones as powerful tactical levels:
Treat the channel’s high/low boundaries as dynamic breakout lines — watch for candles closing beyond them to confirm fresh trend continuation.
Use the midline as an equilibrium reference for pullbacks within the zone.
Visual RSI value labels offer quick checks on whether the zone formed due to extreme overbought or oversold conditions.
CONCLUSION
RSI Shift Zone transforms a simple RSI threshold crossing into a meaningful structural tool by projecting sentiment flips directly onto the price chart. This empowers traders to see where momentum-based turning points occur and leverage those levels for breakout plays, reversals, or high-confidence support/resistance zones — all in one glance.

RSI Buy Sell Signals+ with MFI Cloud [RanaAlgo]Indicator Overview
This indicator combines RSI (Relative Strength Index) with MFI (Money Flow Index) to generate trading signals with additional confirmation filters. The key features include:
RSI Analysis (14-period) with overbought/oversold levels
MFI Cloud (20-period default) showing trend direction via EMAs
Enhanced Signal Generation with volume and trend confirmation options
Visual Elements including colored zones, signal labels, and an information panel
How to Use This Indicator
Basic Interpretation:
Buy Signals (green labels) appear when:
RSI crosses above oversold level (30) OR
RSI shows a rising pattern from oversold zone with volume/trend confirmation (if enabled)
Sell Signals (red labels) appear when:
RSI crosses below overbought level (70) OR
RSI shows a falling pattern from overbought zone with volume/trend confirmation (if enabled)
MFI Cloud provides trend confirmation:
Green cloud = bullish trend (fast EMA > slow EMA)
Red cloud = bearish trend (fast EMA < slow EMA)
Recommended Usage:
For Conservative Trading:
Enable both volume and trend confirmation
Require MFI cloud to align with signal direction
Wait for RSI to clearly exit overbought/oversold zones
For Active Trading:
Combine with price action at key support/resistance levels
Watch for divergence between price and RSI
The Information Panel (top-right) shows:
Current RSI value and status
MFI trend direction
Last generated signal
Current momentum
Customization Options:
Adjust RSI/MFI lengths for sensitivity
Modify overbought/oversold levels
Toggle volume/trend confirmation requirements
Adjust visual elements like cloud opacity and zone visibility

RSI Z-Score + TableHow It Works
RSI Calculation
The standard RSI is computed over a user-defined period (default: 14), measuring the strength of recent price movements.
Z-Score Transformation
The RSI is then normalized using the Z-Score formula:
ini
Kopieren
Bearbeiten
Z = (RSI - Mean) / Standard Deviation
This highlights whether RSI is unusually high or low compared to its historical behavior.
Smoothing
An optional EMA is applied to the Z-Score for smoother and more reliable signals (default: 10-period smoothing).
Z-Score Table
A real-time value of the RSI Z-Score is displayed in a table in the top-right of the indicator pane.
The value is clamped between +2 and -2
+2 aligns with strong overbought RSI conditions
-2 aligns with strong oversold RSI conditions
How to Use It
Buy Signal Potential: When the Z-Score drops below -1.5 or -2 → statistically oversold RSI
Sell Signal Potential: When the Z-Score rises above +1.5 or +2 → statistically overbought RSI
Use in Confluence: Combine with price action, trend filters, or other Z-Score indicators (e.g. OBV, VWAP, VIX) for SDCA or mean-reversion strategies

RSI NarrativesDescription:
The RSI Narratives script aggregates Relative Strength Index (RSI) values across multiple cryptocurrency narratives or sectors, providing an easy-to-read visual and alert system for trend reversals and overbought/oversold conditions. This tool is designed for traders looking to track sector-specific trends and compare performance across AI, DeFi, Level 1 blockchains, and more.
Key Features:
RSI Aggregation by Sector: Calculates average RSI for key narratives, including AI, DeFi, Level 1 blockchains, new memes, and more.
Customizable RSI Settings: Adjust RSI period, line width, and label offsets for personalized analysis.
Dynamic Alerts: Receive alerts when a narrative enters overbought or oversold territory, helping you act quickly on market movements.
Clean Visualization: Overlay sector-specific SMA lines with distinct colors and optional labels for quick interpretation.
Multi-Narrative Comparison: Analyze trends across diverse narratives to identify emerging opportunities.
Parameters for Customization:
RSI Period: Set the lookback period for RSI calculations (default: 14).
Line Width: Adjust the thickness of plotted lines (default: 2).
Label Offset: Control label placement for better chart readability.
Overbought/Oversold Thresholds: Configure the RSI levels for alerts (default: 70/40).
How to Use:
Add the script to your TradingView chart.
Customize the RSI parameters to suit your trading strategy.
Monitor the plotted SMA lines to identify narrative-specific trends.
Set alerts for overbought and oversold conditions to stay informed in real time.
Alerts System:
Alerts trigger when a narrative crosses predefined overbought or oversold levels.
Text notifications suggest potential trading actions, such as selling on overbought or buying on oversold.
Intended Users:
This script is ideal for crypto traders, sector analysts, and market enthusiasts who want to track performance across narratives and gain actionable insights into sector rotations.
Disclaimer:
This script is for educational and informational purposes only. It does not constitute financial advice. Please test on historical data and practice caution when trading.
RSI Trend [MacroGlide]The RSI Trend indicator is a versatile and intuitive tool designed for traders who want to enhance their market analysis with visual clarity. By combining Stochastic RSI with moving averages, this indicator offers a dynamic view of market momentum and trends. Whether you're a beginner or an experienced trader, this tool simplifies identifying key market conditions and trading opportunities.
Key Features:
• Stochastic RSI-Based Calculations: Incorporates Stochastic RSI to provide a nuanced view of overbought and oversold conditions, enhancing standard RSI analysis.
• Dynamic Moving Averages: Includes two customizable moving averages (MA1 and MA2) based on smoothed Stochastic RSI, offering flexibility to align with your trading strategy.
• Candle Color Coding: Automatically colors candles on the chart:
• Blue: When the faster moving average (MA2) is above the slower one (MA1), signaling bullish momentum.
• Orange: When the faster moving average is below the slower one, indicating bearish momentum.
• Integrated Scaling: The indicator dynamically adjusts with the chart's scale, ensuring seamless visualization regardless of zoom level.
How to Use:
• Add the Indicator: Apply the indicator to your chart from the TradingView library.
• Interpret Candle Colors: Use the color-coded candles to quickly identify bullish (blue) and bearish (orange) phases.
• Customize to Suit Your Needs: Adjust the lengths of the moving averages and the Stochastic RSI parameters to better fit your trading style and timeframe.
• Combine with Other Tools: Pair this indicator with trendlines, volume analysis, or support and resistance levels for a comprehensive trading approach.
Methodology:
The indicator utilizes Stochastic RSI, a derivative of the standard RSI, to measure momentum more precisely. By applying smoothing and calculating moving averages, the tool identifies shifts in market trends. These trends are visually represented through candle color changes, making it easy to spot transitions between bullish and bearish phases at a glance.
Originality and Usefulness:
What sets this indicator apart is its seamless integration of Stochastic RSI and moving averages with real-time candle coloring. The result is a visually intuitive tool that adapts dynamically to chart scaling, offering clarity without clutter.
Charts:
When applied, the indicator plots two moving averages alongside color-coded candles. The combination of visual cues and trend logic helps traders easily interpret market momentum and make informed decisions.
Enjoy the game!

RSI & Volume Impact Analyzer Ver.1.00Description:
The RSI VOL Score indicator combines the Relative Strength Index (RSI) and volume data through a mathematical calculation to assist traders in identifying and confirming potential trend reversals and continuations. By leveraging both momentum (RSI) and volume data, this indicator provides a more comprehensive view of market strength compared to using RSI or volume alone.
How It Works:
This indicator calculates a score by comparing the RSI against its moving average, adjusted by the volume data. The resulting score quantifies market momentum and strength. When the score crosses its signal line, it may indicate key moments where the market shifts between bullish and bearish trends, potentially helping traders spot these changes earlier.
Calculation Methods:
The RSI VOL Score allows users to select between several calculation methods to suit their strategy:
SMA (Simple Moving Average): Provides a balanced smoothing approach.
EMA (Exponential Moving Average): Reacts more quickly to recent price changes, offering faster signals.
VWMA (Volume Weighted Moving Average): Emphasizes high-volume periods, focusing on stronger market moves.
WMA (Weighted Moving Average): Applies greater weight to recent data for a more responsive signal.
What the Indicator Plots:
Score Line: Represents a combined metric based on RSI and volume, helping traders gauge the overall strength of the trend.
Signal Line: A smoothed version of the score that helps traders identify potential trend changes. Bullish signals occur when the score crosses above the signal line, while bearish signals occur when the score drops below.
Key Features:
Trend Identification: The score and signal line crossovers can help confirm emerging bullish or bearish trends, allowing traders to act on upward or downward momentum.
Customizable Settings: Traders can adjust the lengths of the RSI and signal line and choose between different moving averages (SMA, EMA, VWMA, WMA) to tailor the indicator to their trading style.
Timeframe-Specific: The indicator works within the selected timeframe, ensuring accurate trend analysis based on the current market context.
Practical Use Cases:
Trending Markets: In trending markets, this indicator helps confirm bullish or bearish signals by validating price moves with volume. Traders can use the crossover of the score and signal line as a guide for entering or exiting trades based on trend strength.
Ranging Markets: In ranging markets, the indicator helps filter out false signals by confirming if price movements are backed by volume, making it a useful tool for traders looking to avoid entering during weak or uncertain market conditions.
Interpreting the Score and Signal Lines:
Bullish Signal: A bullish signal occurs when the score crosses above the signal line, indicating a potential upward trend in momentum and price.
Bearish Signal: A bearish signal is generated when the score crosses below the signal line, suggesting a potential downward trend or weakening market momentum.
By mathematically combining RSI and volume data into a single trend score, the RSI VOL Score indicator provides traders with a powerful tool for identifying trend shifts early and making more confident trading decisions.
Important Note:
The signals generated by this indicator should be interpreted in conjunction with other analysis tools. It is always advisable to confirm signals before making any trading decisions.
Disclaimer:
This indicator is designed to assist traders in their decision-making process and does not provide financial advice. The creators of this tool are not responsible for any financial losses or trading decisions made based on its signals. Trading involves significant risk, and users should seek professional advice or conduct their own research before making any trading decisions.
