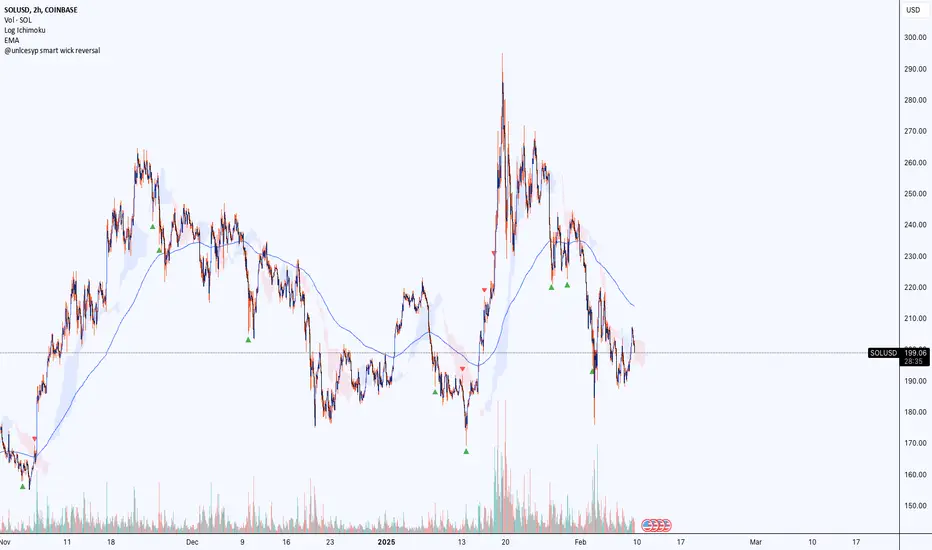
@unlcesyp smart wick reversal@unlcesyp smart wick reversal
This indicator helps you spot potential market reversals by highlighting abnormal wicks that often signal a turning point. It adapts to changing market volatility and volume, making it more reliable across different market conditions.
How It Works
1. Wick Analysis
- Measures upper and lower wicks over a chosen lookback period.
- Calculates the average and standard deviation of these wicks, then flags “abnormally long” wicks.
2. Adaptive Volatility
- Uses an ATR-based volatility factor to adjust the wick threshold.
- In high-volatility conditions, the threshold is higher, reducing false signals.
3. Trend Check
- Select either an SMA or EMA to determine if the market is in an uptrend or downtrend.
- A large upper wick in an uptrend can signal bullish exhaustion (potential reversal down).
- A large lower wick in a downtrend can signal bearish exhaustion (potential reversal up).
4. Optional Volume Confirmation
- Checks if volume is above its average to ensure strong participation in the move.
- Helps filter out weak, low-volume signals.
5. Signals
- Red ▼ (triangle down) = Potential Bearish Reversal
- Green ▲ (triangle up) = Potential Bullish Reversal
Why Use It?
- Adaptive: Automatically adjusts to changes in market volatility.
- Flexible Trend Basis: Choose SMA or EMA for calculating market trend.
- Volume Filter: Adds an extra layer of confirmation.
- Clear Visuals: Marks potential reversals with simple, unobtrusive shapes.
Inputs Explained
1. Lookback Period for Wick Analysis (`length`)
- Default: 20
- Number of bars used to calculate wick averages. Higher values = smoother signals; lower values = more reactive.
2. ATR Length for Volatility Filtering (`atr_length`)
- Default: 14
- Number of bars the ATR uses to gauge volatility.
3. Base Threshold Multiplier (`base_multiplier`)
- Default: 2.0
- Multiplier for standard deviation of wicks. Higher = fewer (but potentially stronger) signals.
4. Volatility Sensitivity Factor (`volatility_sensitivity`)
- Default: 1.5
- Adjusts how much volatility affects the threshold. Higher = more adaptive; lower = more stable.
5. Enable Volume Confirmation (`volume_filter`)
- Default: true
- When enabled, signals only appear if volume exceeds its average by a specified multiplier.
6. Volume Spike Multiplier (`vol_multiplier`)
- Default: 1.5
- Determines how much above average volume must be to confirm a signal.
7. Trend Calculation Method (`trendMethod`)
- Options: “SMA” or “EMA”
- Determines the type of moving average to evaluate the market trend for exhaustion signals.
Best Practices
- Combine with other price action or technical indicators to confirm signals.
- Use on multiple timeframes for a broader market perspective.
- Adjust parameters (`length`, `atr_length`, `base_multiplier`) for different assets or personal preference.
Pesquisar nos scripts por "reversal"
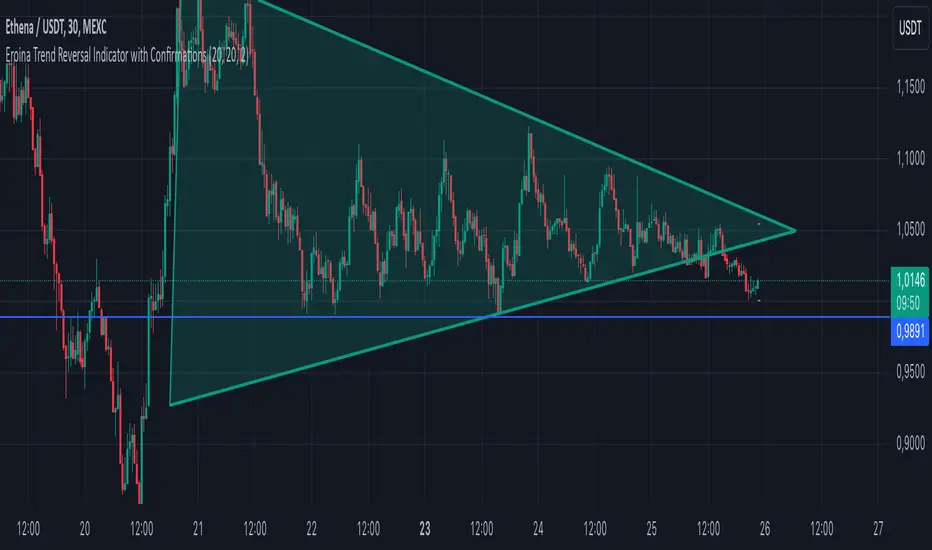
Eroina Trend Reversal Indicator with ConfirmationsEroina Trend Reversal Indicator with Confirmations
Overview (English):
The Trend Reversal Indicator with Confirmations is designed to identify potential trend reversals by analyzing dynamic resistance and support levels. This script uses a robust confirmation system to reduce false signals, making it ideal for traders who seek disciplined, data-driven decisions.
Key Features:
• Dynamic Levels: Calculates resistance and support levels based on user-defined lengths.
• Breakout Confirmation: Confirms trend reversals by validating price action over a specified number of candles.
• Visual Cues: Displays “LONG” and “SHORT” signals directly on the chart, alongside resistance/support levels.
• Customizable Parameters: Adaptable to different timeframes and market conditions.
How It Works:
1. Resistance & Support Levels:
• Resistance: Calculated as the highest high over the last N bars.
• Support: Calculated as the lowest low over the last N bars.
2. Breakout Detection:
• A resistance breakout occurs when the price closes above the resistance level.
• A support breakout occurs when the price closes below the support level.
3. Confirmation Logic:
• Signals are validated only if the price remains above/below the levels for a user-defined number of candles.
4. Entry Signals:
• “LONG” signals indicate a confirmed breakout above resistance.
• “SHORT” signals indicate a confirmed breakdown below support.
Settings:
• Resistance Length: Defines the number of candles used to calculate resistance levels.
• Support Length: Defines the number of candles used to calculate support levels.
• Confirmation Candles: Specifies how many candles are required to confirm breakouts.
Usage:
This indicator is ideal for identifying trend reversals and optimizing entry points. Combine it with volume analysis or other technical indicators to enhance accuracy. For example:
• Use in conjunction with RSI to avoid overbought/oversold conditions.
• Combine with moving averages to confirm the trend direction.
Overview (Additional Language):
(Your additional language description can go here after English, e.g., Russian, Spanish, etc.)
Turtle Soup ICT Strategy [TradingFinder] FVG + CHoCH/CSD🔵 Introduction
The ICT Turtle Soup trading setup, designed in the ICT style, operates by hunting or sweeping liquidity zones to exploit false breakouts and failed breakouts in key liquidity Zones, such as recent highs, lows, or major support and resistance levels.
This setup identifies moments when the price breaches these liquidity zones, triggering stop orders placed (Stop Hunt) by other traders, and then quickly reverses direction. These movements are often associated with liquidity sweeps that create temporary market imbalances.
The reversal is typically confirmed by one of three structural shifts : a Market Structure Shift (MSS), a Change of Character (CHoCH), or a break of the Change in State of Delivery (CISD). Each of these structural shifts provides a reliable signal to interpret market intent and align trading decisions with the expected price movement. After the structural shift, the price frequently pullback to a Fair Value Gap (FVG), offering a precise entry point for trades.
By integrating key concepts such as liquidity, liquidity sweeps, stop order activation, structural shifts (MSS, CHoCH, CISD), and price imbalances, the ICT Turtle Soup setup enables traders to identify reversal points and key entry zones with high accuracy.
This strategy is highly versatile, making it applicable across markets such as forex, stocks, cryptocurrencies, and futures. It offers traders a robust and systematic approach to understanding price movements and optimizing their trading strategies
🟣 Bullish and Bearish Setups
Bullish Setup : The price first sweeps below a Sell-Side Liquidity (SSL) zone, then reverses upward after forming an MSS or CHoCH, and finally pulls back to an FVG, creating a buying opportunity.
Bearish Setup : The price first sweeps above a Buy-Side Liquidity (BSL) zone, then reverses downward after forming an MSS or CHoCH, and finally pulls back to an FVG, creating a selling opportunity.
🔵 How to Use
To effectively utilize the ICT Turtle Soup trading setup, begin by identifying key liquidity zones, such as recent highs, lows, or support and resistance levels, in higher timeframes.
Then, monitor lower timeframes for a Liquidity Sweep and confirmation of a Market Structure Shift (MSS) or Change of Character (CHoCH).
After the structural shift, the price typically pulls back to an FVG, offering an optimal trade entry point. Below, the bullish and bearish setups are explained in detail.
🟣 Bullish Turtle Soup Setup
Identify Sell-Side Liquidity (SSL) : In a higher timeframe (e.g., 1-hour or 4-hour), identify recent price lows or support levels that serve as SSL zones, typically the location of stop-loss orders for traders.
Observe a Liquidity Sweep : On a lower timeframe (e.g., 15-minute or 30-minute), the price must move below one of these liquidity zones and then reverse. This movement indicates a liquidity sweep.
Confirm Market Structure Shift : After the price reversal, look for a structural shift (MSS or CHoCH) indicated by the formation of a Higher Low (HL) and Higher High (HH).
Enter the Trade : Once the structural shift is confirmed, the price typically pulls back to an FVG. Enter a buy trade in this zone, set a stop-loss slightly below the recent low, and target Buy-Side Liquidity (BSL) in the higher timeframe for profit.
🟣 Bearish Turtle Soup Setup
Identify Buy-Side Liquidity (BSL) : In a higher timeframe, identify recent price highs or resistance levels that serve as BSL zones, typically the location of stop-loss orders for traders.
Observe a Liquidity Sweep : On a lower timeframe, the price must move above one of these liquidity zones and then reverse. This movement indicates a liquidity sweep.
Confirm Market Structure Shift : After the price reversal, look for a structural shift (MSS or CHoCH) indicated by the formation of a Lower High (LH) and Lower Low (LL).
Enter the Trade : Once the structural shift is confirmed, the price typically pulls back to an FVG. Enter a sell trade in this zone, set a stop-loss slightly above the recent high, and target Sell-Side Liquidity (SSL) in the higher timeframe for profit.
🔵 Settings
Higher TimeFrame Levels : This setting allows you to specify the higher timeframe (e.g., 1-hour, 4-hour, or daily) for identifying key liquidity zones.
Swing period : You can set the swing detection period.
Max Swing Back Method : It is in two modes "All" and "Custom". If it is in "All" mode, it will check all swings, and if it is in "Custom" mode, it will check the swings to the extent you determine.
Max Swing Back : You can set the number of swings that will go back for checking.
FVG Length : Default is 120 Bar.
MSS Length : Default is 80 Bar.
FVG Filter : This refines the number of identified FVG areas based on a specified algorithm to focus on higher quality signals and reduce noise.
Types of FVG filter s:
Very Aggressive Filter: Adds a condition where, for an upward FVG, the last candle's highest price must exceed the middle candle's highest price, and for a downward FVG, the last candle's lowest price must be lower than the middle candle's lowest price. This minimally filters out FVGs.
Aggressive Filter: Builds on the Very Aggressive mode by ensuring the middle candle is not too small, filtering out more FVGs.
Defensive Filter: Adds criteria regarding the size and structure of the middle candle, requiring it to have a substantial body and specific polarity conditions, filtering out a significant number of FVGs.
Very Defensive Filter: Further refines filtering by ensuring the first and third candles are not small-bodied doji candles, retaining only the highest quality signals.
In the indicator settings, you can customize the visibility of various elements, including MSS, FVG, and HTF Levels. Additionally, the color of each element can be adjusted to match your preferences. This feature allows traders to tailor the chart display to their specific needs, enhancing focus on the key data relevant to their strategy.
🔵 Conclusion
The ICT Turtle Soup trading setup is a powerful tool in the ICT style, enabling traders to exploit false breakouts in key liquidity zones. By combining concepts of liquidity, liquidity sweeps, market structure shifts (MSS and CHoCH), and pullbacks to FVG, this setup helps traders identify precise reversal points and execute trades with reduced risk and increased accuracy.
With applications across various markets, including forex, stocks, crypto, and futures, and its customizable indicator settings, the ICT Turtle Soup setup is ideal for both beginner and advanced traders. By accurately identifying liquidity zones in higher timeframes and confirming structure shifts in lower timeframes, this setup provides a reliable strategy for navigating volatile market conditions.
Ultimately, success with this setup requires consistent practice, precise market analysis, and proper risk management, empowering traders to make smarter decisions and achieve their trading goals.

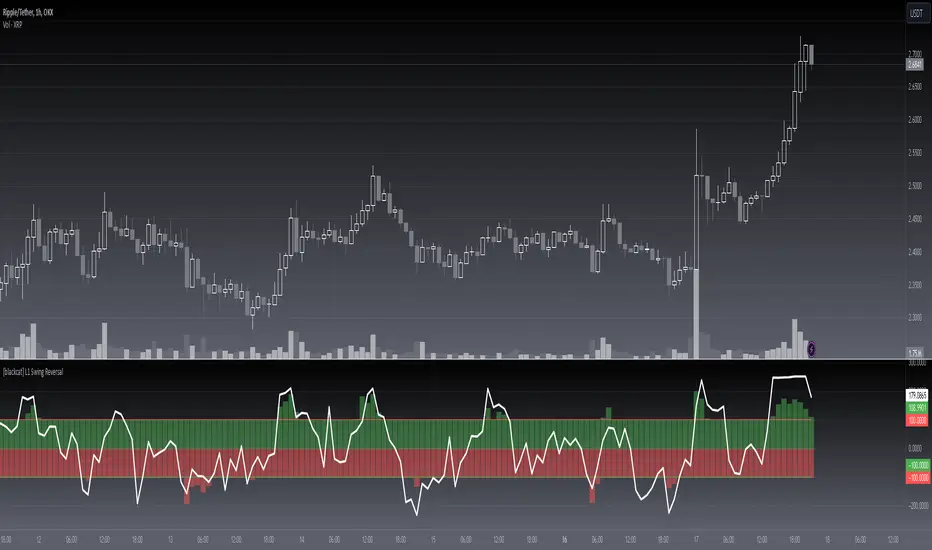
[blackcat] L1 Swing Reversal█ OVERVIEW
The script is an indicator that calculates and plots the L1 Swing Reversal, which involves smoothing price data and calculating a modified RSI to identify potential swing reversals in the market. It overlays columns representing the smoothed price data and a line for the adjusted RSI.
█ LOGICAL FRAMEWORK
The script begins by defining input parameters for customizable periods. It then calculates the typical price, derives components of the swing reversal indicator, smooths these components, and computes an adjusted RSI. The main sections include input parameter definitions, function definition, and plotting. The script flows data through calculations and logical operations to produce final plot values.
█ CUSTOM FUNCTIONS
Function: l1_swing_reversal
This function calculates the L1 Swing Reversal indicators based on high, low, close, and open prices, along with three periods. It computes a smoothed price component and an adjusted RSI.
Parameters:
• high : High prices of the asset.
• low : Low prices of the asset.
• close : Close prices of the asset.
• period_n : Period for the first component calculation.
• period_m : Period for standard deviation and moving average calculations.
• period_n1 : Period for RSI calculation.
Return Values:
• cc1_column_red : Red column values for the first component.
• cc1_column_green : Green column values for the first component.
• rsi : Adjusted RSI values.
█ KEY POINTS AND TECHNIQUES
The script uses several key Pine Script features such as the sma (simple moving average), stdev (standard deviation), max, abs, and ema (exponential moving average) functions. It also demonstrates the use of conditional operators to cap the column values at -100 and 100. The script’s structure is clear and follows best practices by encapsulating the main logic within a function and using descriptive variable names.
█ EXTENDED KNOWLEDGE AND APPLICATIONS
Potential modifications could include adding more sophisticated reversal signals based on the RSI and column values, or enhancing the visualization with additional plot types. This script could be used in scenarios where traders are interested in identifying potential swing reversals using a combination of smoothed price data and momentum indicators. Related Pine Script concepts include using barssince for counting bars since a condition, crossover and crossunder for detecting trend changes, and hline for adding horizontal lines to the chart.
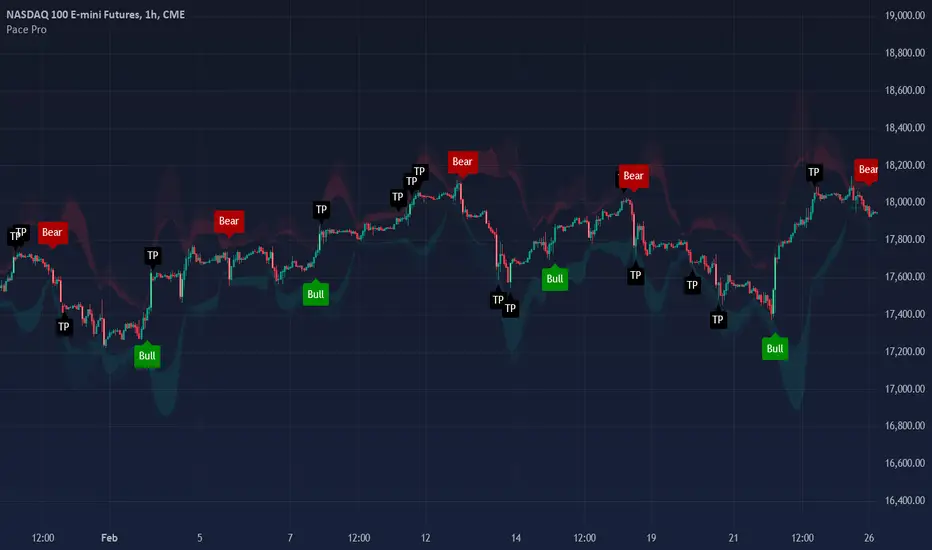
Pace ProOverview
The Pace Pro indicator is a robust trend-following tool designed for versatile application across various timeframes and markets, including stocks, forex, futures and cryptocurrencies. It provides traders with "bull" and "bear" signals, take profit (TP) signals, and volume spike indications. This indicator aims to help traders identify potential trading opportunities through trends, reversals and price exhaustion.
Key Features
Bull and Bear Signals: Pace Pro generates green "bull" and red "bear" signals based on a trend strength score derived from an aggregation of components.
Take Profit (TP) Signals: The indicator plots black "TP" signals at areas of price exhaustion.
Volume Spike Indicators: The indicator colors candles to signify high volume spikes—light green for high bullish volume and light red for high bearish volume.
Price Clouds: The indicator includes three types of Bollinger Band clouds. These clouds help visualize exhaustion and volatility, providing traders with multiple perspectives on market dynamics.
How it works:
Trend Strength: This score is calculated using a proprietary formula that assesses the magnitude and direction of market movement with standard deviation and regression analysis. Standard deviation computes the average price over a specified period and then calculates the standard deviation of prices from this average. A linear regression is performed on the closing prices over a specified period. The slope of the regression line is used to identify the trend direction, and the standard deviation is used to assess trend stability and filter out noise, working together to clearly identify direction and robustness. Bull/Bear signals are produced based on trend strength reaching specific thresholds, configurable in the settings.
Overbought/Oversold Strength: This strength identifies price exhaustion using a unique formula that aggregates values from several indicators such as RVI, RSI and CCI. RVI captures price trends, RSI measures momentum, and CCI identifies price deviations from the mean, providing a comprehensive view of market conditions. Take profit signals are plotted at points of high price exhaustion, indicating optimal exit prices.
Volume Analysis: Volume spikes are identified and highlighted with colored candles using an ATR calculation that pinpoints outliers in volume. This is calculated using the math.abs function, identifying volume spikes in the last 14 bars. Volume spike candle size can be configured in settings to the user's liking.
Bollinger Band Clouds: The indicator employs Bollinger Band clouds based on WMA, VWMA, and EMA to provide a comprehensive view of market volatility and trend strength. WMA responds quickly to price changes, VWMA incorporates volume, and EMA smooths out data, offering a unique and adaptive perspective on market conditions. This combination is used to provide a unique perspective on market volatility, utilizing different moving averages. These clouds adapt to price fluctuations and offer visual cues to enhance trend analysis.
Utility
This tool provides traders with valuable information for trend-following and reversal strategies across different timeframes. It helps traders by:
-Generating "bull" and "bear" signals to indicate potential long, short and exit points. The precise calculation methods and statistical components used in deriving the trend strength score are designed to filter out market noise and provide a clear indication of prevailing market trends.
-Providing "TP" signals at areas of price exhaustion, areas where taking profit is optimal. These also serve as potential reversal points in the market as they incorporate reversion analysis techniques.
-Highlighting high volume spikes with colored candles to indicate significant market activity. These volatile candles can indicate a significant and rapid surge in price.
-Offering visual insights through Bollinger Band clouds, which help traders assess overbought and oversold conditions on a broad scale. These aid in visualizing potential reversals in the market.
Rationale and Benefits of Component Combination
The combination of trend strength, overbought/oversold strength, volume analysis, and Bollinger Band clouds provides a holistic approach to market analysis and allows users to use various techniques of trading analysis to make sound trading decisions. Each component serves a distinct purpose:
-Trend Strength identifies and confirms the direction and magnitude of market trends, offering clear bull and bear signals. A trend score is calculated to clearly identify where price is strongly trending and where it is quite weak. This customizable feature allows traders to configure this indicator to their liking by only plotting signals when the trend reaches a desired threshold.
-Overbought/Oversold Strength pinpoints areas of price exhaustion, providing crucial take profit and reversal conditions in the market. I combine RSI, RVI, and CCI to provide a more robust reversion score. My rationale for this is to leverage data from multiple indicators, to ensure a comprehensive assessment of price exhaustion rather than relying on a single source.
-Volume Analysis highlights significant market activity, giving traders insights into potential price movements. This feature is included to provide users with a visual representation of price pumps/dumps, that can aid in trading decisions in combination with entry and exit signals.
-Bollinger Band Clouds offer a visual representation of market volatility and trend strength, enhancing the overall analytical framework. Bands were calculated using a mixture of WMA, VWMA, and EMA to diversify data and to bring variety to its display. This can enhance its use as it does not use a single data source and relies on multiple.
Uniqueness:
This indicator stands out due to its innovative integration of standard deviation and regression analysis, offering traders a unique and comprehensive market analysis tool. By combining standard deviation to measure volatility and filter out noise with regression analysis to identify trend direction and strength, it provides insightful trend signals that help traders make informed decisions. This indicator's versatility is enhanced by its customizable settings, allowing traders to adapt it to their specific needs and trading styles with the trend sensitivity setting. Combining RSI, RVI, and CCI for reversion and exit points is unique as it integrates multiple perspectives on price momentum and volatility, providing a more comprehensive assessment of price exhaustion than using any single indicator. Combining WMA, EMA, and VWMA as bands is beneficial and unique as it blends different averaging methods to offer a more nuanced and adaptive view of market volatility and trend strength.
By integrating these components, it delivers a multifaceted tool that addresses various aspects of market analysis, making it a valuable asset for traders seeking to improve their decision-making process.
Disclaimer
Trading involves substantial risk and is not suitable for every investor. This indicator is designed to assist in decision-making but does not guarantee profits or prevent losses. Always conduct your own research and consider seeking advice from a financial professional.
Butterfly Harmonic Pattern [TradingFinder] Harmonic Detector🔵 Introduction
The Butterfly Harmonic Pattern is a sophisticated and highly regarded tool in technical analysis, utilized by traders to identify potential reversal points in the financial markets. This pattern is distinguished by its reliance on Fibonacci ratios and geometric configurations, which aid in predicting price movements with remarkable precision.
The origin of the Butterfly Harmonic Pattern can be traced back to the pioneering work of Bryce Gilmore, who is credited with discovering this pattern. Gilmore's extensive research and expertise in Fibonacci ratios laid the groundwork for the identification and application of this pattern in technical analysis.
The Butterfly pattern, like other harmonic patterns, is based on the principle that market movements are not random but follow specific structures and ratios.
The pattern is characterized by a distinct "M" shape in bullish scenarios and a "W" shape in bearish scenarios, each indicating a potential reversal point. These formations are identified by specific Fibonacci retracement and extension levels, making the Butterfly pattern a powerful tool for traders seeking to capitalize on market turning points.
The precise nature of the Butterfly pattern allows for the accurate prediction of target prices and the establishment of strategic entry and exit points, making it an indispensable component of a trader's analytical arsenal.
Bullish :
Bearish :
🔵 How to Use
Like other harmonic patterns, the Butterfly pattern is categorized based on how it forms at the end of an uptrend or downtrend. Unlike the Gartley and Bat patterns, the Butterfly pattern, similar to the Crab pattern, forms outside the wave 3 range at the end of a rally.
🟣 Types of Butterfly Harmonic Patterns
🟣 Bullish Butterfly Pattern
This pattern forms at the end of a downtrend and leads to a trend reversal from a downtrend to an uptrend.
🟣 Bearish Butterfly Pattern
In contrast to the Bullish Butterfly pattern, this pattern forms at the end of an uptrend and warns analysts of a trend reversal to a downtrend. In this case, traders are encouraged to shift their trading stance from buy trades to sell trades.
Advantages and Limitations of the Butterfly Pattern in Technical Analysis :
The Butterfly pattern is considered one of the precise and stable tools in financial market analysis. However, it is always important to pay special attention to the advantages and limitations of each pattern.
Here, we review the advantages and disadvantages of using the Butterfly harmonic pattern :
The main advantage of the Butterfly pattern is providing very accurate signals.
Using Fibonacci golden ratios and geometric rules, the Butterfly pattern identifies patterns accurately and systematically. (This high accuracy significantly helps investors in making trading decisions.)
Identifying this pattern requires expertise and experience in technical analysis.
Recognizing the Butterfly pattern might be complex for beginner traders. (Correct identification of the pattern necessitates mastery over geometric principles and Fibonacci ratios.)
The Butterfly harmonic pattern might issue false trading signals. (Traders usually combine the Butterfly pattern with other technical tools to confirm buy and sell signals.)
🔵 Setting
🟣 Logical Setting
ZigZag Pivot Period : You can adjust the period so that the harmonic patterns are adjusted according to the pivot period you want. This factor is the most important parameter in pattern recognition.
Show Valid Forma t: If this parameter is on "On" mode, only patterns will be displayed that they have exact format and no noise can be seen in them. If "Off" is, the patterns displayed that maybe are noisy and do not exactly correspond to the original pattern.
Show Formation Last Pivot Confirm : if Turned on, you can see this ability of patterns when their last pivot is formed. If this feature is off, it will see the patterns as soon as they are formed. The advantage of this option being clear is less formation of fielded patterns, and it is accompanied by the latest pattern seeing and a sharp reduction in reward to risk.
Period of Formation Last Pivot : Using this parameter you can determine that the last pivot is based on Pivot period.
🟣 Genaral Setting
Show : Enter "On" to display the template and "Off" to not display the template.
Color : Enter the desired color to draw the pattern in this parameter.
LineWidth : You can enter the number 1 or numbers higher than one to adjust the thickness of the drawing lines. This number must be an integer and increases with increasing thickness.
LabelSize : You can adjust the size of the labels by using the "size.auto", "size.tiny", "size.smal", "size.normal", "size.large" or "size.huge" entries.
🟣 Alert Setting
Alert : On / Off
Message Frequency : This string parameter defines the announcement frequency. Choices include: "All" (activates the alert every time the function is called), "Once Per Bar" (activates the alert only on the first call within the bar), and "Once Per Bar Close" (the alert is activated only by a call at the last script execution of the real-time bar upon closing). The default setting is "Once per Bar".
Show Alert Time by Time Zone : The date, hour, and minute you receive in alert messages can be based on any time zone you choose. For example, if you want New York time, you should enter "UTC-4". This input is set to the time zone "UTC" by default.

Advanced Fully Reversed Candles with Reversed IchimokuThe "Advanced Fully Reversed Candles with Reversed Ichimoku" indicator is a sophisticated tool designed for traders who seek a unique perspective on market dynamics. This innovative indicator not only reverses the traditional candlestick chart but also inverts the Ichimoku Cloud components, providing a comprehensive view of the market's inverted behavior.
Key Features:
Reversed Candlestick Chart:
The indicator recalculates the OHLC (Open, High, Low, Close) prices by reversing them along the price axis. This means that what typically would be an upward movement is displayed as a downward movement, and vice versa. This reversal provides an alternative view that can help traders identify hidden patterns and potential reversal points that might not be obvious on a standard chart.
Reversed Ichimoku Cloud:
All components of the Ichimoku Cloud indicator are recalculated based on the reversed price data. This includes:
Tenkan-sen (Conversion Line): Reversed based on the highest and lowest prices over the specified period.
Kijun-sen (Base Line): Reversed in a similar manner to the Tenkan-sen, providing a medium-term perspective on price trends.
Senkou Span A (Leading Span A): Reversed to form one boundary of the Kumo (cloud), offering insight into future support and resistance levels.
Senkou Span B (Leading Span B): Reversed to form the other boundary of the Kumo, complementing Senkou Span A.
Chikou Span (Lagging Span): Reversed and plotted backward for additional confirmation of trend direction and strength.
Dynamic Price Range Calculation:
The indicator dynamically calculates the maximum and minimum prices over the last 500 bars (or the available range if fewer bars are present). This ensures that the reversal is always based on the most relevant data, providing accurate and up-to-date visualizations.
Visual Enhancements:
The reversed candlesticks are color-coded for easy interpretation: green for upward movements and red for downward movements, based on the reversed data.
The Ichimoku Cloud is filled with semi-transparent colors to clearly distinguish between bullish and bearish conditions even in its reversed state.
Debugging Aids:
For transparency and accuracy, the indicator plots the maximum and minimum price lines used for the reversal calculations. This allows users to verify the internal workings of the indicator and ensure the reversal logic is correctly applied.
Usage:
This indicator is ideal for advanced traders and analysts who want to explore market behavior from an unconventional angle. By reversing both the candlestick chart and the Ichimoku Cloud, it provides a unique perspective that can uncover new trading opportunities and enhance market analysis.
Customization:
Users can customize the periods for the Tenkan-sen, Kijun-sen, and Senkou Span B, as well as the displacement for the Ichimoku Cloud. This flexibility allows traders to adapt the indicator to their specific trading strategies and timeframes.
Conclusion:
The "Advanced Fully Reversed Candles with Reversed Ichimoku" indicator is a powerful tool that transforms traditional market analysis. By inverting both price movements and key technical indicators, it opens up a new dimension of trading insights, helping traders to see the market in a completely different light.
Parameters:
Tenkan-sen period (default: 9)
Kijun-sen period (default: 26)
Senkou Span B period (default: 52)
Displacement (default: 26)
How to Apply:
Add the script to your TradingView account via the Pine Editor.
Customize the parameters according to your trading strategy.
Analyze the reversed candlestick chart and Ichimoku Cloud to gain unique insights into market trends and potential reversal points.

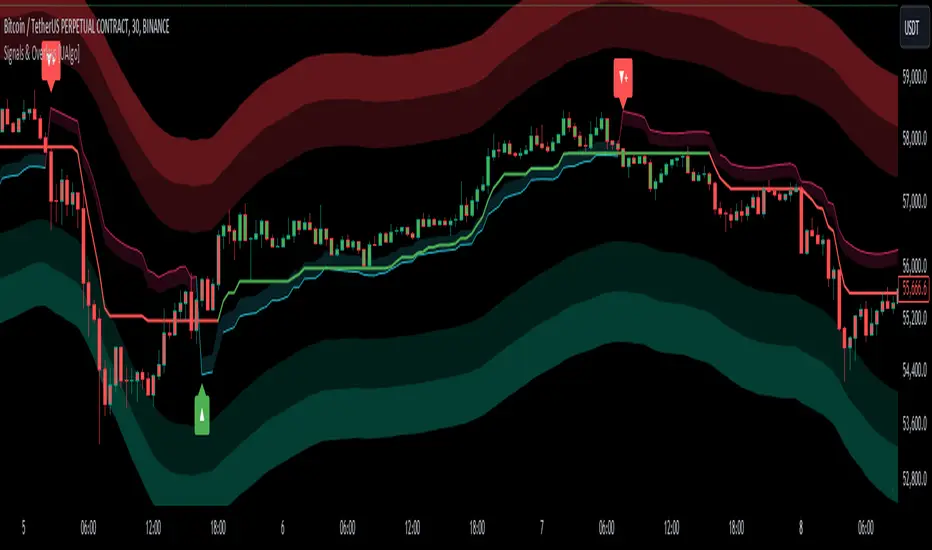
Signals & Overlays [UAlgo]The Signals & Overlays indicator is a comprehensive trading tool designed to provide traders with a holistic view of market conditions. It combines multiple analysis techniques to offer insights into trend direction, potential reversal points, and optimal entry and exit levels. This versatile indicator is suitable for various trading styles and timeframes, also has Beginner-Friendly presets to enable multiple features at once within one-click.
🔶 Key Features:
🔹 Contrarian Signals:
This feature identifies potential trend reversals and market turning points. These contrarian signals are displayed as arrow markers on the chart, alerting traders to possible opportunities that go against the prevailing trend. The signals are based on a combination of price action, momentum, and volatility factors, providing a multi-faceted approach to market analysis.
Customizable Settings :
Signal Sensitivity: Adjustable from 0.1 to 10.0. This controls how sensitive the indicator is to potential reversal signals.
🔹 Reversal Zones:
This feature utilizes statistical methods that compute a smoothed average and associated bands around a data series using Gaussian weights. The Gaussian distribution helps to assign more weight to data points near the center of the window, and the bands represent the average plus/minus a scaled measure of deviation.
This technique is often used in financial analysis to detect trends and measure volatility to identify key areas where price reversals are more likely to occur. These zones providing a dynamic representation of potential support and resistance areas. Traders can use these zones to anticipate potential price reactions and plan their entries and exits accordingly.
Users can also customize the responsiveness of the Reversal Zones through the "Zone Speed" setting. This allows for fine-tuning the model's sensitivity to price changes:
Swift Mode: Quickly adapts to recent price movements, ideal for short-term trading.
Standard Mode: Balances recent and historical data for a medium-term perspective.
Slow Mode: Emphasizes longer-term trends, suitable for position trading.
Customizable Settings :
Zone Data Source: Users can select which price data (open, high, low, close, etc.) to use for zone calculations.
Zone Speed: Choosable between "Swift", "Standard", and "Slow", affecting how quickly the zones adapt to price changes.
🔹 Smart Trail:
The Smart Trail feature provides an adaptive trend-following mechanism. It plots a dynamic line that adjusts based on price action and volatility, helping traders stay in trending moves while providing a trailing stop-loss reference. This feature is particularly useful for managing open positions and optimizing exit points.
🔹 Trend Cloud:
Generates a specialized trend indicator using double-smoothed EMAs applied to closing prices and the high-low price range. It visualizes market trends and volatility by shading the area between different indicator values over time. The color of the shading changes to reflect whether the current trend is strengthening or weakening.
The Trend Cloud feature provides a visually intuitive representation of the overall market trend. It generates a dynamic colored cloud on the chart that helps traders quickly assess the current market direction and strength. Bullish trends represented by blue clouds and bearish trends by red clouds.
🔹 Trend Analyzer:
The Trend Analyzer component provides an in-depth analysis of the current market trend. It uses a customizable moving average system to determine the trend direction and strength. The analyzer can be configured to focus on short-term, medium-term, or long-term trends, allowing traders to align their strategy with their preferred trading timeframe.
Customizable Settings :
Analyzer Calculation Period: Adjustable period for trend analysis calculations.
Analyzer Mode: Selectable between "Short-Term", "Medium-Term", and "Long-Term".
Analyzer Calculation Source: Customizable price data source for trend analysis.
Use Heikin Ashi: Option to use Heikin Ashi candles instead of regular candles for calculations.
🔹 TP/Exit/Entry Levels:
The indicator calculates and displays potential take profit (TP), exit, and entry levels based on market structure and volatility. These levels are marked on the chart, offering traders guidance on optimal points for trade management. This feature can be particularly helpful for setting profit targets and managing risk.
🔹 Dashboard:
The customizable dashboard provides a quick overview of key market metrics. It displays information such as trend strength, volume analysis, market volatility, the current state of the Trend Catcher and the market is "Bearish" or "Bullish". This at-a-glance summary helps traders make informed decisions without the need to switch between multiple indicators.
Customizable Settings :
Toggle: Option to display or hide the dashboard.
Dashboard Position and Size: Selectable between "Top Right", "Bottom Right", and "Bottom Left". Adjustable size to "Tiny", "Small" or "Normal".
🔶 Disclaimer:
Use with Caution: This indicator is provided for educational and informational purposes only and should not be considered as financial advice. Users should exercise caution and perform their own analysis before making trading decisions based on the indicator's signals.
Not Financial Advice: The information provided by this indicator does not constitute financial advice, and the creator (UAlgo) shall not be held responsible for any trading losses incurred as a result of using this indicator.
Backtesting Recommended: Traders are encouraged to backtest the indicator thoroughly on historical data before using it in live trading to assess its performance and suitability for their trading strategies.
Risk Management: Trading involves inherent risks, and users should implement proper risk management strategies, including but not limited to stop-loss orders and position sizing, to mitigate potential losses.
No Guarantees: The accuracy and reliability of the indicator's signals cannot be guaranteed, as they are based on historical price data and past performance may not be indicative of future results.
Trend Tide Oscillator [UAlgo]🔶 Description:
The "Trend Tide Oscillator " is a technical analysis tool designed to identify potential trend reversals and overbought/oversold conditions in the market. It calculates an oscillator based on the Commodity Channel Index (CCI) and then applies smoothing techniques to provide a clearer view of market momentum.
🔶 Key Features:
Oscillator Calculation : The indicator calculates an oscillator based on the Commodity Channel Index (CCI), which is a momentum-based oscillator used to identify overbought and oversold conditions.
Smoothing : Smoothing techniques are applied to the oscillator to reduce noise and provide a clearer view of market momentum. This helps traders in identifying trends more effectively.
Support and Resistance Zones : The indicator plots support and resistance zones based on the highest and lowest values of the oscillator over a specified lookback (default 50) period. These zones can help traders identify potential areas of price reversal. The indicator considers volatility when plotting the support and resistance zones. This aims to create more adaptable levels that account for fluctuating market conditions.
Visualization : The indicator visually represents overbought and oversold conditions with shapes (⚠️), aiding traders in quickly identifying potential entry or exit points.
Customization : Users can adjust parameters such as oscillator length, smoothing, and overbought/oversold levels, support and resistance lookbacks according to their trading preferences.
🔶 Disclaimer :
This indicator is provided for informational and educational purposes only and should not be considered as financial advice. Trading in the financial markets involves risk, and users should conduct their own research and analysis before making any investment decisions.

QQE Weighted Oscillator [LuxAlgo]The QQE (Quantitative Qualitative Estimation) Weighted Oscillator improves on its original version by weighting the RSI based on the indications given by the trailing stop, requiring more effort in order for a cross with the trailing stop to occur.
🔶 USAGE
The QQE Weighted Oscillator is comprised of a smoothed RSI oscillator and a trailing stop derived from this same RSI. The oscillator can be used to indicate whether the market is overbought/oversold as well as an early indication of trend reversals thanks to the leading nature of the RSI.
Using higher Factor values will return a longer-term trailing stop.
Like with a regular RSI divergence can be indicative of a reversal.
Further weighting will control how much "effort" is required for the trailing stop to cross the RSI. For example. For example, an RSI above the trailing stop will require a higher degree of negative price variations in order for a potential cross to occur when using higher weights.
This can cause higher weightings to return more cyclical and smoother results.
🔶 SETTINGS
Length: Length of the RSI oscillator.
Factor: Multiplicative factor used for the trailing stop calculation.
Smooth: Degree of smoothness of the RSI oscillator.
Weight: Degree of weighting used for the RSI calculation.

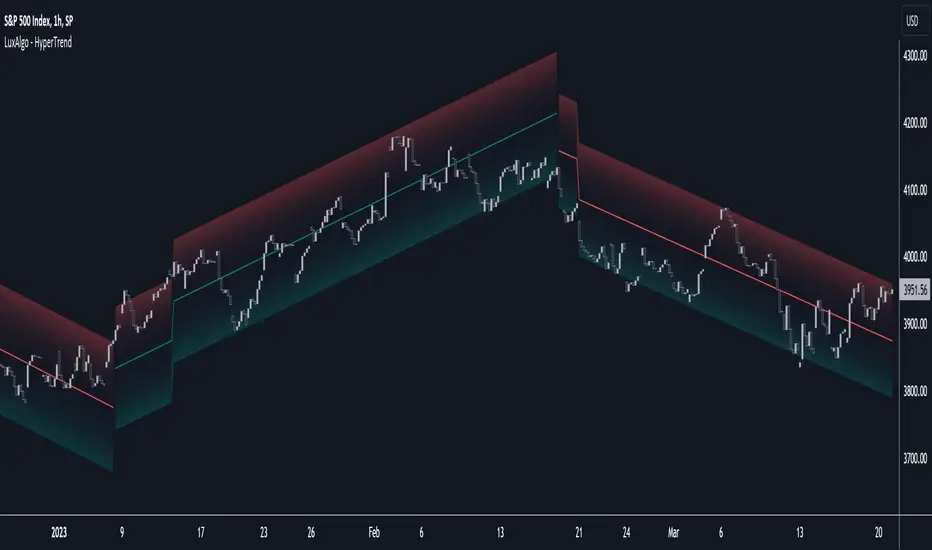
HyperTrend [LuxAlgo]The HyperTrend indicator aims to provide a real-time estimate of an underlying linear trend in the price. Support and resistance extremities are constructed from this estimate which can provide trade opportunities within the overall trend.
Most tools that return lines on a chart are either subject to backpainting or repainting. We aimed to provide a reliable real-time method to estimate linear trends in the price, enhancing traders' decision making processes when it comes to trading trends in price, hence the term 'HyperTrend'.
🔶 USAGE
Users can use the HyperTrend to easily determine the trend direction in the price, with an average sloping upward indicating an uptrend, and an average sloping downward indicating a downtrend.
The channels upper extremity can act as a resistance, while the lower extremity can act as a support. Contact with candle wicks can signal timely reversals/retracements.
Using a higher "Multiplicative Factor" value will return less frequent new channels, and is suitable to analyze longer-term trends. The slope settings on the other end allow us to control the slope of the returned channels, with higher values returning flatter results (similar to our previously posted predictive ranges).
🔹 Channel Average
The channel average can return an estimate of the current (and future) trend in the price, the chart below shows an interval where a linear regression is displayed alongside the channel average:
Unlike the linear regression, the average does not have any lookahead bias, this of course comes at the price of accuracy in most cases.
Users can also use this average as a support or resistance. The breakout of a TC average that has been tested multiple times can be considered more significant in suggesting a trend reversal.
🔶 SETTINGS
Multiplicative Factor: Control the allowed degree of deviation of the price from the average line. Higher values will return less frequent new channels.
Slope: Controls the steepness of the returned lines. Higher values will return flatter results.
Width %: Width percentage of the channel. Lower results will return narrower channels.
Algo Targets [Premium]The Algo Targets indicator includes a suite of tools that attempt to identify market maker liquidity targets in advance.
These levels can be used by traders to determine:
1. future support/resistance
2. entries/exits
3. directional bias
4. potential reversal levels
5. pullback targets
The script uses a proprietary prediction model based on specific candle sequences, historical moves and volatility projections.
These tools have been live tested across a variety of instruments and timeframes, but should be backtested against your preferred ticker for best performance.
Primary Features:
1. Anchors
Anchors are derived from a simple, but powerful, three-candle breakout pattern. We have found that this pattern, when combined with the relative position to previous Anchor patterns on the chart, gives us clues to predicting future price structure.
Common use case: The simplest way to trade Anchors is to know that price *almost always* makes a return visit. This can be a useful tool for reversal traders. Additionally, Anchors often occur just before strong directional momentum. This can be useful for trend traders looking for entry signals.
Power User feature: Projected Ranges can be enabled in Settings. Each Anchor provides a Retracement leg (measured as the midpoint between the last two Anchors) and an Expansion leg (measured as twice the size of the Retracement leg, projected in the opposite direction). If Projected Ranges are enabled, the directional bias is also highlighted within the range, making it easy to spot at a glance.
Caveats: Expansion legs require patience and solid risk management. Additionally, the Expansion leg contains an additional Trigger level which price MUST cross before we consider the Expansion leg to be "in play" as a valid price target. This Trigger is marked on each Expansion legs as a dotted line.
Please note, Anchors require a 3 candle lookback before they are printed to the chart.
2. Target Zones
Target Zones are an advanced feature, and can be enabled in the Settings panel.
Each Target Zone consists of three levels:
Trigger — This the level closest to the current price. We expect it to act as a support/resistance level until price breaks through.
Target — This is the level farthest from the price. This is how far price is likely to move AFTER crossing the Trigger.
Midpoint — This is the level between the Trigger and Target. If price enters a Target Zone and wicks off of the Midpoint line, it’s usually a reversal signal. In this case we would cut our trade, consider the Target “filled” and potentially enter a reversal trade.
Common use case: When prices crosses a Trigger into a Target Zone, we consider that Target level to be “unlocked.” Our expectation is that price will gravitate toward the Target.
Power User feature: There are many strategies that a trader can build around Target Zones. One of our favorites is to use Targets strictly as reversal entries. On ranging days, price will often wick off of a Target level, before making a quick move in the opposite direction.
Caveats: After a Target is unlocked, it may be reached within the next few bars, or it may be saved by the market algorithms for later. Keep an eye on the Midpoint for potential reversals, and as always, proper risk management is key.
IMPORTANT: The presence of a Target Zone on the chart is neither bullish not bearish by itself. We consider the Target to be in play if, AND ONLY IF, price has crossed the Trigger level.
3. Pullback Levels
Pullback Levels are algorithmically detected return levels. They usually act as a strong draw on price, and often appear just before a pullback in price.
Common use case: The simplest way to use Pullbacks is to look for ones that have not been filled, either from a previous day or in after-hours/pre-market. We use them for confirmation bias along with Anchors and unlocked Targets.
Power User feature: For day trading, we set Alerts on our favorite tickers for any detected Pullbacks on the 5 min chart. This usually gives us plenty of time to review the chart for a possible day trade entry.
Settings:
All features are customizable, including color, line length and visibility. This lets you keep your chart as clean as you like, while only displaying additional data when it is needed.
Alerts:
Alerts can be set for all features, with the ability to set bearish and bullish alerts separately, depending on your trading preference. It is recommended to use "Once Per Bar Close" when you create an alert.

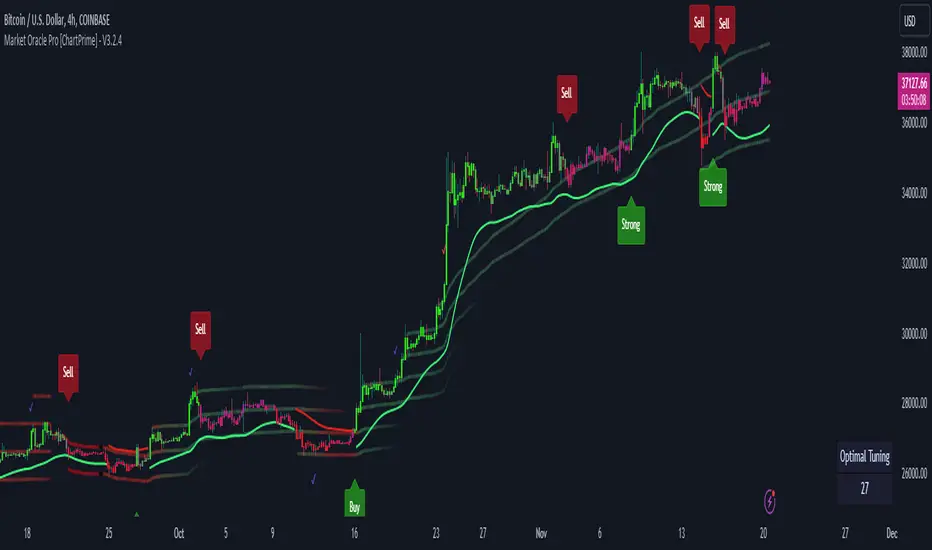
Market Oracle Pro [ChartPrime]ChartPrime Oracle Pro combines actionable, elegant and functional indicators into a single toolkit. Combinations of both trend following and contrarian logic aim to provide traders with a deeper insight into market movements; aiming to assist in better entries and exits.
Designed and created by the ChartPrime team, peacefullizard (digital signal processing expert), Gecko, and ExoMaven, this toolkit takes deeper level theory and expresses it in a useable format for traders. ChartPrime Oracle Pro is designed to satisfy and cover major trading theories allowing the user to pick and select the features that fit them.
When using any indicator suite it is important to understand these tools are there to assist trading rather than to be a single source of truth. Functionality such as Auto Maximization of parameters is there to guide and enhance user experience, however it is important to be aware of overfitting results.
Features included & Use cases:
Signal Mode: Select the type of assistive signals you are requiring. Provided are both trend following signals with self optimization using backtest results as well as reversal signals, aiming to provide real time tops and bottoms in markets. Both these signal modes can be fine tuned using the tuning input to refine signals to a trader's liking. The ChartPrime Auto Maximizer will automatically apply a backtested parameter and display the "best performing signals" on your chart. It is important to note this is not indicative of future results. ChartPrime Trend Signals leverage audio engineering inspired techniques and low-pass filters in order to achieve and attempt to produce lower lag response times and therefore is designed to have a uniqueness when compared to more classical trend following approaches.
Candle Highlighting: Choose between a clean gradient or more classical red/green coloring. These color the candles to assist with trend identification.
ChartPrime Dashboard: This cleanly designed dashboard provides 3 simple to interpret metrics. Firstly, the Optimal Tuning box provides a backtested result giving you the most accurate input. Again, it is important to note this is not indicative of future results. A Prime Score is also provided. This metric is a collection of ChartPrime trend following indicators bundled into a single item. It ranges from 0 (being very bearish trend) to 10 (being a very bullish trend). 5 would indicate a ranging market. A consolidation score is also provided showing how "ranging" the market is. 10 being a low volatility and consolidating market and 0 being a more volatile and trending market which can assist the trader in avoiding ranges (if undesired).
Additional Features:
The Dynamic Reactor provides a simple band passing through the chart. This can provide assistance in support and resistance locations as well as identifying the trend direction expressed via green and red colors. Taking a moving average and applying unique adaptivity calculations gives this plot a unique and fast behaviour.
The Prime Ranges provide VWAP inspired real time actionable ranges on your chart. These ranges provide support and resistance levels as well as coloring, once again, there to aid trend identifcation. By generating a distribution and projecting it we produce real time levels for traders.
Candlestick structures analyze candlestick formation putting a spin on classical candlestick patterns and provide the most relevant formations on the chart. These are not classical and are filtered by further analyzing market activity. A trader's classic with a spin.
The Momentum Wave Bands provide classical areas of high deviation where the price may reverse. It also provides additional insight on trend direction and volatility.
The Prime Trend Assistant provides a trend following dynamic support and resistance level. This makes it perfect to use in confluence or as a filter for other supporting indicators. This is an adaptive trend following system designed to handle volatility leveraging filter kernels as apposed to low pass filters.
Settings:
Signal Mode: Drop down to select the types of signals wanted
Tuning: Integer input to adjust signal's responsiveness. Lower inputs result in more frequent signals being produced.
Auto Maximizer Toggle: Automatically apply a backtested parameter to the signals
Dashboard Size: Drop down to select the size of the dashboard
Dashboard Position: Change the location of the dashboard on your chart
Additional Features: A set of toggles turning on/off these indicators.
Example Usecases:
Trend based confluences:
ChartPrime Oracle Pro provides classical (all be-it self optimizing) trend based signals. When trading, taking into consideration other forms of confluences are crucial. Take the image below: Here we see a *uptrend* where smaller retracements in price action are resulting in sell signals. When identifying a trend, analyzing the macro and micro price action can help the trader deduce how relevant a move in the market may be. We can use the Prime Trend Assistant to help filter out said retracements. We are also able to use the Prime Ranges in a similar way.
Features such as the Prime Ranges have duplicate usecases whereby a trend can be idenfied via the color of the bands as well as providing TP/SL levels. Considering these assisting features is vital before entering a trade.
Contrarian trading methodologies:
Commonly; trading with a trending market is most well known. However; markets are just as susceptible to ranging behaviors. ChartPrime has designed this toolkit to cater to most market conditions. For example, finding confluence between reversal indicators such as our contrarian signals and the momentum wave band can provide for some very strong confluence that can help a trader attempt to enter at bottoms of retracements and achieve the best possible entries or exits.
Developing confluences as shown above can be key to a trader's success. It is import ant to avoid biases when looking at indicators and view the market as objectively as possible.
ChartPrime believe that there is no magic indicator that is able to print money. Indicator toolkits provide value via their convinience, adaptibility and uniqueness. Combining these items can help a trader make more educated; less messy, more planned trades and in turn hopefully help them succeed.
Risk Disclaimer
All content and developments created by ChartPrime are purely for informational & educational purposes only. Past performance does not guarantee future results.
Script pago
Trend Reversal DetectionIntroducing the "Trend Reversal Detection" indicator, a sophisticated and user-friendly script that utilizes the PeacefulIndicators library to identify potential trend reversals in the market. This indicator is designed to help you stay ahead of market changes and enhance your trading analysis.
The Trend Reversal Detection indicator offers the following features:
Customizable input parameters, allowing you to adjust the Rate of Change (ROC) length, Moving Average (MA) length, and MA type (SMA, EMA, or WMA) according to your trading preferences and style.
A visually intuitive display, using orange and blue markers to indicate potential trend reversals, making it easy to interpret the indicator's signals.
The core functionality of the Trend Reversal Detection indicator is powered by the trendReversalDetection function from the PeacefulIndicators library, ensuring accurate and reliable reversal detection.
To start using the Trend Reversal Detection indicator in your trading analysis, simply add the script to your chart and customize the input parameters as needed. We hope this script, built upon the PeacefulIndicators library, proves to be a valuable addition to your trading strategy.

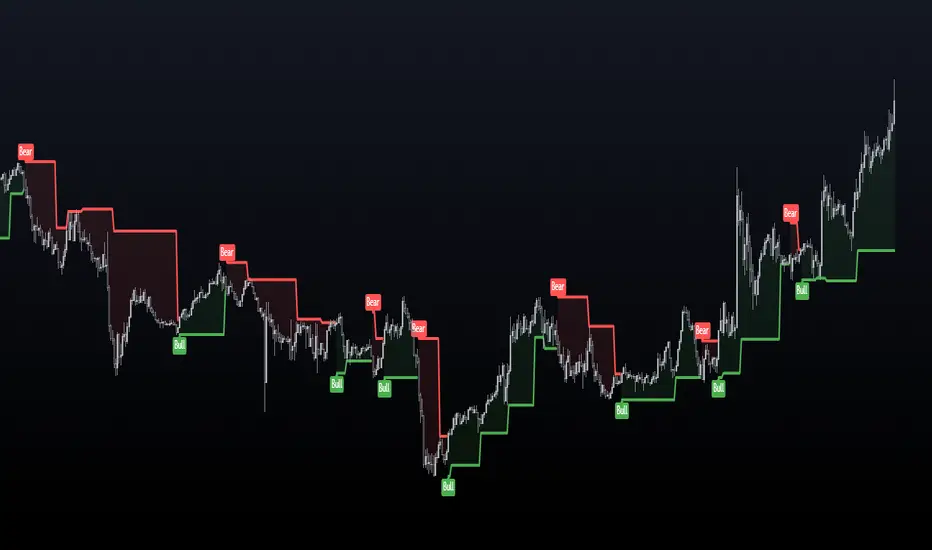
Sushi Trend [HG]🍣 The Sushi Roll, a trading concept conceived at a restaurant by Mark Fisher.
While the indicator itself goes by Sushi Trend, it is completely backed by the idea of Mark Fisher's Sushi Roll Reversal Pattern. No, it has nothing to do with raw fish, it just so happens that somebody was ordering sushi during the discussion of the idea, and that's how it got its name.
📝 Origin
First mentioned in his book, The Logical Trader --- the idea of the Sushi Roll is to serve as an early warning system to identify reversals in the market. Fisher defines the pattern as a series of 10 bars, split into two different sections, seen as 5 and 5. In order for the pattern to be emitted, the 5 bars to the right must completely engulf the 5 bars to the left. It's not a super complex system and is in fact extremely simple to grasp.
📈 Supertrend Similarities
Instead of displaying the pattern in the way Fisher meant for it to be portrayed (as seen in the photo above), I instead turned it into an indicator similar to that of Supertrend while also inheriting the same concepts from the pattern. I did this because the pattern itself has inconsistencies which can be quite noticeable when trading with it after a while. For example, these patterns can occur even during consolidating periods, and even though the pattern is meant to be recognized during trending markets, the engulfing bars can sometimes be left with indecisive directions.
➡️ The Result
Here is the result, visualized to be better in a trending format. (The indicator will not contain the boxes.)
While Fisher does mention the pattern to include 10 bars, you can actually use this pattern with any number of bars. At the end of the day, it's a concept derived from a discussion at a Japanese restaurant, and a pattern that has been around for years that has seen results. Due to this, I added an input option to control the series of bars for right-bar engulf detection.
To reassure the meaning of the pattern --> "A series of 10 bars" means 5 left bars and 5 right bars. So if you want to check if 5 right bars are engulfing the previous 5 bars (as seen in the photo above), you would want to select 5 in the input settings.
You can learn more about it from the following links
Market Reversals and the Sushi Roll Technique
The Logical Trader
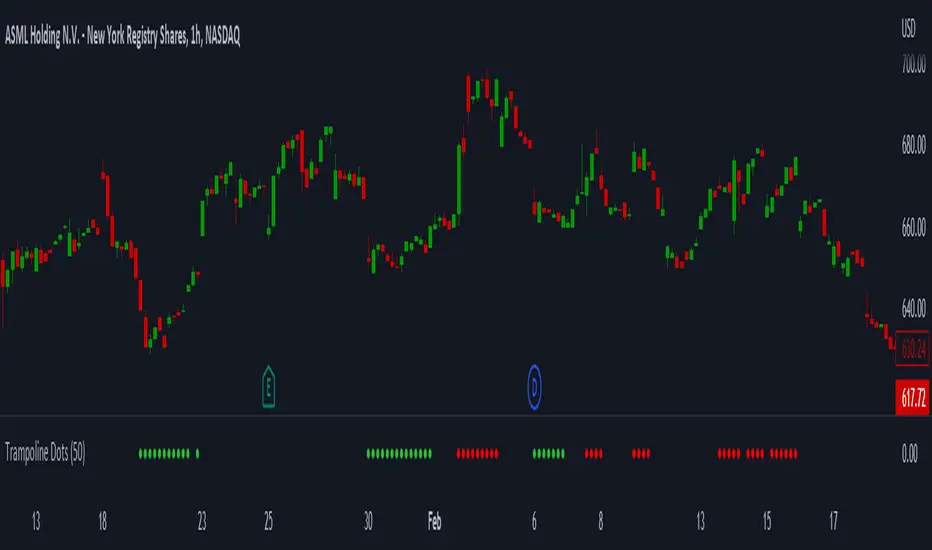
Trampoline DotsTrampoline Dots (Price Divergence)
Higher Time Frame Price Divergence:
Trampoline Dots serve as a "quick bounce" tool. These little dots will trigger whenever the higher aggregation MACD is above / below zero and the price is below / above the 50 period simple moving average. When these criteria are met, the price is usually under pressure of strong divergence, more often than not price will sharply reverse into the trend direction usually within the next few bars.
The Use of The Trampoline Dots:
This indicator can serve multiple ways. Obviously the main use case is the price divergence. These "dots" will not give you any precise & exact entry. But rather a zone of possible incoming reversal. There is no timing to it. All these dots will do is warn you about potential sharp reversal in the upcoming bars. It can be used by itself alone for sure, but the best way to utilize the dots is to use them in combination of other trend or momentum studies. The best signals are the ones that are within the larger time frame trend. Another great thing is that the visuals are really straight-forward and simple. It is either green dot or a red dot. Nothing more, nothing less. Also since the indicator is pretty small, it can be easily layered onto other studies as well which can create an additional confirmation for different patterns or setups.
Which Time Frame Are Reliable?
This indicator works on any time frame. But the most "stable" one is the daily & hourly time frame. My personal favorite is the hourly since these divergences can produce amazing entries in the daily trends (which are usually hidden on the daily chart). In the most aggresive trends, I like to see the green dots triggering around the 8 EMA and 13 EMA. Daily chart can show the daily and weekly (big divergences) that can take multiple days & weeks to resolve.
Hope it helps.
Nadaraya-Watson: Envelope (Non-Repainting)Due to popular request, this is an envelope implementation of my non-repainting Nadaraya-Watson indicator using the Rational Quadratic Kernel. For more information on this implementation, please refer to the original indicator located here:
What is an Envelope?
In technical analysis, an "envelope" typically refers to a pair of upper and lower bounds that surrounds price action to help characterize extreme overbought and oversold conditions. Envelopes are often derived from a simple moving average (SMA) and are placed at a predefined distance above and below the SMA from which they were generated. However, envelopes do not necessarily need to be derived from a moving average; they can be derived from any estimator, including a kernel estimator such as Nadaraya-Watson.
How to use this indicator?
Overall, this indicator offers a high degree of flexibility, and the location of the envelope's bands can be adjusted by (1) tweaking the parameters for the Rational Quadratic Kernel and (2) adjusting the lookback window for the custom ATR calculation. In a trending market, it is often helpful to use the Nadaraya-Watson estimate line as a floating SR and/or reversal zone. In a ranging market, it is often more convenient to use the two Upper Bands and two Lower Bands as reversal zones.
How are the Upper and Lower bounds calculated?
In this indicator, the Rational Quadratic (RQ) Kernel estimates the price value at each bar in a user-defined lookback window. From this estimation, the upper and lower bounds of the envelope are calculated based on a custom ATR calculated from the kernel estimations for the high, low, and close series, respectively. These calculations are then scaled against a user-defined multiplier, which can be used to further customize the Upper and Lower bounds for a given chart.
How to use Kernel Estimations like this for other indicators?
Kernel Functions are highly underrated, and when calibrated correctly, they have the potential to provide more value than any mundane moving average. For those interested in using non-repainting Kernel Estimations for technical analysis, I have written a Kernel Functions library that makes it easy to access various well-known kernel functions quickly. The Rational Quadratic Kernel is used in this implementation, but one can conveniently swap out other kernels from the library by modifying only a single line of code. For more details and usage examples, please refer to the Kernel Functions library located here:

Average Daily Range (ADR) (Multi Timeframe, Multi Period)Average Daily Range (ADR)
(Multi Timeframe, Multi Period, Extended Levels)
Tips
• Narrow Zones are an indication of breakouts. It can be a very tight range as well.
• Wider Zones can be Sideways or Volatile.
What is this Indicator?
• This is Average Daily Range (ADR) Zones or Pivots.
• This have Multi Timeframe, Multi Period (Up to 3 Levels) and Extended Target Levels.
Advantages of this Indicator
• This is a Leading indicator, not Dynamic or Repaint.
• Helps to identify the reversal points.
• The levels are more accurate and not like the old formulas.
• Can practically follow the Buy Low and Sell High principle.
• Helps to keep minimum Stop Loss.
Who to use?
• Highly beneficial for Day Traders
• It can be used for Swing and Positions as well.
What timeframe to use?
• Any timeframe.
When to use?
• Any market conditions.
How to use?
Entry
• Long entry when the Price reach at or closer to the Green Support zone.
• Long entry when the Price retrace to the Red Resistance zone.
• Short entry when the Price reach at or closer to the Red Resistance zone.
• Short entry when the Price retrace to the Green Support zone.
• Long or Short at the Pivot line.
Exit
• Use past ADR levels as targets.
• Or use the Target levels in the indicator for breakouts.
• Use the Pivot line as target.
• Use Support or Resistance Zones as targets in reversal method.
What are the Lines?
Gray Line:
• It the day Open or can be considered as Pivot.
Red & Green ADR Zones:
• Red Zone is Resistance.
• Green Zone is Support.
• Mostly price can reverse from this Zones.
• Multiple Red and Green Lines forms a Zone.
• These lines are average levels of past days which helps to figure out the maximum and minimum price range that can be moved in that day.
• The default number of days are 5, 7 and 14. This can be customized.
Red & Green Target Lines:
• These are Target levels.
What are the Labels?
• First Number: Price of that level.
• Numbers in (): Percentage change and Change of price from LTP (Last Traded Price) to that Level.
General Tips
• It is good if Stock trend is same as that of the Index trend.
• Lots of indicators creates lots of confusion.
• Keep the chart simple and clean.
• Buy Low and Sell High.
• Master averages or 50%.

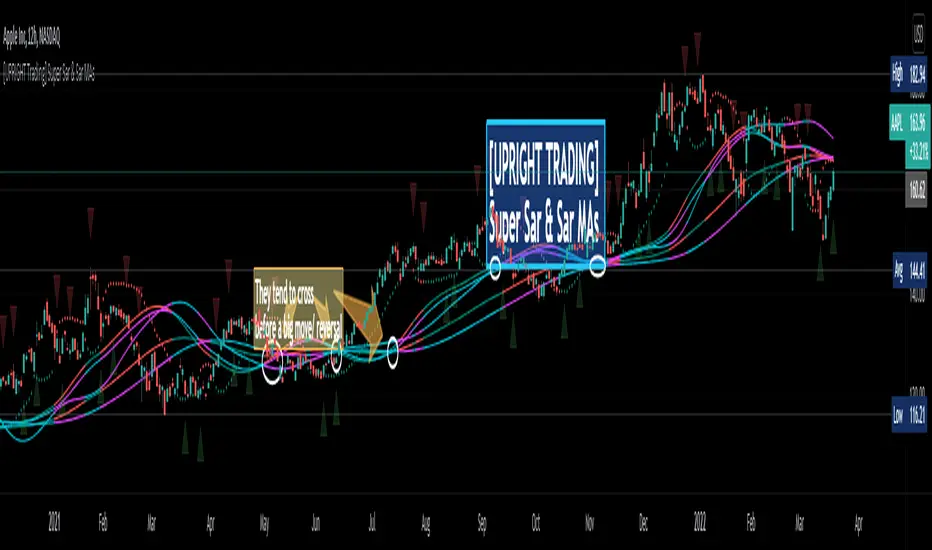
[UPRIGHT Trading] Super Sar & (New) Sar Moving Averages (cc)Hello Traders,
(This is an original creation and a proof of concept.)
As most of you know the PSAR, parabolic SAR indicator, was developed by J. Welles Wilder Jr. and used to determine trend direction and potential reversals in price. This technical indicator uses a trailing stop and reverse method, 'SAR,' or "stop and reverse," to find potential exit and entry points.
My question was: Is it possible to create meaningful Moving Averages by using PSAR?
Turns out, the answer is yes.
As you can see on the above chart, not only is it possible, it does work.
Features:
I've created buy/sell signals, which act as early indication of a potential reversal.
5 original MAs.
My Super Sar
Customizability: For now, the ability to adjust the length and turn on/off the MAs (maybe more features to come).
Enjoy!
As always, please: Like, Follow, Support, etc...
Cheers,
Mike
(UPRIGHT Trading)
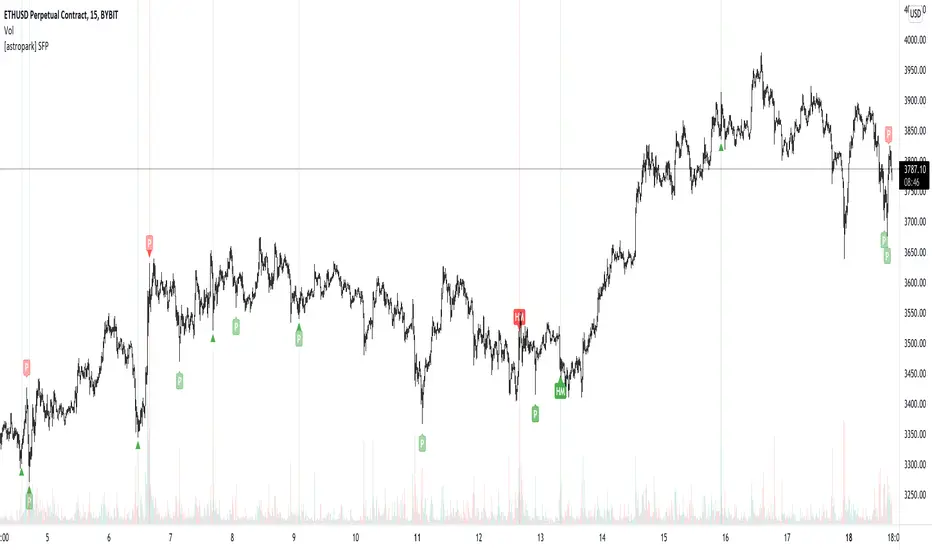
[astropark] SFP - Swing Failure PatternDear Followers,
today I'm glad to present you my Swing Failure Pattern Analyzer indicator.
As you know, the Swing Failure Pattern (SFP) is a very powerful candlestick pattern, because it highlights trend reversal points : if trend changes you want to know it, right?
This indicators highlights for you both Tops and Bottoms , that may be just local or historical.
To build this tool I mixed my experience on the field and some of the logic you can see in the following indicators of mine:
Pinbar that matters
Volume that matters
Volume Analyzer
This indicator works on every timeframe and market , it's quite responsive to market movements so it's especially good on volatile markets.
It is designed for fast day-trading / scalping , but as you trade on high timeframes is great for swing trades.
The indicator identifies candles that fall into the Swing Failure Patter category, but also candles other 4 categories of reversal candlestick pattern:
pinbar / hammer
hanged man
reversal by volume analysis
reversal by candle wicks analysis
Of course you can
customize colors
turn on or off what you prefer to see and what you don't
set alerts everything you see plotted
The indicator does NOT repaint of course.
This is a premium indicator , so send me a private message in order to get access to this script.
Folded Relative Strength Index [CC]The Folded Relative Strength Index was created by Richard Poster (Stocks and Commodities July 2021 pg 21) and this indicator provides both trend strength but also momentum and of course reversal points using the overbought and oversold markers. If the indicator line is above the mid line then this shows upward momentum and when it falls below the midline then this means it is losing momentum. When the indicator rises above the signal line then this shows upward trend strength and vice versa. Buy when the indicator line turns green and sell when it turns red.
Let me know if there are any other indicators you would like to see me publish!

ArcTan Oscillator [LuxAlgo]The following indicator is a normalized oscillator making use of the arc tangent sigmoid function (ArcTan), this allows to "squarify" the output result, thus visually filtering out certain variations originally in the oscillator. The magnitude of this effect can be controlled by the user. The indicator contains a gradient that shows the possibility of a reversal, with red colors indicating that a reversal might occur.
Settings
Length : Period of the oscillator
Pre-Gain : Changes the amplitude of the oscillator before passing through the ArcTan function, this allows to amplify/reduce the "squarification" effect introduced by this function. In order to make it easier for the user, the setting is in a (-10,10) range, with negative values reducing the amplitude and positive one increasing it.
Src : Source input of the indicator
Usage
The oscillator can be used to determine the direction of the trend by looking at its sign, if the oscillator is positive, market is up-trending, else down-trending, based on this usage the user might not be interested to look at every variations produced by the oscillator, this is where the hyperbolic tangent function and pre-gain setting can be useful, by using an high value of pre-gain the user will be able to only focus on the sign of the oscillator.
Here pre-gain is set to 5, we can see that the oscillator is now easier to visualize. However, the use of sigmoid functions remove useful information for a trader that needs to find divergences, this is where using a negative value of the pre-gain setting will result useful.
Here pre-gain is set to -5.
The indicator makes use of a gradient to show potential reversals, this gradient is determined by the correlation between the oscillator and the price (this is a way to measure potential divergences). If the color is closer to red it means that a potential reversal might occur, it is possible to say in which direction price might go by looking at the sign of the oscillator, so if the gradient is red and the oscillator is negative price might rise. The gradient is not affected by the pre-gain setting.

HTF Candlestick Patterns [TradingView] vX by DGTCandlesticks are graphical representations of price movements for a given period of time. They are commonly formed by the opening, high, low, and closing prices of a financial instrument. They have their origins in the centuries-old Japanese rice trade and have made their way into modern day price charting.
It’s important to note that candlestick patterns aren’t necessarily a buy or sell signal by themselves. They are instead a way to look at market structure and a potential indication of an upcoming opportunity. It is always useful to look at candlestick patterns in context like any other market analysis tool and candlestick patterns are most useful when used in combination with other techniques. There are countless candlestick patterns that traders can use to identify areas of interest on a chart, where some candlestick patterns may provide insights into the balance between buyers and sellers, others may indicate a reversal, continuation, or indecision.
Reversal patterns are quite useful when used in context. Reversal patterns should form at the bottom of a downtrend or at the top of an uptrend. Otherwise, they are not a reversal patterns, but continuation patterns. Most reversal patterns require confirmation such as price move in the direction of reversal accompanied by appropriate trading volume. The reversal patterns can further be confirmed through other means of traditional technical analysis—like trend lines, momentum, oscillators, or volume indicators—to reaffirm buying or selling pressure. The patterns themselves do not guarantee that the trend will reverse. Investors should always confirm reversal by the subsequent price action before initiating a trade.
This study implements some of the most commonly used candlestick patterns in a context with directional movement indicator. On request users can adjust the strong trend threshold from dialog box, eighter can disabled correlation with directional movement indicator. To add additional sight to analysis the simple moving averages of 20, 50, 100 and 200 periods are added (configurable)
You may add additional indicators of your choice. Colored DMI, BB Cloud or Price Distance to its MAs may help
Enjoy it!
Disclaimer: The script is for informational and educational purposes only. Use of the script does not constitutes professional and/or financial advice. You alone the sole responsibility of evaluating the script output and risks associated with the use of the script. In exchange for using the script, you agree not to hold dgtrd tradingview user liable for any possible claim for damages arising from any decision you make based on use of the script
