Pesquisar nos scripts por "bollingerband"

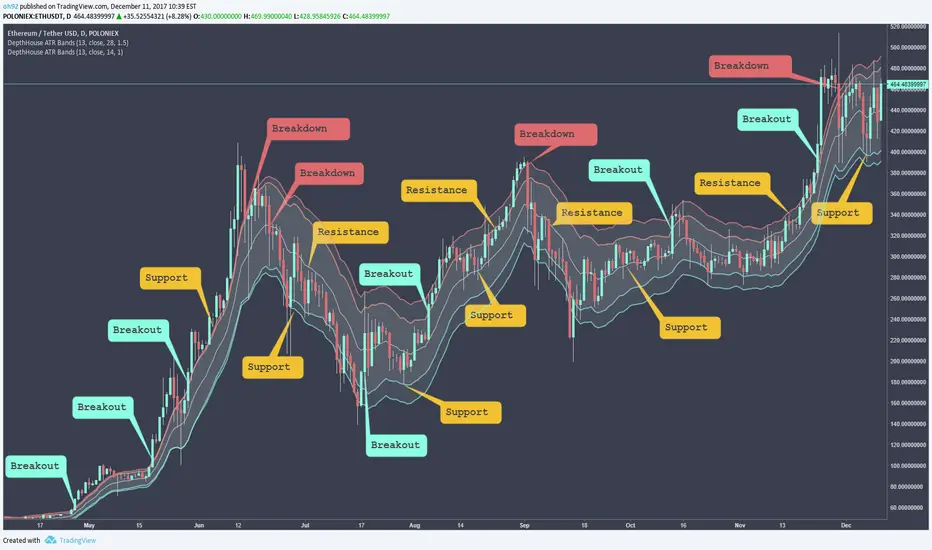
DepthHouse - ATR BandsDepthHouse ATR Bands is a FREE INDICATOR
Similar to the well-known Bollinger Bands.
Instead of using the standard deviation formula, ATR Bands determines the size of the bands based on the adjustable average range.
IF you use this FREE Indicator:
Please like and comment!
Check out my channel on YouTube! youtu.be
Bitcoin and Ethereum Donations are always appreciated :)
BTC : 1MLnVPqebcFTqYEVAKm9dSCRWhyNDmAb5W
ETH : 0xEEcD7Ce6E22AfA6083074c4CCd326Be0b1C932d9
How to use:
The bands tighten while the markets’ range becomes lower, and widens as its' range becomes broader. Giving the indicator a loaded spring effect.
A break outside of the bands in either direction indicates a possible breakout.
All 3 bands serve as possible support and/or resistance. Meaning breaks back into the bands could indicate a reversal, or end of the breakout.
This indicator is completely customizable, so compiling multiple sized bands on top of each other may create a strong competitive edge.
--
IF YOU SUBSCRIBED
This indicator was intended to be available for purchase Jan 2018.
However, with recent change of mind I have decided to make it free to use.
IF you previously subscribed. I greatly appreciate your interest and I hope you enjoy this now FREE indicator!
Once again, thank you!
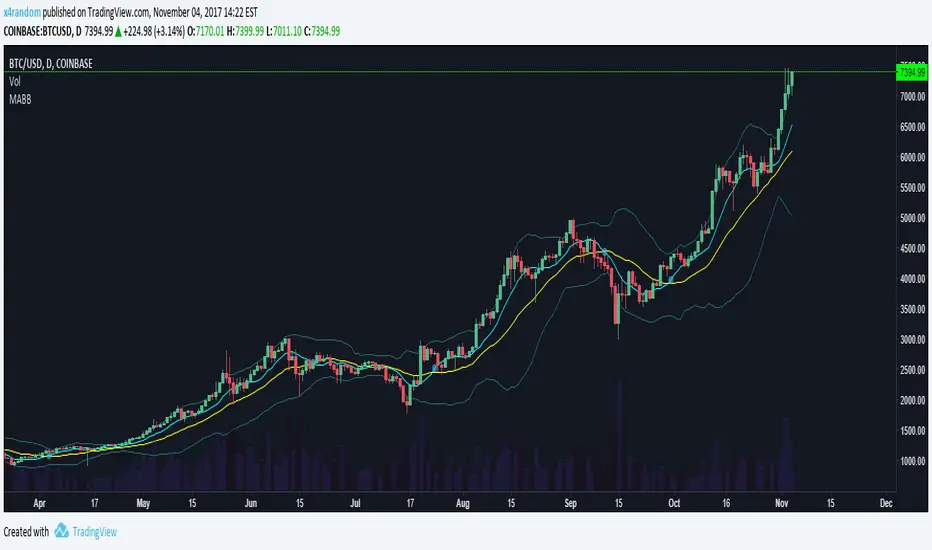
Moving Average Cross & Bollinger BandsPut this together for users using the free version of tradingview. Combines MA Cross and Bollinger Bands into one indicator.

double bollinger bandssimple, yet effective tool to catch reversals for short-term binary options trading.
Combo Indicator V2This is an updated version of the Combo Indicator I previously published. It combines Bollinger Bands, 3 moving averages and 1 exponential moving average all into one chart. I use this indicators on most of my charts so wanted an easy way of combining them all.
SPECIAL BONUS
This indicator also includes a common Bollinger Band trading strategy built in. It was developed with options trading in mind for members over at OptionsPlayers.com. It tries to detect when the BB tunnel tightens, and then triggers an entry position when it detects the breakout. No strategy is 100% accurate, and there are some false positives, but it seems to work fairly well. However, do your own due diligence and use at your own risk.
The strategy can be turned on using a checkbox in the properties.

[Alerts] - Moving Average Cross and/or Bbands botThis is the alert script for :
We've included the basic alert syntax for Autoview automation. You can learn more about the syntax here: autoview.with.pink and you can watch this video here: www.youtube.com
These settings are set, by default, to the lowest contracts allowed by Bitmex (at the time of this posting) to avoid a spam account.
You can learn more about Autoview here:
autoview.with.pink
Get your invite and join us in slack here:
slack.with.pink

Abramov_V3 + MA + Price Channel + Sup_Res_level + B_bandsPrimarily for binary options
Multicurrency
Timeframe 5 minutes +
This indicator includes:
1. Bollinger waves 3 levels - on / off
2. Moving averages 2 pieces - on / off
3. Price channel - on / off
4. Day support and resistance level - on / off
5. The main support and resistance level for 120 minutes - on / off
Any of the indicators is configurable.
The optimal settings are made by default.
This indicator is suitable for several strategies.
Access on request.
I separately recommend the indicators:
1. Abramov_RSI (my script)
2. Lin reg (2, -2, 100, close)
When working with this indicator, it is necessary to avoid news and sharp surges in the market
For access, write to me in private messages

Bollinger Bands ExplorerThis chart is an approximation of how Gunbot does the BB strategy in version 3.3.2.
Part of a pack with:
EMA envelope:
Stepgain simulator:
Stepgain explorer:

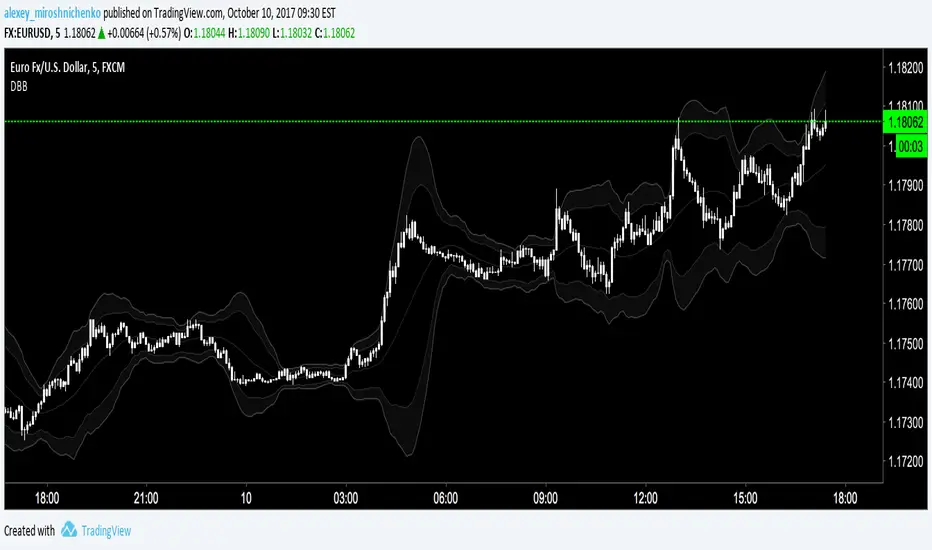
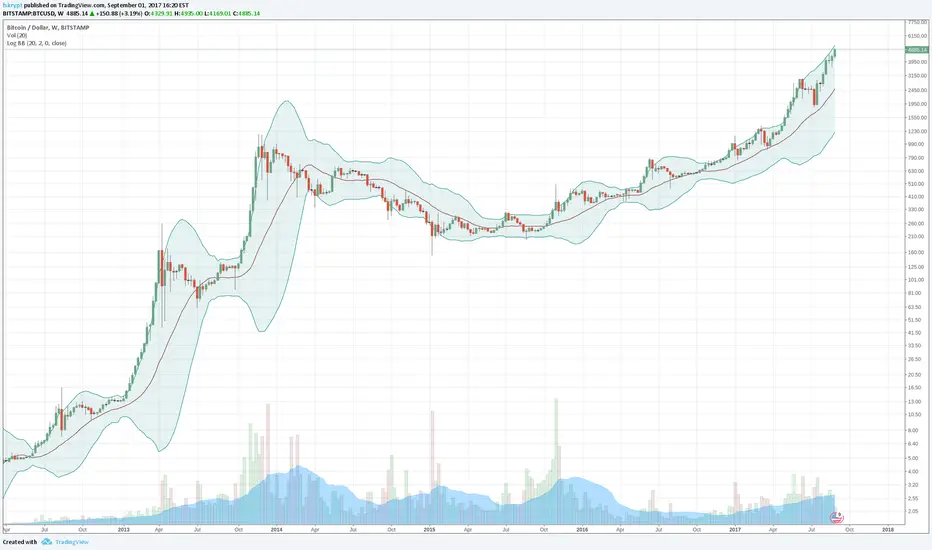
Log-space Bollinger BandsCalculates Bollinger Bands in log space, which is useful for high-volatility charts and for looking at long-term growth
BlackCompositIndicator4OverlayThis is not new indicator.
// Candle Patterns Indicator created by Robert N. 030715
// Volume Indicator @author LazyBear
// Updated and translated by Blyayshman
Это не новый индикатор - это компиляция нескольких для удобства одновременного отображения и экономии разрешенных индикаторов.
Эта версия для отображения на главном экране, вместе с графиком.
Можно отобразить до 4-х MA, 2-х EMA и анализатор паттернов японских свечей.
Пожелания и предложения приветствуются.
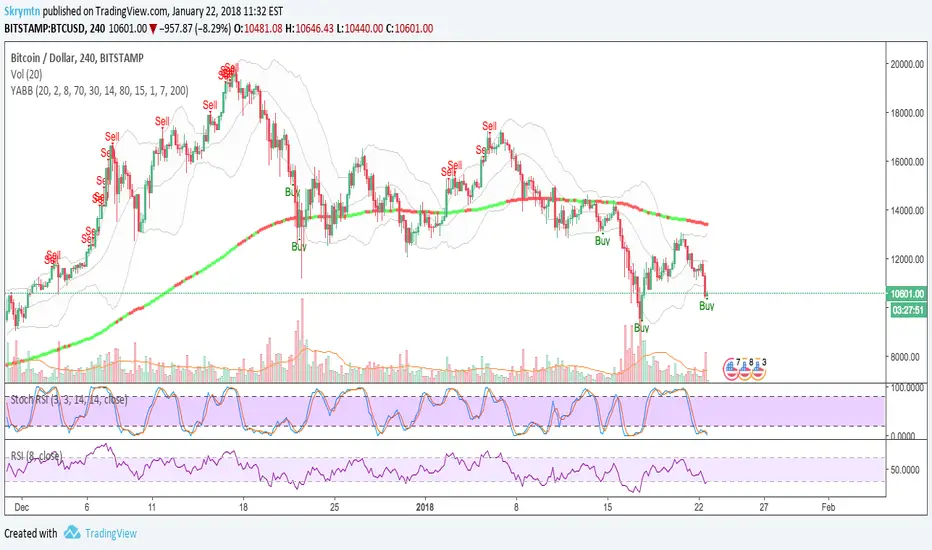
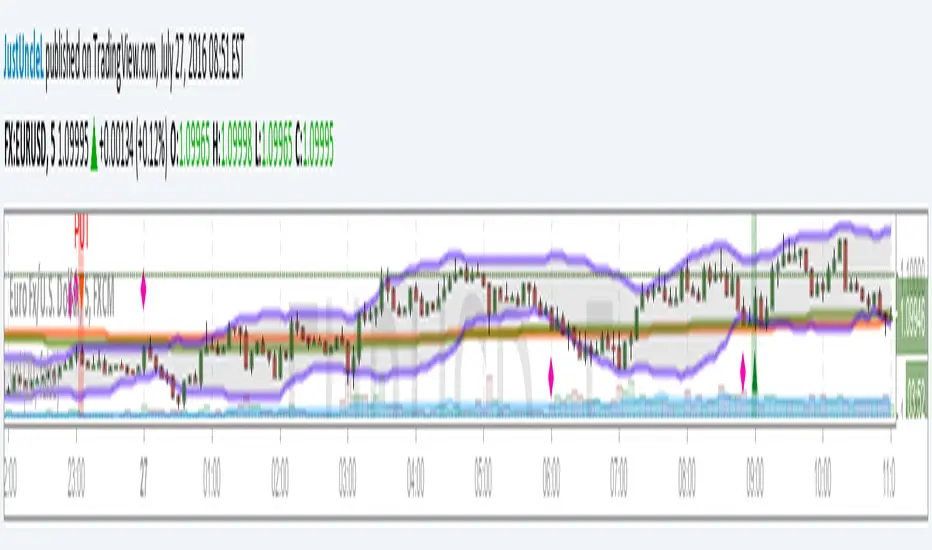
Bollinger Awesome Alert R1 by JustUncleLThis indicator is an implementation of the Bollinger Band and Awesome Oscillator Scalping system.
This technique is for those who want the most simple method that is very effective. It is BEST traded during the busiest trading hours, 3am to 12am EST NY time. This method doesn't work in sideways markets, only in volatile trending markets.
Time Frames: 1, 5, 10, 15 ,30 min.
Currency pairs: majors.
Other Chart indicators:
Add Awesome Oscillator.
Optionally Add Squeeze Indicator.
Here's the strategy:
Going LONG:
Enter a long position when the black 3 EMA has crossed up through the Bollinger red middle band MA. At the same time, the Awesome should be approaching or crossing it's zeroline, going up. This is indicated by "Buy" alert.
Going SHORT:
Enter a short position when the black 3 EMA has crossed down through the Bollinger red middle band MA. At the same time, the Awesome should be approaching or crossing it's zero line, going down. This is indicated by the "Sell" Alert.
Take profit:
10-20 pips depending on pair or When Awesome Oscillator turns a different colour.
HINTS: Best trades tend to occur when price reversing bounce off outer band and outside the Optional Bollinger Squeeze indication.


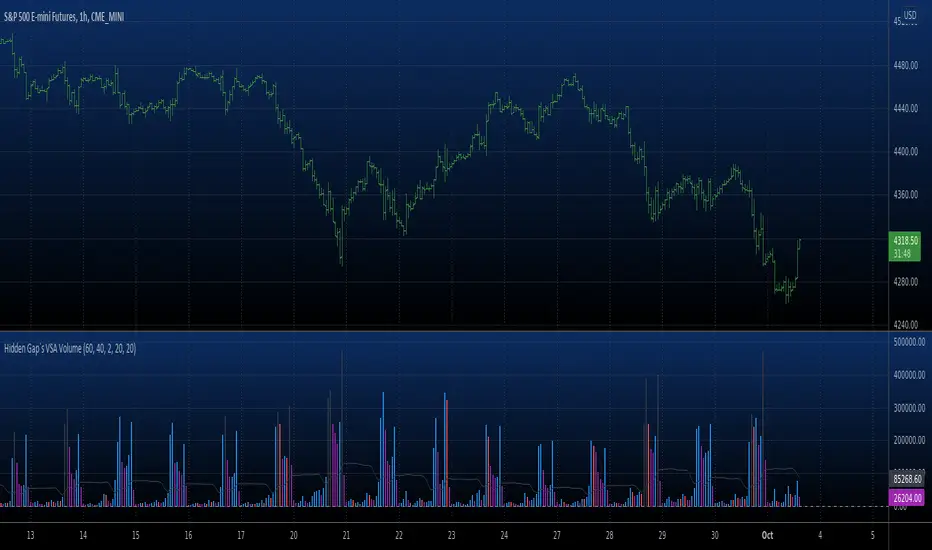
Hidden Gap`s VSA Volume If Volume is less then the previous 20 intervals, Volume is gray.
If Volume is greater then the previous 40 intervals, Volume is black.
If Volume is less then the previous 2 intervals, Volume is purple.
If Volume is less then the previous, Volume is red.
If Volume is greater then the previous, Volume is blue.
Other - white.
You can add on the indicator a 2.5 Standart Deviation of a 20 period
Bollinger Band Shifted 3 periods forward.
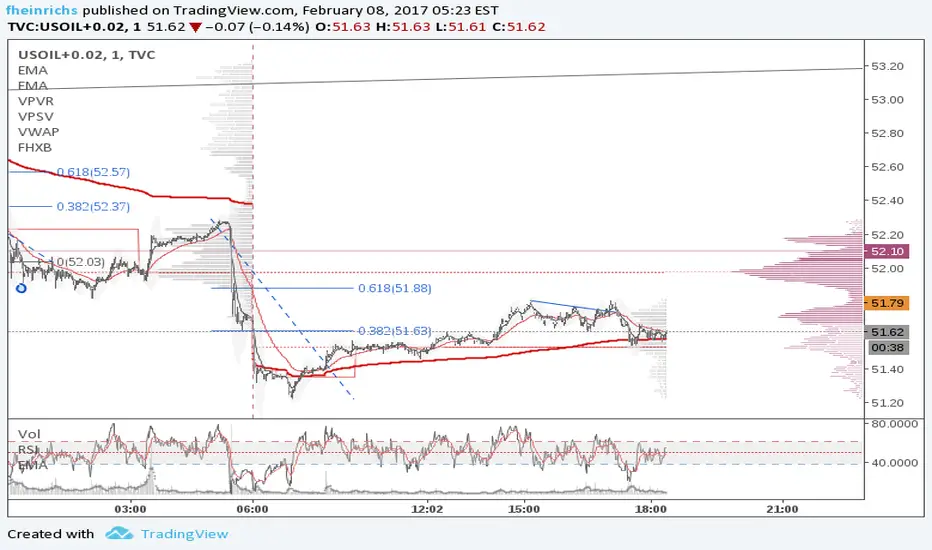
FHX Bands (VWMA BB)This study is an optimized version of Bollinger Bands based on volume weighted data points: more volume on a bar gives those prices a higher impact. FHX bands base on the assumptions of auction market theory (e.g., as does volume profiling). Bollinger Bands implicitly assume a uniform probability mass function for data points and consider only the - somewhat arbitrary - close price. In contrast to this, FHX bands take all four available data points into account (OHLC) and use the volume at each candle* to define a probability mass function in order to compute mean and standard deviation.
As an indicator, FHX bands could be used in the same way as BB to facilitate or confirm Break-Out trades and identify strong momentum moves. Settings for the standard deviation multiplier should be interpreted as follows (following the 68–95–99.7 rule):
x standard deviation set to 1: ~32% chance that a move outside the bands is by chance
x standard deviation set to 2: ~5% chance that a move outside the bands is by chance
x standard deviation set to 3: ~0.3% chance that a move outside the bands is by chance
This however assumes a fairly solid period of consolidation beforehand (visible through notable contraction of the bands) and a normal distribution of values within that consolidation period. Therefore users need to experiment within their time frame in order to identify a Length setting that suits their needs. Personally, I set Length to 21 or lower, depending on my targeted time frame. Note that the indicator does not test for normality in any way; you can, however, use a quick visual test using the fixed range volume profile indicator to increase its reliability.
Good luck and mind your risk
-fhx
* of course tick data would be the real deal, but we work with what we have
Bollinger Band and Moving Average v0.1 by JustUncleLThis is another Bollinger Band strategy+indicator in my series of Bollinger based setups. This one is seems to work best with 5min charts and 20 to 30min expiry. The strategy follows variation of a Bollinger band + Moving Averages
reversal strategy, it uses the 2 moving averages mainly to determine market direction.
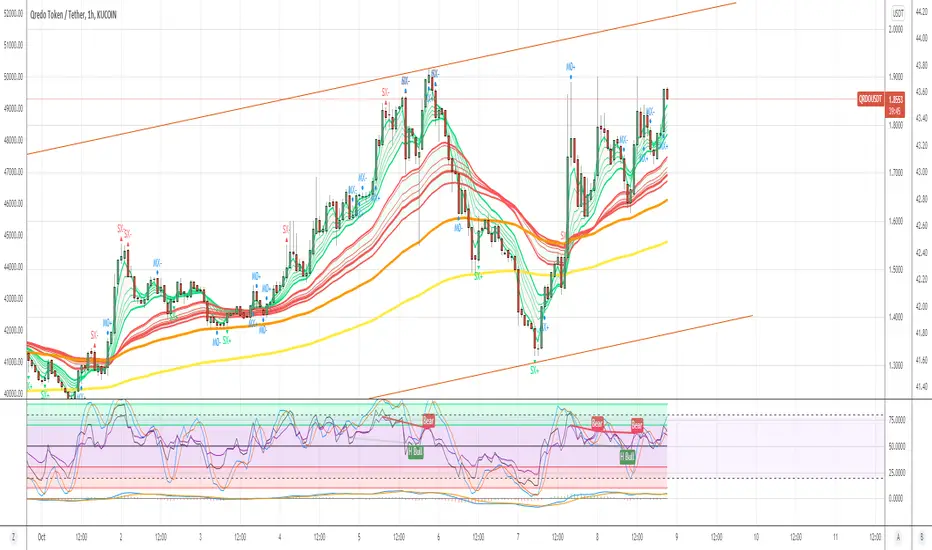
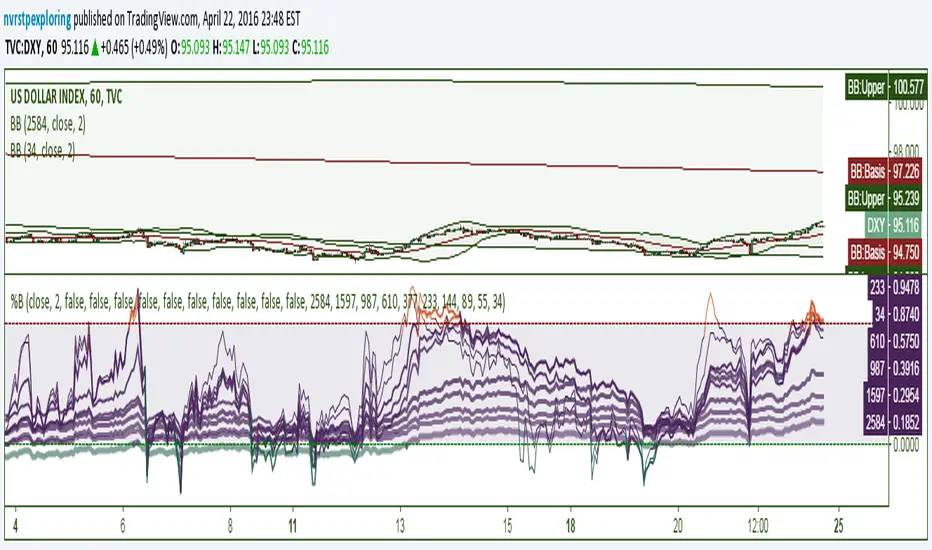
%BsAn indicator with 10 configurable %B lines for identifying trends, overbought and oversold conditions, and reversal points. %B is a linear representation of a securities relationship to the Upper and Lower Bollinger Bands. The best opportunities arise when a security is oversold in a bullish trend and overbought in a bearish trend. The longer %B trend-lines in this indicator are very useful for major reversals. They can be used to indicate the high or low of the day on a 1-minute chart or show a multi-year reversal point.
%B = (Current Price - Lower Band) / (Upper Band - Lower Band)
Kay_BBandsV3This is the 3rd version of Kay_BBands.
When +DI (Directional Index ) is above -DI , then Upper band will be visible and vice-versa.
This is when the ADX is above the threshold. 28 is the default in this version. I found its more appealing in 5M time frame.
BLUE - ADX under 10
GREEN - Uptrend, ADX over 10
RED - Downtrend, ADX over 10
Use it with another band with setting 20, 0.6 deviation. Prices keeping above or below the 2nd bands upper or lower bounds shows trending conditions.
I didn't know how to update the old script so published it again.
Changes - :
1) Updated default settings for the indicator
2) ADX setting are now DI (28), ADX (10), adx level to check is 10.
3) IMPORTANT one - When DI is up/down, lower/upper band will also have color (more visible that way.)
Play around the settings.. It really eliminates extra indicator checking visually... Please like if you think idea is good.

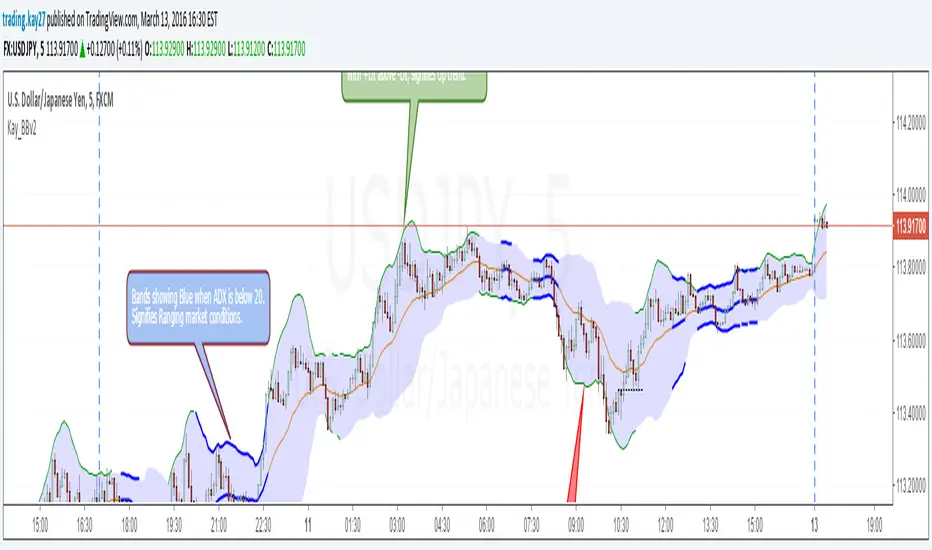
Kay_BBands v2This is the second version of Kay_BBands. But this is infused with ADX.
When +DI (Directional Index) is above -DI, then Upper band will be visible and vice-versa.
This is when the ADX is above the threshold. 20 is the default but can be set to 25.
When the ADX is below the specified threshold, both bands gets visible, showing no trending conditions.
Use it with another band with setting 20/21, 0.6 deviation. Prices keeping above or below the 2nd bands upper or lower bounds shows trending conditions.
[JR] Multi Bollinger Heat BandsBollinger Bands, with incremented additional outer bands.
Set as you would normally, but with the addition of an incremental value for the added outer bands.
Defaults with Length 20, base multiplier of 2.0, and an Increment value of 0.5 for additional outer bands at 2.5 and 3.0. Adjust values to suite your needs.
All lines and zones have colour and formatting options available - because why not eh?

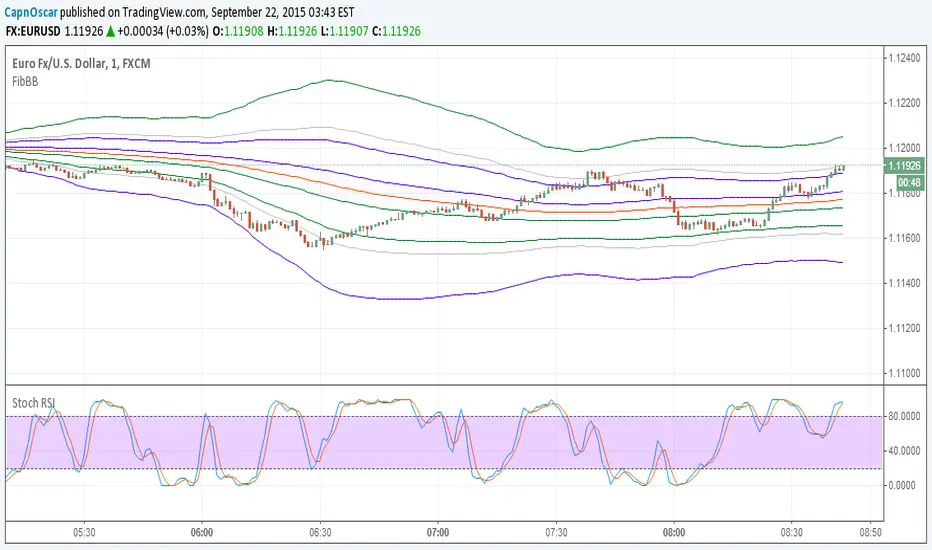
Fibonnacci Bollinger BandsThis Bollinger Bands with additional Fib levels. Swing Trader Edition :) .. thats all really