Planetary Time Intervals [Javonnii]🪐 Planetary Time Intervals Indicator 🪐
This innovative planetary time-based market timing indicator enables traders to analyze and project planetary degree intervals directly onto any chart with exceptional accuracy. Built on a custom planetary framework, it calculates planetary positions down to the arc-second across all timeframes, accommodating up to 500 future bars. This capability allows for both clean intraday analysis and long-term market timing.
The framework operates autonomously and requires no external data or updates. It reliably computes planetary positions across centuries and supports seamless analysis across all markets—whether 24/7 assets like crypto or session-based instruments like stocks—with smooth, gap-free planetary data on any ticker or timeframe. Perfect for time-based market studies on deep historical datasets such as the Dow Jones.
🔶 FEATURES
Key planetary timing tools include:
- Standard Degree Interval Plotting (Fixed Increments)
- Price-to-Planetary Degree Conversions (360 Units Reduction & 1/10 Price Method) for Direct Price-to-Time Harmonics
- Geocentric & Heliocentric Models (Including Moon for Lunar Cycles)
- Absolute Degree Handling for Retrogrades
- Visual Projections: Background Highlights, Vertical Lines, and Degree Labels
- Math Display for Calculation Transparency
- Scaling Adjustments for Volatile Assets (e.g., Crypto, Indices)
- Multi-Timeframe Support Up to 500 Bars
- Alert Conditions for Interval Projections
- Customizable Interval Logic and Styling
- + More (Check changelog for updates)
🔶 BASIC DEMONSTRATION
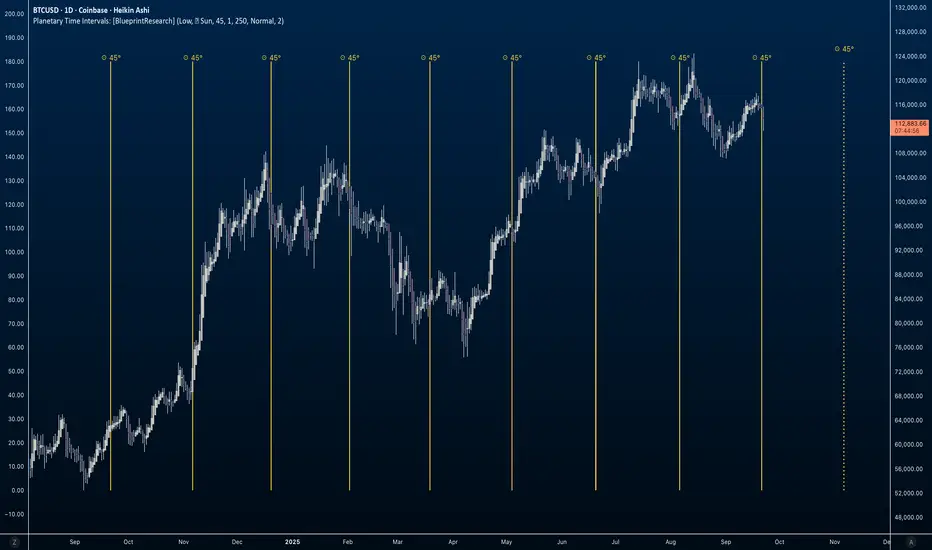
On a daily stock chart, select a key low as your reference point (datetime and price). Choose a 30° interval for Mercury, and the indicator projects vertical lines forward at each degree milestone, with shaded backgrounds indicating potential cycle zones. Labels display traversed degrees, highlighting alignments in real-time.
For the 360 Conversion, input a price like $5,000—it reduces to 320° via modular arithmetic (5000 mod 360 = 320°), converting the price directly into a planetary time interval that may sync with numerological patterns or past turns.
🔶 USAGE & EXAMPLES
In the image below, the indicator is applied to a long-term weekly BTCUSD chart from 2015 to 2026. Selecting a historical low point (price = 198.02) as the reference, the 360 Conversion method derives the interval directly from the price. Since 198.02 is already under 360, the interval is simply 198.02° (no further reduction needed). Vertical yellow lines project these Sun-based intervals forward, aligning with a few key market turns, bull runs, and corrections. The math is displayed in the label "198.02° Low = 198.02° 360 Conversion 198.02°", illustrating the price-to-planetary time conversion process. Numerology enthusiasts might reduce 198.02° further (1+9+8+0+2=20, then 2+0=2) for symbolic insights into market balance or duality.
Supported planets: Sun, Moon, Mercury, Venus, Mars, Jupiter, Saturn, Uranus, Neptune, Pluto.
🔶 SETTINGS
- Timing Method: Select Standard Interval, 360 Conversion, or 1/10 Price.
- Planetary View: Geocentric/Heliocentric; Toggle Moon Inclusion.
- Interval Setup: Enter degrees (e.g., 45°); Enable Absolute for Retrogrades.
- Base Reference: Input datetime and price from high/low.
- Visuals: Toggle highlights, lines, math labels; Set colors/styles.
- Scaling: Adjust for asset ranges (e.g., multipliers for high or low prices).
- Limits: Bar count (up to 500)
- Styling: Label formats, projection options.
🔶 CONCLUSION
Planetary and numerological timing offers a unique lens on market rhythms, blending celestial mechanics with number-based insights for deeper analysis. This indicator is an original creation providing precise, flexible tools to explore these concepts, with a strong focus on converting price data into actionable planetary time intervals. As with all trading, past patterns aren't guarantees—pair with sound risk management and your overall approach.
🔶 HOW TO GET ACCESS
This public invite-only script is for planetary traders, market analysts, numerology enthusiasts, and anyone interested in harmonic degree-based timing. Reach out to the author for access details to this indicator and related resources.
Indicador Pine Script®