Scalping Strategy RSI & ADXThis Pine Script implements a scalping strategy that leverages the Relative Strength Index (RSI) and the Average Directional Index (ADX) to identify short-term trading opportunities. The strategy is designed for traders who aim to profit from quick price movements in highly volatile markets.
Key Components:
RSI (Relative Strength Index):
RSI is used to identify overbought and oversold conditions in the market.
If RSI is below the oversold level (default: 30), the script generates a buy signal.
If RSI is above the overbought level (default: 70), the script generates a sell signal.
ADX (Average Directional Index):
ADX measures the strength of a trend.
The script only triggers buy or sell signals when ADX is above a specified threshold (default: 25), ensuring trades occur only in strong trending markets.
Combined Logic:
A buy condition is met when RSI is below the oversold level and ADX indicates a strong trend.
A sell condition is met when RSI is above the overbought level and ADX indicates a strong trend.
Inputs:
RSI Length: Period for RSI calculation (default: 14).
RSI Overbought Level: Threshold for overbought conditions (default: 70).
RSI Oversold Level: Threshold for oversold conditions (default: 30).
ADX Length: Period for ADX calculation (default: 14).
ADX Smoothing: Smoothing factor for ADX (default: 14).
ADX Threshold: Minimum value for ADX to consider a trend strong (default: 25).
Visual Signals:
Green upward arrows indicate buy signals.
Red downward arrows indicate sell signals.
Strategy Execution:
The script uses strategy.entry to open positions based on the defined conditions.
It plots RSI and ADX values for additional visual confirmation.
How to Use:
Apply this script to your TradingView chart.
Adjust the input parameters to suit your preferred market and timeframe.
Backtest the strategy on historical data to assess its performance.
Use in live markets with appropriate risk management measures.
This strategy is ideal for traders who prefer a systematic and rule-based approach to scalping. However, always test and validate the strategy before using it with real funds.
Índice de Força Relativa (RSI)

Sunil High-Frequency Strategy with Simple MACD & RSISunil High-Frequency Strategy with Simple MACD & RSI
This high-frequency trading strategy uses a combination of MACD and RSI to identify quick market opportunities. By leveraging these indicators, combined with dynamic risk management using ATR, it aims to capture small but frequent price movements while ensuring tight control over risk.
Key Features:
Indicators Used:
MACD (Moving Average Convergence Divergence): The strategy uses a shorter MACD configuration (Fast Length of 6 and Slow Length of 12) to capture quick price momentum shifts. A MACD crossover above the signal line triggers a buy signal, while a crossover below the signal line triggers a sell signal.
RSI (Relative Strength Index): A shorter RSI length of 7 is used to gauge overbought and oversold market conditions. The strategy looks for RSI confirmation, with a long trade initiated when RSI is below the overbought level (70) and a short trade initiated when RSI is above the oversold level (30).
Risk Management:
Dynamic Stop Loss and Take Profit: The strategy uses ATR (Average True Range) to calculate dynamic stop loss and take profit levels based on market volatility.
Stop Loss is set at 0.5x ATR to limit risk.
Take Profit is set at 1.5x ATR to capture reasonable price moves.
Trailing Stop: As the market moves in the strategy’s favor, the position is protected by a trailing stop set at 0.5x ATR, allowing the strategy to lock in profits as the price moves further.
Entry & Exit Signals:
Long Entry: Triggered when the MACD crosses above the signal line (bullish crossover) and RSI is below the overbought level (70).
Short Entry: Triggered when the MACD crosses below the signal line (bearish crossover) and RSI is above the oversold level (30).
Exit Conditions: The strategy exits long or short positions based on the stop loss, take profit, or trailing stop activation.
Frequent Trades:
This strategy is designed for high-frequency trading, with trade signals occurring frequently as the MACD and RSI indicators react quickly to price movements. It works best on lower timeframes such as 1-minute, 5-minute, or 15-minute charts, but can be adjusted for different timeframes based on the asset’s volatility.
Customizable Parameters:
MACD Settings: Adjust the Fast Length, Slow Length, and Signal Length to tune the MACD’s sensitivity.
RSI Settings: Customize the RSI Length, Overbought, and Oversold levels to better match your trading style.
ATR Settings: Modify the ATR Length and multipliers for Stop Loss, Take Profit, and Trailing Stop to optimize risk management according to market volatility.
Important Notes:
Market Conditions: This strategy is designed to capture smaller, quicker moves in trending markets. It may not perform well during choppy or sideways markets.
Optimizing for Asset Volatility: Adjust the ATR multipliers based on the asset’s volatility to suit the risk-reward profile that fits your trading goals.
Backtesting: It's recommended to backtest the strategy on different assets and timeframes to ensure optimal performance.
Summary:
The Sunil High-Frequency Strategy leverages a simple combination of MACD and RSI with dynamic risk management (using ATR) to trade small but frequent price movements. The strategy ensures tight stop losses and reasonable take profits, with trailing stops to lock in profits as the price moves in favor of the trade. It is ideal for scalping or intraday trading on lower timeframes, aiming for quick entries and exits with controlled risk.

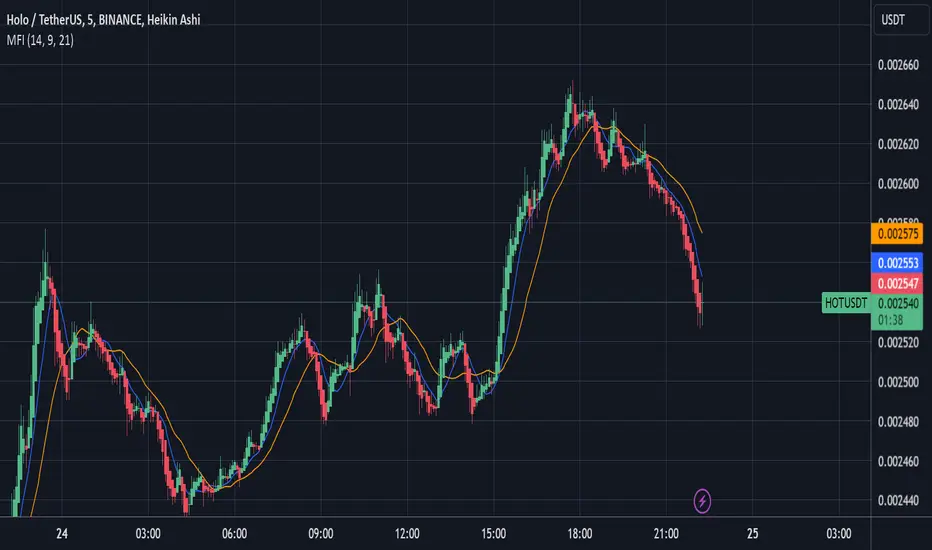
RSI+MFI VisualizerRSI+MFI Visualizer
The RSI+MFI Visualizer is a simple yet effective indicator that combines price momentum and volume dynamics into one clear visual representation. It is designed to help traders quickly identify market trends, momentum shifts, and overbought/oversold conditions.
Here’s a description tailored for publishing your RSI+MFI Visualizer script:
RSI+MFI Visualizer
The RSI+MFI Visualizer is a simple yet effective indicator that combines price momentum and volume dynamics into one clear visual representation. It is designed to help traders quickly identify market trends, momentum shifts, and overbought/oversold conditions.
Key Features:
RSI+MFI Calculation:
This indicator blends the Relative Strength Index (RSI) and Money Flow Index (MFI), providing a unique perspective on price action and volume movement.
Dynamic Visualization:
-Green Line: Indicates positive RSI+MFI values, suggesting bullish momentum.
-Red Line: Indicates negative RSI+MFI values, suggesting bearish momentum.
Zero Line Reference:
A dotted zero line makes it easy to distinguish between bullish and bearish market conditions.
Customizable Parameters:
Flexible input settings for RSI+MFI period and multiplier to suit different trading styles and timeframes.
How to Use:
Trend Identification:
Use the green and red lines to gauge bullish or bearish momentum in the market.
Reversal Signals:
Look for crossovers of the zero line to spot potential trend reversals.
Overbought/Oversold Zones:
Pair this indicator with other tools like RSI or Stochastic for enhanced accuracy.

RSI Bands and extreme zones[Pr]Merhaba indikatörümüzde Rsı değerlerinin grafiğe yansımasını göstermiş bulunmaktayım.

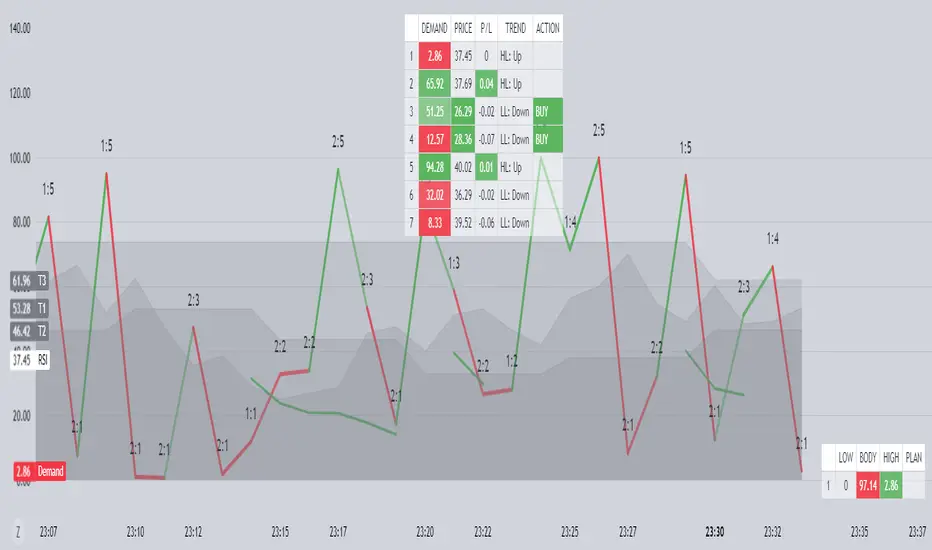
Nimu Market on DemandNimu Market On Demand is an innovative tool designed to provide a visual representation of market demand levels on a scale of 1 to 100. This scale is displayed at specific intervals , making it easy for users to understand market demand fluctuations in real time.
To enhance analysis, Nimu Market On Demand also incorporates the Relative Strength Index (RSI) with key thresholds at . RSI is a widely-used technical indicator that measures market strength and momentum, offering insights into overbought (excessive buying) or oversold (excessive selling) conditions.
The combination of the Demand graph and RSI enables users to:
Identify the right time to buy when the RSI falls below 30, signaling an oversold condition.
Determine the optimal time to sell when the RSI rises above 70, indicating an overbought condition.
With an integrated visualization, users can effortlessly observe demand patterns and combine them with RSI signals to make smarter and more strategic trading decisions. This tool is designed to help traders and investors maximize opportunities in a dynamic market environment.
Demo GPT - Adjusted Swing Trading for SBIBuy when the market is oversold (RSI < 40) and the price is near the lower Bollinger Band.
Sell when the market is overbought (RSI > 60) or the price is near the upper Bollinger Band, or after achieving a 2% profit.

RSI + ADX <20 By Emanuele SabatinoRSI + ADX <20 By Emanuele Sabatino
Strategia che segnala con dei pallini gialli per situazioni di ipervenduto e quindi segnali long e pallini arancioni per segnali di ipercomprato e segnali short. Tutto questo sempre con adx inferiore a 20
Funziona ancora meglio sui livelli e zone di supporto e resistenza chiave.

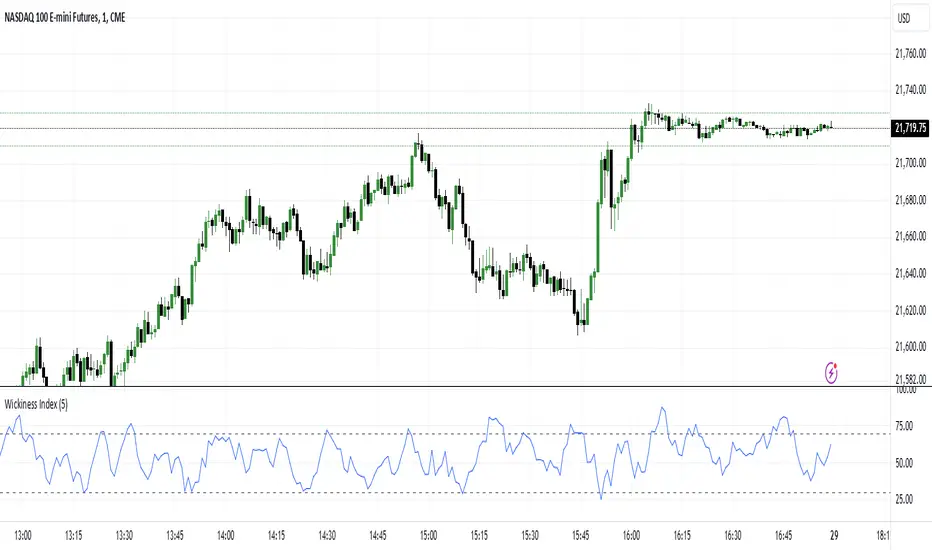
Wickiness IndexWickiness Index - Detect Indecision and Trend Exhaustion
The Wickiness Index is a versatile technical indicator designed to measure the proportion of wicks (upper and lower shadows) relative to the total range of price bars over a specified lookback period. It provides insights into market indecision, reversals, and trend exhaustion by analyzing the structural composition of candlesticks. The indicator calculates the lengths of upper and lower wicks along with the body of each candlestick. Each bar's wick length is expressed as a percentage of the total range (High - Low). The ratio is scaled to 0–100, where 100 represents entirely wicks with no body (indicating pure indecision) and 0 represents no wicks with only body (indicating strong directional movement). These values are then averaged over the lookback period (default = 5 bars) to provide a smoothed representation of wickiness, reducing noise and highlighting trends.
A high value, especially above 70, suggests indecision or potential reversals, as candlesticks dominated by wicks often appear near tops or bottoms. Conversely, low values below 30 indicate trend strength and strong momentum, useful for spotting breakouts and trend continuation. Mid-range values between 30 and 70 often indicate consolidation phases or gradual transitions between trends. Traders can adjust the lookback period to match their trading style, with shorter periods offering faster responses and longer periods providing smoother trends.
This indicator is particularly useful for trend reversal detection, breakout confirmation, and volatility filtering. It scales effectively across all timeframes, making it suitable for both intraday traders and long-term investors. When combined with volume analysis or trend-following indicators, the Wickiness Index can further strengthen trade signals. The visual design includes a blue line for the index and horizontal reference lines at 30 and 70, allowing for quick and intuitive interpretation.
The Wickiness Index offers a unique perspective on market sentiment and price action behavior, providing traders with valuable insights into potential turning points, momentum shifts, and market indecision. It is a powerful tool for improving decision-making in volatile markets and identifying areas where price trends may weaken or reverse.
Relative Strength Index-14 with 60-40 bandChanges are just the RSI BAND Representing 40-60 band instead of 70-30

Relative Strength Index-14 with 60-40 bandChanges are just the RSI BAND Representing 40-60 band instead of 70-30

RSI + ADX <20 By Emanuele SabatinoRSI + ADX <20 By Emanuele Sabatino
Strategia che segnala con dei pallini gialli per situazioni di ipervenduto e quindi segnali long e pallini arancioni per segnali di ipercomprato e segnali short. Tutto questo sempre con adx inferiore a 20
Funziona ancora meglio sui livelli e zone di supporto e resistenza chiave.

Estrategia RSI + Volumen + EMA con Alertas//@version=5
indicator("Estrategia RSI + Volumen + EMA con Alertas", overlay=true)
// Parámetros de entrada
rsi_period = input.int(14, title="Periodo RSI")
rsi_overbought = input.int(70, title="RSI Sobrecompra")
rsi_oversold = input.int(30, title="RSI Sobreventa")
ema_period = input.int(50, title="Periodo EMA")
vol_avg_period = input.int(20, title="Periodo Promedio Volumen")
// Cálculo de indicadores
rsi = ta.rsi(close, rsi_period)
ema = ta.ema(close, ema_period)
vol_avg = ta.sma(volume, vol_avg_period)
// Condiciones de compra y venta
long_condition = (rsi <= rsi_oversold) and (volume > vol_avg) and (close > ema)
short_condition = (rsi >= rsi_overbought) and (volume > vol_avg) and (close < ema)
// Señales en el gráfico
plotshape(series=long_condition, title="Señal de Compra", location=location.belowbar, color=color.green, style=shape.labelup, text="Compra")
plotshape(series=short_condition, title="Señal de Venta", location=location.abovebar, color=color.red, style=shape.labeldown, text="Venta")
// Plot de la EMA
plot(ema, title="EMA", color=color.blue, linewidth=2)
// Líneas horizontales para niveles de RSI
hline(rsi_overbought, "Sobrecompra", color=color.red)
hline(rsi_oversold, "Sobreventa", color=color.green)
// Alertas
alertcondition(long_condition, title="Alerta de Compra", message="Señal de Compra: RSI en sobreventa, volumen alto y precio sobre EMA.")
alertcondition(short_condition, title="Alerta de Venta", message="Señal de Venta: RSI en sobrecompra, volumen alto y precio bajo EMA.")

Deshmukh DivergenceRSI Divergence with Moving Average Indicator
Description:
This indicator combines RSI divergence signals with a moving average (MA) on the RSI for enhanced trend analysis and signal confirmation. It identifies regular and hidden divergences between the price and RSI values, generating buy/sell signals based on these patterns. The added RSI moving average allows users to spot smoother trends and potential reversals.
How It Works:
RSI Calculation:
The Relative Strength Index (RSI) is calculated using the user-defined length.
Helps identify overbought and oversold conditions.
RSI Moving Average:
A simple moving average (SMA) is applied to the RSI to smooth its fluctuations.
Provides a clearer view of RSI trends.
Divergence Detection:
Regular Divergence:
Buy Signal: Price makes a lower low, but RSI makes a higher low.
Sell Signal: Price makes a higher high, but RSI makes a lower high.
Hidden Divergence:
Buy Signal: Price makes a higher low, but RSI makes a lower low.
Sell Signal: Price makes a lower high, but RSI makes a higher high.
Signal Visualization:
Signals are displayed as labeled shapes on the chart:
Green Up Arrow: Regular Buy.
Red Down Arrow: Regular Sell.
Blue Up Arrow: Hidden Buy.
Orange Down Arrow: Hidden Sell.
Overbought/Oversold Levels:
Horizontal lines mark overbought (70) and oversold (30) zones for quick reference.
This indicator is suitable for traders looking to identify potential trend reversals or continuations with the help of divergence patterns and RSI smoothing


RSI Oversold/Overbought StrategyExplanation of the Script:
Version Declaration and Strategy Initialization:
//@version=5 specifies that the script uses Pine Script version 5.
strategy("RSI Oversold/Overbought Strategy", overlay=true) initializes the strategy with the given name and overlays it on the price chart.
User Inputs:
rsiLength allows the user to set the RSI calculation period, defaulting to 14.
oversoldLevel and overboughtLevel let users define the oversold and overbought thresholds, defaulting to 30 and 70, respectively.
RSI Calculation:
rsiValue = ta.rsi(close, rsiLength) computes the RSI based on the closing prices and the specified period.
Trade Entry and Exit Conditions:
enterLong is set to true when the RSI crosses below the oversold level, indicating a potential buying opportunity.
exitLong becomes true when the RSI crosses above the overbought level, signaling an exit point.
Trade Execution:
When enterLong is true, strategy.entry("Long", strategy.long) opens a long position.
When exitLong is true, strategy.close("Long") closes the long position.
RSI Visualization:
plot(rsiValue, title="RSI", color=color.blue) displays the RSI line on a separate chart.
hline functions draw horizontal lines at the oversold and overbought levels for reference.
Important Considerations:
Backtesting: Before deploying this strategy in live trading, conduct thorough backtesting to evaluate its performance across different market conditions.
Risk Management: Incorporate appropriate risk management techniques, such as stop-loss and take-profit levels, to protect against adverse market movements.
Market Conditions: Be aware that the effectiveness of RSI-based strategies can vary with market volatility and trends. Adjust the oversold and overbought levels as needed to align with specific market dynamics.
By customizing the input parameters and thoroughly testing the strategy, you can tailor it to fit your trading preferences and the specific characteristics of the markets you are trading.

Sanjay RS&RSI Strategy V3 for nifty 15min, SL-1.3one of the best swing strategy of nifty futures, fix SL of 1.1%.

RSI + Stoch RSI+ HA Stoch RSI + Explosive VolumeThis is an indicator that combines RSI, Stochastic RSI K, Heikin Ashi Stochastic RSI K, and Explosive Volume (3x) into one.
Feel free to use it conveniently.
Note: If the Heikin Ashi overlay feels distracting, you can turn it on/off as needed. 😊
##########
RSI와 Stochastic RSI K, Heikin Ashi Stochastic RSI K, Explosive Volume(3배)를 하나로 합친 지표입니다.
편하게 사용하세요.
참고) 하이킨아시 오버레이가 눈에 거슬리면 on/off해서 사용하시면 될거 같습니다.😊

EMA RSI Trend Reversal Ver.1Overview:
The EMA RSI Trend Reversal indicator combines the power of two well-known technical indicators—Exponential Moving Averages (EMAs) and the Relative Strength Index (RSI)—to identify potential trend reversal points in the market. The strategy looks for key crossovers between the fast and slow EMAs, and uses the RSI to confirm the strength of the trend. This combination helps to avoid false signals during sideways market conditions.
How It Works:
Buy Signal:
The Fast EMA (9) crosses above the Slow EMA (21), indicating a potential shift from a downtrend to an uptrend.
The RSI is above 50, confirming strong bullish momentum.
Visual Signal: A green arrow below the price bar and a Buy label are plotted on the chart.
Sell Signal:
The Fast EMA (9) crosses below the Slow EMA (21), indicating a potential shift from an uptrend to a downtrend.
The RSI is below 50, confirming weak or bearish momentum.
Visual Signal: A red arrow above the price bar and a Sell label are plotted on the chart.
Key Features:
EMA Crossovers: The Fast EMA crossing above the Slow EMA signals potential buying opportunities, while the Fast EMA crossing below the Slow EMA signals potential selling opportunities.
RSI Confirmation: The RSI helps confirm trend strength—values above 50 indicate bullish momentum, while values below 50 indicate bearish momentum.
Visual Cues: The strategy uses green arrows and red arrows along with Buy and Sell labels for clear visual signals of when to enter or exit trades.
Signal Interpretation:
Green Arrow / Buy Label: The Fast EMA (9) has crossed above the Slow EMA (21), and the RSI is above 50. This is a signal to buy or enter a long position.
Red Arrow / Sell Label: The Fast EMA (9) has crossed below the Slow EMA (21), and the RSI is below 50. This is a signal to sell or exit the long position.
Strategy Settings:
Fast EMA Length: Set to 9 (this determines how sensitive the fast EMA is to recent price movements).
Slow EMA Length: Set to 21 (this smooths out price movements to identify the broader trend).
RSI Length: Set to 14 (default setting to track momentum strength).
RSI Level: Set to 50 (used to confirm the strength of the trend—above 50 for buy signals, below 50 for sell signals).
Risk Management (Optional):
Use take profit and stop loss based on your preferred risk-to-reward ratio. For example, you can set a 2:1 risk-to-reward ratio (2x take profit for every 1x stop loss).
Backtesting and Optimization:
Backtest the strategy on TradingView by opening the Strategy Tester tab. This will allow you to see how the strategy would have performed on historical data.
Optimization: Adjust the EMA lengths, RSI period, and risk-to-reward settings based on your asset and time frame.
Limitations:
False Signals in Sideways Markets: Like any trend-following strategy, this indicator may generate false signals during periods of low volatility or sideways movement.
Not Suitable for All Market Conditions: This indicator performs best in trending markets. It may underperform in choppy or range-bound markets.
Strategy Example:
XRP/USD Example:
If you're trading XRP/USD and the Fast EMA (9) crosses above the Slow EMA (21), while the RSI is above 50, the indicator will signal a Buy.
Conversely, if the Fast EMA (9) crosses below the Slow EMA (21), and the RSI is below 50, the indicator will signal a Sell.
Bitcoin (BTC/USD):
On the BTC/USD chart, when the indicator shows a green arrow and a Buy label, it’s signaling a potential long entry. Similarly, a red arrow and Sell label indicate a short entry or exit from a previous long position.
Summary:
The EMA RSI Trend Reversal Indicator helps traders identify potential trend reversals with clear buy and sell signals based on the EMA crossovers and RSI confirmations. By using green arrows and red arrows, along with Buy and Sell labels, this strategy offers easy-to-understand visual signals for entering and exiting trades. Combine this with effective risk management and backtesting to optimize your trading performance.

Stoch RSI Strategy by ZahidAramaiThis strategy combines the power of Stochastic RSI (StochRSI) with volume analysis to identify potential oversold bounces in the cryptocurrency market. The system is designed for catching momentum reversals while maintaining strict entry and exit criteria.
How It Works:
Uses Stochastic RSI with optimized settings (K:5, D:3, RSI Length:14)
Incorporates volume confirmation for trade validation
Implements momentum-based entry and exit rules
Entry Conditions:
Stochastic RSI drops below 10 (oversold condition)
Volume exceeds 100,000 (high liquidity confirmation)
Both conditions must occur simultaneously
Exit Conditions:
Stochastic RSI rises above 65 (momentum exhaustion)
Position automatically closes when exit condition is met
Strategy Do's:
✅ Use in ranging or trending markets
✅ Wait for both StochRSI and volume confirmations
✅ Monitor overall market conditions
✅ Consider using stop losses (not included in base strategy)
✅ Best used on 15m-1h timeframes
Strategy Don'ts:
❌ Don't override exit signals
❌ Avoid using during highly volatile news events
❌ Don't increase position size during drawdowns
❌ Don't use in low liquidity conditions
❌ Avoid trading against strong market trends
Implementation Tips:
Backtest thoroughly before live trading
Consider market volatility when setting exit levels
Monitor StochRSI divergences for additional confirmation
Use appropriate position sizing
Consider adding trailing stops for profit protection
Note: This strategy performs best in markets with clear momentum shifts and adequate volume. Always use proper risk management alongside these technical signals.

Uptrick: Smart BoundariesThis script is an indicator that combines the RSI (Relative Strength Index) and Bollinger Bands to highlight potential points where price momentum and volatility may both be at extreme levels. Below is a detailed explanation of its components, how it calculates signals, and why these two indicators have been merged into one tool. This script is intended solely for educational purposes and for traders who want to explore the combined use of momentum and volatility measures. Please remember that no single indicator guarantees profitable results.
Purpose of This Script
This script is designed to serve as a concise, all-in-one tool for traders seeking to track both momentum and volatility extremes in real time. By overlaying RSI signals with Bollinger Band boundaries, it helps users quickly identify points on a chart where price movement may be highly stretched. The goal is to offer a clearer snapshot of potential overbought or oversold conditions without requiring two separate indicators. Additionally, its optional pyramiding feature enables users to manage how many times they initiate trades when signals repeat in the same direction. Through these combined functions, the script aims to streamline technical analysis by consolidating two popular measures—momentum via RSI and volatility via Bollinger Bands—into a single, manageable interface.
1. Why Combine RSI and Bollinger Bands
• RSI (Relative Strength Index): This is a momentum oscillator that measures the speed and magnitude of recent price changes. It typically ranges between 0 and 100. Traders often watch for RSI crossing into “overbought” or “oversold” levels because it may indicate a potential shift in momentum.
• Bollinger Bands: These bands are plotted around a moving average, using a standard deviation multiplier to create an upper and lower boundary. They help illustrate how volatile the price has been relative to its recent average. When price moves outside these boundaries, some traders see it as a sign the price may be overstretched and could revert closer to the average.
Combining these two can be useful because it blends two different perspectives on market movement. RSI attempts to identify momentum extremes, while Bollinger Bands track volatility extremes. By looking for moments when both conditions agree, the script tries to highlight points where price might be unusually stretched in terms of both momentum and volatility.
2. How Signals Are Generated
• Buy Condition:
- RSI dips below a specified “oversold” level (for example, 30 by default).
- Price closes below the lower Bollinger Band.
When these occur together, the script draws a label indicating a potential bullish opportunity. The underlying reasoning is that momentum (RSI) suggests a stronger-than-usual sell-off, and price is also stretched below the lower Bollinger Band.
• Sell Condition:
- RSI rises above a specified “overbought” level (for example, 70 by default).
- Price closes above the upper Bollinger Band.
When these occur together, a label is plotted for a potential bearish opportunity. The rationale is that momentum (RSI) may be overheated, and the price is trading outside the top of its volatility range.
3. Pyramiding Logic and Trade Count Management
• Pyramiding refers to taking multiple positions in the same direction when signals keep firing. While some traders prefer just one position per signal, others like to scale into a trade if the market keeps pushing in their favor.
• This script uses variables that keep track of how many recent buy or sell signals have fired. If the count reaches a user-defined maximum, no more signals of that type will trigger additional labels. This protects traders from over-committing to one direction if the market conditions remain “extreme” for a prolonged period.
• If you disable the pyramiding feature, the script will only plot one label per side until the condition resets (i.e., until RSI and price conditions are no longer met).
4. Labels and Visual Feedback
• Whenever a buy or sell condition appears, the script plots a label directly on the chart:
- Buy labels under the price bar.
- Sell labels above the price bar.
These labels make it easier to review where both RSI and Bollinger Band conditions align. It can be helpful for visually scanning the chart to see if the signals show any patterns related to market reversals or trend continuations.
• The Bollinger Bands themselves are plotted so traders can see when the price is approaching or exceeding the upper or lower band. Watching the RSI and Bollinger Band plots simultaneously can give traders more context for each signal.
5. Originality and Usefulness
This script provides a distinct approach by merging two well-established concepts—RSI and Bollinger Bands—within a single framework, complemented by optional pyramiding controls. Rather than using each indicator separately, it attempts to uncover moments when momentum signals from RSI align with volatility extremes highlighted by Bollinger Bands. This combined perspective can aid in spotting areas of possible overextension in price. Additionally, the built-in pyramiding mechanism offers a method to manage multiple signals in the same direction, allowing users to adjust how aggressively they scale into trades. By integrating these elements together, the script aims to deliver a tool that caters to diverse trading styles while remaining straightforward to configure and interpret.
6. How to Use the Indicator
• Configure the Inputs:
- RSI Length (the lookback period used for the RSI calculation).
- RSI Overbought and Oversold Levels.
- Bollinger Bands Length and Multiplier (defines the moving average period and the degree of deviation).
- Option to reduce pyramiding.
• Set Alerts (Optional):
- You can create TradingView alerts for when these conditions occur, so you do not have to monitor the chart constantly. Choose the buy or sell alert conditions in your alert settings.
• Integration in a Trading Plan:
- This script alone is not a complete trading system. Consider combining it with other forms of analysis, such as support and resistance, volume profiles, or candlestick patterns. Thorough research, testing on historical data, and risk management are always recommended.
7. No Performance Guarantees
• This script does not promise any specific trading results. It is crucial to remember that no single indicator can accurately predict future market movements all the time. The script simply tries to highlight moments when two well-known indicators both point to an extreme condition.
• Actual trading decisions should factor in a range of market information, including personal risk tolerance and broader market conditions.
8. Purpose and Limitations
• Purpose:
- Provide a combined view of momentum (RSI) and volatility (Bollinger Bands) in a single script.
- Assist in spotting times when price may be at an extreme.
- Offer a configurable system for labeling potential buy or sell points based on these extremes.
• Limitations:
- Overbought and oversold conditions can persist for an extended period in trending markets.
- Bollinger Band breakouts do not always result in immediate reversals. Sometimes price keeps moving in the same direction.
- The script does not include a built-in exit strategy or risk management rules. Traders must handle these themselves.
Additional Disclosures
This script is published open-source and does not rely on any external or private libraries. It does not use lookahead methods or repaint signals; all calculations are performed on the current bar without referencing future data. Furthermore, the script is designed for standard candlestick or bar charts rather than non-standard chart types (e.g., Heikin Ashi, Renko). Traders should keep in mind that while the script can help locate potential momentum and volatility extremes, it does not include an exit strategy or account for factors like slippage or commission. All code comes from built-in Pine Script functions and standard formulas for RSI and Bollinger Bands. Anyone reviewing or modifying this script should exercise caution and incorporate proper risk management when applying it to their own trading.
Calculation Details
The script computes RSI by examining a user-defined number of prior bars (the RSI Length) and determining the average of up-moves relative to the average of down-moves over that period. This ratio is then scaled to a 0–100 range, so lower values typically indicate stronger downward momentum, while higher values suggest stronger upward momentum. In parallel, Bollinger Bands are generated by first calculating a simple moving average (SMA) of the closing price for the user-specified length. The script then measures the standard deviation of closing prices over the same period and multiplies it by the chosen factor (the Bollinger Bands Multiplier) to form the upper and lower boundaries around the SMA. These two measures are checked in tandem: if the RSI dips below a certain oversold threshold and price trades below the lower Bollinger Band, a condition is met that may imply a strong short-term sell-off; similarly, if the RSI surpasses the overbought threshold and price rises above the upper Band, it may indicate an overextended move to the upside. The pyramiding counters track how many of these signals occur in sequence, preventing excessive stacking of labels on the chart if conditions remain extreme for multiple bars.
Conclusion
This indicator aims to provide a more complete view of potential market extremes by overlaying the RSI’s momentum readings on top of Bollinger Band volatility signals. By doing so, it attempts to help traders see when both indicators suggest that the market might be oversold or overbought. The optional reduced pyramiding logic further refines how many signals appear, giving users the choice of a single entry or multiple scaling entries. It does not claim any guaranteed success or predictive power, but rather serves as a tool for those wanting to explore this combined approach. Always be cautious and consider multiple factors before placing any trades.

Multi-Feature IndicatorThe Multi-Feature Indicator combines three popular technical analysis tools — RSI, Moving Averages (MA), and MACD — into a single indicator to provide unified buy and sell signals. This script is designed for traders who want to filter out noise and focus on signals confirmed by multiple criteria.
Features:
RSI (Relative Strength Index):
Measures momentum and identifies overbought (70) and oversold (30) conditions.
A signal is triggered when RSI crosses these thresholds.
Moving Averages (MA):
Uses a short-term moving average (default: 9 periods) and a long-term moving average (default: 21 periods).
Buy signals occur when the short-term MA crosses above the long-term MA, indicating an uptrend.
Sell signals occur when the short-term MA crosses below the long-term MA, indicating a downtrend.
MACD (Moving Average Convergence Divergence):
A trend-following momentum indicator that shows the relationship between two moving averages of an asset's price.
Signals are based on the crossover of the MACD line and its signal line.
Unified Buy and Sell Signals:
Buy Signal: Triggered when:
RSI crosses above 30 (leaving oversold territory).
Short-term MA crosses above the long-term MA.
MACD line crosses above the signal line.
Sell Signal: Triggered when:
RSI crosses below 70 (leaving overbought territory).
Short-term MA crosses below the long-term MA.
MACD line crosses below the signal line.
Visualization:
The indicator plots the short-term and long-term moving averages on the price chart.
Green "BUY" labels appear below price bars when all buy conditions are met.
Red "SELL" labels appear above price bars when all sell conditions are met.
Parameters:
RSI Length: Default is 14. This controls the sensitivity of the RSI.
Short MA Length: Default is 9. This determines the short-term trend.
Long MA Length: Default is 21. This determines the long-term trend.
Use Case:
The Multi-Feature Indicator is ideal for traders seeking higher confirmation before entering or exiting trades. By combining momentum (RSI), trend (MA), and momentum shifts (MACD), it reduces false signals and enhances decision-making.
How to Use:
Apply the indicator to your chart in TradingView.
Look for "BUY" or "SELL" signals, which appear when all conditions align.
Use this tool in conjunction with other analysis techniques for best results.
Note:
The default settings are suitable for many assets, but you may need to adjust them for different timeframes or market conditions.
This indicator is meant to assist in trading decisions and should not be used as the sole basis for trading.
Christmas RSI with Jingle Bell [TrendX_]Jingle Bell 🔔, Jingle Bell 🔔, Jingle all the chart 📈 Merry Christmas Tradingview Community !!!
Introducing the Jingle Bell Indicator, a festive Pine Script creation designed to spread joy and luck to your trading endeavors. The Bow will change colors based on the reaction of RSI with the 50 level. Add a Jingle Bell drawing to your charts and celebrate the most wonderful time of the year. Turn on alert for today to get my Merry Christmas wish.
This indicator is my gift to the Tradingview community, designed to bring a touch of luck to your trades. Hope this Jingle Bell will bring some joy and festive vibes to your trading experience.
RSI+EMA+MZONES with DivergencesFeatures:
1. RSI Calculation:
Uses user-defined periods to calculate the RSI and visualize momentum shifts.
Plots key RSI zones, including upper (overbought), lower (oversold), and middle levels.
2. EMA of RSI:
Includes an Exponential Moving Average (EMA) of the RSI for trend smoothing and confirmation.
3. Bullish and Bearish Divergences:
Detects Regular divergences (labeled as “Bull” and “Bear”) for classic signals.
Identifies Hidden divergences (labeled as “H Bull” and “H Bear”) for potential trend continuation opportunities.
4. Customizable Labels:
Displays divergence labels directly on the chart.
Labels can be toggled on or off for better chart visibility.
5. Alerts:
Predefined alerts for both regular and hidden divergences to notify users in real time.
6. Fully Customizable:
Adjust RSI period, lookback settings, divergence ranges, and visibility preferences.
Colors and styles are easily configurable to match your trading style.
How to Use:
RSI Zones: Use RSI and its zones to identify overbought/oversold conditions.
EMA: Look for crossovers or confluence with divergences for confirmation.
Divergences: Monitor for “Bull,” “Bear,” “H Bull,” or “H Bear” labels to spot key reversal or continuation signals.
Alerts: Set alerts to be notified of divergence opportunities without constant chart monitoring.
