Oculus Ultra Parallel S/R Channel**Oculus Ultra Parallel S/R Channel**
*Version 1.0 | Pine Script v6*
**Overview**
This indicator overlays a statistically-driven support/resistance channel on your chart by fitting a linear regression (median) line and plotting parallel bands at a configurable multiple of standard deviation. It adapts dynamically to both trend and volatility, highlights potential reaction zones, and offers optional alerts when price touches key levels.
**Key Features**
* **Median Regression Line**
Fits a best-fit line through the chosen lookback of price data, showing the underlying trend.
* **Volatility-Based Bands**
Upper and lower bands offset by *N*× standard deviation of regression residuals, capturing dynamic S/R zones.
* **Dynamic Coloring**
* Median line turns **teal** when sloping up, **orange** when sloping down.
* Bands tinted green or red depending on their position relative to the median.
* **Channel Fill**
Optional shaded area between the bands for immediate visual context.
* **Touch Alerts**
Precision alerts and on-chart markers when price touches the support or resistance band, with configurable tick tolerance.
* **Clean Layout**
Minimal lines and plots to avoid chart clutter, adjustable via toggle inputs.
**How to Use**
1. **Apply the Script** – Add to any timeframe in overlay mode.
2. **Configure Inputs** –
* **Channel Length**: Number of bars for regression and volatility calculation.
* **Deviation Factor**: Multiplier for band width (in standard deviations).
* **Show/Hide Elements**: Toggle median line, bands, fill, and touch alerts.
* **Color by Slope**: Enable slope-based median coloring.
* **Touch Tolerance**: Number of ticks within which a band touch is registered.
3. **Interpret the Channel** –
* **Trend**: Follow the slope and color of the median line.
* **Support/Resistance**: Bands represent dynamic zones where price often reacts.
* **Alerts**: Use touch markers or alert pop-ups to time entries or exits at band levels.
**Inputs**
* **Channel Length** (default: 100)
* **Deviation Factor** (default: 1.0)
* **Show Median Regression Line** (true/false)
* **Show Channel Bands** (true/false)
* **Fill Between Bands** (true/false)
* **Color Median by Slope** (true/false)
* **Alert on Band Touch** (true/false)
* **Touch Tolerance (ticks)** (default: 2)
**Version History**
* **1.0** – Initial release with dynamic regression channel, slope coloring, band fill, and touch alerts.
**Disclaimer**
This indicator is intended for educational purposes. Always backtest with your own settings and apply sound risk management before trading live.
Regressions

VWAP Supply & Demand Zones PRO**Overview:**
This script represents a major evolution of the original "VWAP Supply and Demand Zones" indicator. Initially created to explore price interaction with VWAP, it has now matured into a robust and feature-rich tool for identifying high-probability zones of institutional buying and selling pressure. The update introduces volume and momentum validation, dynamic zone management, alert logic, and a visual dashboard (HUD) — all designed for improved precision and clarity. The structural improvements, anti-repainting logic, and significant added utility warranted releasing this as a new script rather than a minor update.
---
### What It Does:
This indicator dynamically detects **supply and demand zones** using VWAP-based logic combined with **volume** and **momentum confirmation**. When price crosses VWAP with strength, it identifies the potential zone of excess demand (below VWAP) or supply (above VWAP), marking it visually with colored regions on the chart.
Each zone is extended for a user-defined duration, monitored for touch interactions (tests), and tracked for possible breaks. The script helps traders interpret price behavior around these institutional zones as either **reversal** opportunities or **continuation** confirmation depending on context and strategy preference.
---
### How It Works:
* **VWAP Basis**: Zones are anchored at VWAP at the time of a significant cross.
* **Volume & Momentum Filters**: Crosses are only considered valid if backed by above-average volume and notable price momentum.
* **Zone Drawing**: Validated supply and demand zones are drawn as boxes on the chart. Each is extended forward for a customizable number of bars.
* **Touch Counting**: Zones track the number of price touches. Alerts are issued after a user-defined number of tests.
* **Break Detection**: If price closes significantly beyond a zone boundary, the zone is marked as broken and visually dimmed.
* **Visual Dashboard (HUD)**: A compact real-time HUD displays VWAP value, active zone counts, and current market bias.
---
### How to Use It:
**Reversal Trading:**
* Look for price **rejecting** a zone after touching it.
* Use rejection candles or secondary indicators (e.g., RSI divergence) to confirm.
* These setups may offer low-risk entries when price respects the zone.
**Continuation Trading:**
* A **break of a zone** suggests strong directional bias.
* Use confirmed zone breaks to enter in the direction of momentum.
* Ideal in trending environments, especially with high volume and ATR movement.
---
### Key Inputs:
* **VWAP Length**: Moving VWAP period (default: 20)
* **Zone Width %**: Percentage size of zone buffer (default: 0.5%)
* **Min Touches**: How many times price must test a zone before alerts trigger
* **Zone Extension**: How far into the future zones are projected
* **Volume & ATR Filters**: Ensure only strong, valid crossovers create zones
---
### Alerts:
You can enable alerts for:
* **New zone creation**
* **Zone tests (after minimum touch count)**
* **Zone breaks**
* **VWAP crosses**
* **Active presence inside a zone (entry conditions)**
These alerts help automate market monitoring, making it suitable for discretionary or systematic workflows.
---
### Why It's a New Script:
This is not a cosmetic update. The internal logic, signal generation, filtering methodology, visual engine, and UX framework have been entirely rebuilt from the ground up. The result is a highly adaptive, precision-oriented tool — appropriate for intraday scalpers and swing traders alike. It goes far beyond the original in terms of functionality and reliability, justifying a fresh release.
---
### Suitable Markets and Timeframes:
* Works across all liquid markets (crypto, equities, futures, forex)
* Best used on timeframes where volume data is stable (5m and above recommended)
* Recalibrate inputs for optimal detection across instruments

Wavelet Filter with Adaptive Upsampling [BackQuant]Wavelet Filter with Adaptive Upsampling
The Wavelet Filter with Adaptive Upsampling is an advanced filtering and signal reconstruction tool designed to enhance the analysis of financial time series data. It combines wavelet transforms with adaptive upsampling techniques to filter and reconstruct price data, making it ideal for capturing subtle market movements and enhancing trend detection. This system uses high-pass and low-pass filters to decompose the price series into different frequency components, applying adaptive thresholding to eliminate noise and preserve relevant signal information.
Shout out to Loxx for the Least Squares fitting of trigonometric series and Quinn and Fernandes algorithm for finding frequency
www.tradingview.com
Key Features
1. Frequency Decomposition with High-Pass and Low-Pass Filters:
The indicator decomposes the input time series using high-pass and low-pass filters to separate the high-frequency (detail) and low-frequency (trend) components of the data. This decomposition allows for a more accurate analysis of underlying trends, while mitigating the impact of noise.
2. Soft Thresholding for Noise Reduction:
A soft thresholding function is applied to the high-frequency component, allowing for the reduction of noise while retaining significant market signals. This function adjusts the coefficients of the high-frequency data, removing small fluctuations and leaving only the essential price movements.
3. Adaptive Upsampling Process:
The upsampling process in this script can be customized using different methods: sinusoidal upsampling, advanced upsampling, and simple upsampling. Each method serves a unique purpose:
Sinusoidal Upsample uses a sine wave to interpolate between data points, providing a smooth transition.
Advanced Upsample utilizes a Quinn-Fernandes algorithm to estimate frequency and apply more sophisticated interpolation techniques, adapting to the market’s cyclical behavior.
Simple Upsample linearly interpolates between data points, providing a basic upsampling technique for less complex analysis.
4. Reconstruction of Filtered Signal:
The indicator reconstructs the filtered signal by summing the high and low-frequency components after upsampling. This allows for a detailed yet smooth representation of the original time series, which can be used for analyzing underlying trends in the market.
5. Visualization of Reconstructed Data:
The reconstructed series is plotted, showing how the upsampling and filtering process enhances the clarity of the price movements. Additionally, the script provides the option to visualize the log returns of the reconstructed series as a histogram, with positive returns shown in green and negative returns in red.
6. Cumulative Series and Trend Detection:
A cumulative series is plotted to visualize the compounded effect of the filtered and reconstructed data. This feature helps traders track the overall performance of the asset over time, identifying whether the asset is following a sustained upward or downward trend.
7. Adaptive Thresholding and Noise Estimation:
The system estimates the noise level in the high-frequency component and applies an adaptive thresholding process based on the standard deviation of the downsampled data. This ensures that only significant price movements are retained, further refining the trend analysis.
8. Customizable Parameters for Flexibility:
Users can customize the following parameters to adjust the behavior of the indicator:
Frequency and Phase Shift: Control the periodicity of the wavelet transformation and the phase of the upsampling function.
Upsample Factor: Adjust the level of interpolation applied during the upsampling process.
Smoothing Period: Determine the length of time used to smooth the signal, helping to filter out short-term fluctuations.
References
Enhancing Cross-Sectional Currency Strategies with Context-Aware Learning to Rank
arxiv.org
Daubechies Wavelet - Wikipedia
en.wikipedia.org
Quinn Fernandes Fourier Transform of Filtered Price by Loxx
Note on Usage for Mean-Reversion Strategy
This indicator is primarily designed for trend-following strategies. However, by taking the inverse of the signals, it can be adapted for mean-reversion strategies. This involves buying underperforming assets and selling outperforming ones. Caution: This method may not work effectively with highly correlated assets, as the price movements between correlated assets tend to mirror each other, limiting the effectiveness of mean-reversion strategies.
Final Thoughts
The Wavelet Filter with Adaptive Upsampling is a powerful tool for traders seeking to improve their understanding of market trends and noise. By using advanced wavelet decomposition and adaptive upsampling, this system offers a clearer, more refined picture of price movements, enhancing trend-following strategies. It’s particularly useful for detecting subtle shifts in market momentum and reconstructing price data in a way that removes noise, providing more accurate insights into market conditions.

Curved Trend Channels (Zeiierman)█ Overview
Curved Trend Channels (Zeiierman) is a next-generation trend visualization tool engineered to adapt dynamically to both linear and non-linear market behavior. It introduces a novel curvature-based channeling system that grows over time during trending conditions, mirroring the natural acceleration of price trends, while simultaneously leveraging adaptive range filtering and dual-layer candle trend logic.
This tool is ideal for traders seeking smooth yet reactive dynamic channels that evolve with market structure. Whether used in curved mode or traditional slope mode, it provides exceptional clarity on trend transitions, volatility compression, and breakout development.
█ How It Works
⚪ Adaptive Range Filter Foundation
The core of the system is a volatility-based range filter that determines the underlying structure of the bands:
Pre-Smoothing of High/Low Data – Highs and lows are smoothed using a selectable moving average (SMA, EMA, HMA, KAMA, etc.) before calculating the volatility range.
Volatility Envelope – The range is scaled using a fixed factor (2.618) and further adjusted by a Band Multiplier to form the primary envelope around price.
Smoothed Volatility Curve – Final bands are stabilized using a long lookback, ensuring clean visual structure and trend clarity.
⚪ Curved Channel Logic
In Curved Mode, the trend channel grows over time when the trend direction remains unchanged:
Base Step Size (× ATR) – Sets the minimum unit of slope change.
Growth per Bar (× ATR) – Defines the acceleration rate of the channel slope with time.
Trend Persistence Recognition – The longer a trend persists, the more pronounced the slope becomes, mimicking real market accelerations.
This dynamic, time-dependent logic enables the channel to "curve" upward or downward, tracking long-standing trends with increasing confidence.
⚪ Trend Slope
As an alternative to curved logic, traders can activate a regular Trend slope using:
Slope Length – Determines how quickly the trend line adapts to price shifts.
Multiplicative Factor – Amplifies the sensitivity of the slope, useful in fast-moving markets or lower timeframes.
⚪ Candle Trend Confirmation
A robust second-layer trend detection method, the Candle Trend System evaluates directional pressure by analyzing smoothed price action:
Multi-tier Smoothing – Trend lines are derived from short-, medium-, and long-term candle movement.
█ How to Use
⚪ Trend Identification
When the Trend Line direction and Candle Colors are in agreement, this indicates strong, persistent directional conviction. Use these moments to enter with trend confirmation and manage risk more confidently.
⚪ Retest
During ongoing trends, the price will often pull back into the dynamic channel. Look for:
Support/resistance interactions at the upper or lower bands.
█ Settings
Scaled Volatility Length – Controls the historical depth used to stabilize the volatility bands.
Smoothing Type – Choose from HMA, KAMA, VIDYA, FRAMA, Super Smoother, etc. to match your asset and trading style.
Volatility MA Length – Smoothing length for the calculated range; shorter = more reactive.
High/Low Smoother Length – Additional smoothing to reduce noise from spikes or false pivots.
Band Multiplier – Widens or tightens the band range based on personal preference.
Enable Curved Channel – Toggle between curved or regular trend slope behavior.
Base Step (× ATR) – The starting point for curved slope progression.
Growth per Bar (× ATR) – How much the slope accelerates per bar during a sustained trend.
Slope – Reactivity of the standard trend line to price movements.
Multiplicative Factor – Sensitivity adjustment for HyperTrend slope.
Candle Trend Length – Lookback period for trend determination from candle structure.
-----------------
Disclaimer
The content provided in my scripts, indicators, ideas, algorithms, and systems is for educational and informational purposes only. It does not constitute financial advice, investment recommendations, or a solicitation to buy or sell any financial instruments. I will not accept liability for any loss or damage, including without limitation any loss of profit, which may arise directly or indirectly from the use of or reliance on such information.
All investments involve risk, and the past performance of a security, industry, sector, market, financial product, trading strategy, backtest, or individual's trading does not guarantee future results or returns. Investors are fully responsible for any investment decisions they make. Such decisions should be based solely on an evaluation of their financial circumstances, investment objectives, risk tolerance, and liquidity needs.

Regression Channel (Interactive)Weighted Interactive Regression Channel (WIRC)
Overview
The Weighted Interactive Regression Channel improves on traditional regression channels by emphasizing key price points through intelligent weighting. Instead of treating all candles equally, WIRC adapts to market dynamics for better trend detection and channel accuracy.
Key Differences from Standard Channels
Weighted vs. Equal: Prioritizes significant events over uniform weighting
Dynamic vs. Static: Adapts in real time to market changes
Accurate vs. Basic: Reduces noise, enhances signal clarity
Customizable vs. Fixed: Full control over weights and visuals
Weighting Methods
Direction Change – Highlights reversal points via local peaks/troughs
Volume-Based – Emphasizes high-volume candles, ideal for breakouts
Price Range – Weights wide-range candles to capture volatility
Time Decay – Prioritizes recent data for current market relevance
Interactive Features
Data Range: Set channel start/end over 1–500 bars
Visuals: Line styles, color coding, fill options, reference lines
Stats: Slope, R², standard deviation, point count, weight method
Technical Implementation
Weighted Regression Formula: Uses weights for slope, intercept, and deviation
Channel Lines: Center = weighted regression; bounds = ± deviation × multiplier
Usage Scenarios
Trend Analysis: Use Direction Change + longer range
Breakouts: Use Volume weighting + fill + boundary watching
Volatility: Apply Price Range weighting + monitor standard deviation
Current Market: Use Time Decay + shorter ranges + stat display
Parameter Tips
Channel Width:
Narrow (1.0–1.5): Responsive
Standard (1.5–2.0): Balanced
Wide (2.0–3.0+): Conservative
Weighting Intensity:
Conservative (1.5–2.0)
Moderate (2.0–3.0)
Aggressive (3.0+)
Advanced Use
Multi-Timeframe: Use different weightings per timeframe
Market Structure: Detect swings, institutional zones
Risk Management: Dynamic S/R levels, volatility-driven sizing
Best Practices
Start with Direction Change
Test different ranges
Monitor stats
Combine with other indicators
Adjust to market context
Recalibrate regularly
Conclusion
WIRC delivers a smarter, more adaptive view of price action than standard regression tools. With real-time customization and multiple weighting options, it’s ideal for traders seeking precision across strategies—trend tracking, breakout confirmation, or volatility insight.

WLSMA: fast approximation🙏🏻 Sup TV & @alexgrover
O(N) algocomplexity, just one loop inside. No, you can't do O(1) @ updates in moving window mode, only expanding window will allow that.
Now I have time series & stats models of my own creation, nowhere else available, just TV and my github for now, ain’t no legacy academic industry I always have fun about, but back in 2k20 when I consciously ain’t known much about quant, I remember seeing post by @alexgrover recreating Moving Regression Endpoint dropped on price chart (called LSMA here) as a linear filter combination of filters (yea yeah DSP terms) as 3WMA - 2SMA. Now it’s my time to do smth alike aye?
...
This script is remake of my 1st degree WLSMA via linear filter combo. It’s much faster, we aint calculate moving regression per se, we just match its freq response. You can see it on the screen (WLSMAfa) almost perfectly matching the original one (WLSMA).
...
While humans like to overfit, I fw generalizations. So your lovely WMA is actually just one case of a more general weight pattern: pow(len - i, e), where pow is the power function and e is the exponent itself. So:
- If e = 0, then we have SMA (every number in 0th power is one)
- If e = 1, we get WMA
- If e = 2, we get quadratic weights.
We can recreate WLSMA freq response then by combining 2 filters with e = 1 and e = 2.
This is still an approximation, even tho enormously precise for the tasks you’ve shared with me. Due to the non-linear nature of the thing it’s all we can do, and as window size grows, even this small discrepancy converges with true WLSMA value, so we’re all good. Pls don’t try to model this 0.00xxxx discrepancy, it’s not natural.
...
DSP approach is unnatural for prices, but you can put this thing on volume delta and be happy, or on other metrics of yours, if for some reason u dont wanna estimate thresholds by fitting a distro.
All good TV
∞
P.S.: strangely, the first script made & dropped in the location in Saint P where my actual quant way has started ~5 years ago xD, very thankful

Support and Resistance Logistic Regression | Flux Charts💎 GENERAL OVERVIEW
Introducing our new Logistic Regression Support / Resistance indicator! This tool leverages advanced statistical modeling "Logistic Regressions" to identify and project key price levels where the market is likely to find support or resistance. For more information about the process, please check the "HOW DOES IT WORK ?" section.
Logistic Regression Support / Resistance Features :
Intelligent S/R Identification : The indicator uses a logistic regression model to intelligently identify and plot significant support and resistance levels.
Predictive Probability : Each identified level comes with a calculated probability, indicating how likely it is to act as a true support or resistance based on historical data.
Retest & Break Labels : The indicator clearly marks on your chart when a detected support or resistance level is retested (price touches and respects the level) or broken (price decisively crosses through the level).
Alerts : Real-time alerts for support retests, resistance retests, support breaks, and resistance breaks.
Customizable : You can change support & resistance line style, width and colors.
🚩 UNIQUENESS
What makes this indicator truly unique is its application of logistic regression to the concept of support and resistance. Instead of merely identifying historical highs and lows, our indicator uses a statistical model to predict the future efficacy of these levels. It analyzes underlying market conditions (like RSI and body size at pivot formation) to assign a probability to each potential S/R zone. This predictive insight, combined with dynamic, real-time labeling of retests and breaks, provides a more robust and adaptive understanding of market structure than traditional, purely historical methods.
📌HOW DOES IT WORK ?
The Logistic Regression Support / Resistance indicator operates in several key steps:
First, it identifies significant pivot highs and lows on the chart based on a user-defined "Pivot Length." These pivots are potential areas of support or resistance.
For each detected pivot, the indicator extracts relevant market data at that specific point, including the RSI (Relative Strength Index) and the Body Size (the absolute difference between the open and close price of the candle). These serve as input features for the model.
The core of the indicator lies in its logistic regression model. This model is continuously trained on past pivot data and their subsequent behavior (i.e., whether they were "respected" as support/resistance multiple times). It learns the relationship between the extracted features (RSI, Body Size) and the likelihood of a pivot becoming a significant S/R level.
When a new pivot is identified, the model uses its learned insights to calculate a prediction value—a probability (from 0 to 1) that this specific pivot will act as a strong support or resistance.
If the calculated probability exceeds a user-defined "Probability Threshold," the pivot is designated a "Regression Pivot" and drawn on the chart as a support or resistance line. The indicator then actively tracks how price interacts with these levels, displaying "R" labels for retests when the price bounces off the level and "B" labels for breaks when the price closes beyond it.
⚙️ SETTINGS
1. General Configuration
Pivot Length: This setting defines the number of bars used to determine a significant high or low for pivot detection.
Target Respects: This input specifies how many times a level must be "respected" by price action for it to be considered a strong support or resistance level by the underlying model.
Probability Threshold: This is the minimum probability output from the logistic regression model for a detected pivot to be considered a valid support or resistance level and be plotted on the chart.
2. Style
Show Prediction Labels: Enable or disable labels that display the calculated probability of a newly identified regression S/R level.
Show Retests: Toggle the visibility of "R" labels on the chart, which mark instances where price has retested a support or resistance level.
Show Breaks: Toggle the visibility of "B" labels on the chart, which mark instances where price has broken through a support or resistance level.

TrueTrend MaxRThe TrueTrend MaxR indicator is designed to identify the most consistent exponential price trend over extended periods. It uses statistical analysis on log-transformed prices to find the trendline that best fits historical price action, and highlights the most frequently tested or traded level within that trend channel.
For optimal results, especially on high timeframes such as weekly or monthly, it is recommended to use this indicator on charts set to logarithmic scale. This ensures proper visual alignment with the exponential nature of long-term price movements.
How it works
The indicator tests 50 different lookback periods, ranging from 300 to 1280 bars. For each period, it:
- Applies a linear regression on the natural logarithm of the price
- Computes the slope and intercept of the trendline
- Calculates the unbiased standard deviation from the regression line
- Measures the correlation strength using Pearson's R coefficient
The period with the highest Pearson R value is selected, meaning the trendline drawn corresponds to the log-scale trend with the best statistical fit.
Trendline and deviation bands
Once the optimal period is identified, the indicator plots:
- A main log-scale trendline
- Upper and lower bands, based on a user-defined multiple of the standard deviation
These bands help visualize how far price deviates from its core trend, and define the range of typical fluctuations.
Point of Control (POC)
Inside the trend channel, the space between upper and lower bands is divided into 15 logarithmic levels. The script evaluates how often price has interacted with each level, using one of two selectable methods:
- Touches: Counts the number of candles crossing each level
- Volume: Weighs each touch by the traded volume at that candle
The level with the highest cumulative interaction is considered the dynamic Point of Control (POC), and is plotted as a line.
Annualized performance and confidence display
When used on daily or weekly timeframes, the script also calculates the annualized return (CAGR) based on the detected trend, and displays:
- A performance estimate in percentage terms
- A textual label describing the confidence level based on the Pearson R value
Why this indicator is useful
- Automatically detects the most statistically consistent exponential trendline
- Designed for log-scale analysis, suited to long-term investment charts
- Highlights key price levels frequently visited or traded within the trend
- Provides objective, data-based trend and volatility insights
- Displays annualized growth rate and correlation strength for quick evaluation
Notes
- All calculations are performed only on the last bar
- No future data is used, and the script does not repaint
- Works on any instrument or timeframe, with optimal use on higher timeframes and logarithmic scaling

Custom Paul MACD-likePaul MACD is an indicator created by David Paul. It is implemented to effectively represent trend periods and non-trend (sideways/consolidation) periods, and its calculation method is particularly designed to reduce whipsaw.
Unlike the existing MACD which uses the difference between short-term (12) and long-term (26) exponential moving averages (EMA), Paul MACD has a different calculation method. This indicator uses a "center value" or "intermediate value". Calculation occurs when this intermediate value is higher than the High value (specifically, the difference between the center and High is calculated) or lower than the Low value (specifically, the difference between the center and Low is calculated). Otherwise, the value becomes 0. Here, the High and Low values are intended to be smoothly reflected using Smoothed Moving Average (SMMA). The indicator's method itself (using SMMA and ZLMA) is aimed at diluting whipsaws.
Thanks to this calculation method, in sections where whipsaw occurs, meaning when the intermediate value is between High and Low, the indicator value is expressed as 0 and appears as a horizontal line (zero line). This serves to visually clearly show sideways/consolidation periods.

Linear Regression ForecastDescription:
This indicator computes a series of simple linear regressions anchored at the current bar, using look-back windows from 2 bars up to the user-defined maximum. Each regression line is projected forward by the same number of bars as its look-back, producing a family of forecast endpoints. These endpoints are then connected into a continuous polyline: ascending segments are drawn in green, and descending segments in red.
Inputs:
maxLength – Maximum number of bars to include in the longest regression (minimum 2)
priceSource – Price series used for regression (for example, close, open, high, low)
lineWidth – Width of each line segment
Calculation:
For each window size N (from 2 to maxLength):
• Compute least-squares slope and intercept over the N most recent bars (with bar 0 = current bar, bar 1 = one bar ago, etc.).
• Project the regression line to bar_index + N to obtain the forecast price.
Collected forecast points are sorted by projection horizon and then joined:
• First segment: current bar’s price → first forecast point
• Subsequent segments: each forecast point → next forecast point
Segment colors reflect slope direction: green for non-negative, red for negative.
Usage:
Apply this overlay to any price chart. Adjust maxLength to control the depth and reach of the forecast fan. Observe how shorter windows produce nearer-term, more reactive projections, while longer windows yield smoother, more conservative forecasts. Use the colored segments to gauge the overall bias of the fan at each step.
Limitations:
This tool is for informational and educational purposes only. It relies on linear regression assumptions and past price behavior; it does not guarantee future performance. Users should combine it with other technical or fundamental analyses and risk management practices.
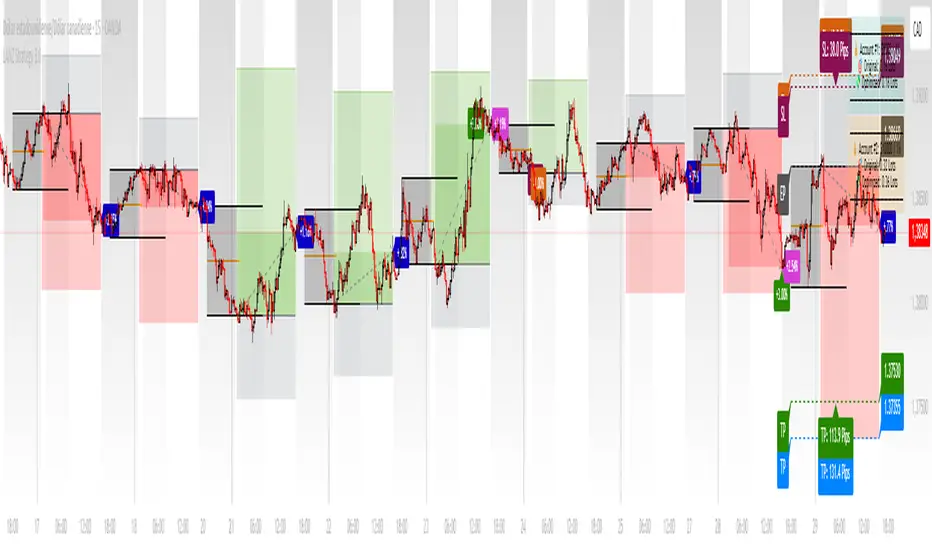
LANZ Strategy 3.0 [Backtest]🔷 LANZ Strategy 3.0 — Asian Range Fibonacci Scalping Strategy
LANZ Strategy 3.0 is a precision-engineered backtesting tool tailored for intraday traders who rely on the Asian session range to determine directional bias. This strategy implements dynamic Fibonacci projections and strict time-window validation to simulate a clean and disciplined trading environment.
🧠 Core Components:
Asian Range Bias Definition: Direction is established between 01:15–02:15 a.m. NY time based on the candle’s close in relation to the midpoint of the Asian session range (18:00–01:15 NY).
Limit Order Execution: Only one trade is placed daily, using a limit order at the Asian range high (for sells) or low (for buys), between 01:15–08:00 a.m. NY.
Fibonacci-Based TP/SL:
Original Mode: TP = 2.25x range, SL = 0.75x range.
Optimized Mode: TP = 1.95x range, SL = 0.65x range.
No Trade After 08:00 NY: If the limit order is not executed before 08:00 a.m. NY, it is canceled.
Fallback Logic at 02:15 NY: If the market direction misaligns with the setup at 02:15 a.m., the system re-evaluates and can re-issue the order.
End-of-Day Closure: All positions are closed at 15:45 NY if still open.
📊 Backtest-Ready Design:
Entries and exits are executed using strategy.entry() and strategy.exit() functions.
Position size is fixed via capital risk allocation ($100 per trade by default).
Only one position can be active at a time, ensuring controlled risk.
📝 Notes:
This strategy is ideal for assets sensitive to the Asian/London session overlap, such as Forex pairs and indices.
Easily switch between Fibonacci versions using a single dropdown input.
Fully deterministic: all entries are based on pre-defined conditions and time constraints.
👤 Credits:
Strategy developed by rau_u_lanz using Pine Script v6. Built for traders who favor clean sessions, directional clarity, and consistent execution using time-based logic and Fibonacci projections.

Tangent Extrapolation ForecastTangent Extrapolation Forecast
This indicator visually projects price direction by drawing a smoothed sequence of tangent lines based on recent price movements. For each bar in a user-defined lookback window, it calculates the slope over a smoothing period and extends the projected price forward. The resulting polyline forecast connect the endpoints of the extrapolations, and is color-coded to reflect directional changes: green for upward moves, red for downward, and gray for flat segments. This tool can assist traders in visualizing short-term momentum and potential trend continuity without introducing artificial future gaps.
Inputs:
Bars to Use: Number of historical bars used in the forecast.
Slope Smoothing Window: The number of bars used to calculate slope for projection.
Source: Price input for calculations (default is close).
This indicator does not generate buy/sell signals. It is intended as a visual aid to support discretionary analysis.

Linear Volume MACD | Lyro RS📊 Linear Volume MACD | Lyro RS is an advanced momentum and trend detection tool that fuses price action with volume-weighted MACD logic and linear regression analysis . Designed for traders seeking deeper insights into market strength and directional conviction, this indicator highlights trend shifts, volume anomalies, and potential reversal zones with precision.
✨ Key Features :
🔁 Multi-Mode Analysis: Switch between Linear Regression , Strong/Weak Trend , or Volume MACD logic.
📐 Volume-Adjusted MACD: Incorporates volume for a more realistic momentum view.
📊 Linear Regression Signal: Smoother and more reactive trend analysis.
🎯 Dynamic Stdev Bands: Visualize ±1 and ±2 standard deviation thresholds for anomaly detection.
🌈 Custom Color Themes: Choose from built-in palettes or define your own bullish/bearish signal colors.
⚠️ Alert Conditions: Built-in alerts notify you of potential trend shifts across all signal modes.
📈 How It Works :
🧮 MACD Core: Uses volume-weighted price to generate fast and slow EMAs, forming the MACD and signal lines.
📉 Histogram Logic: Histogram is either the traditional MACD histogram or its linear regression version.
📊 Signal Modes:
• Linear Regression: Detect trend based on smoothed MACD behavior.
• Strong/Weak Trend: Identifies accelerating/decelerating trend strength.
• Volume MACD: Classic volume MACD behavior for divergence spotting.
📏 Stdev Bands: Calculated over a long period (default 200) to highlight statistically significant moves.
🎨 Color-coded Feedback: Bar and background colors adjust dynamically with market condition.
⚙️ Customization Options :
🔄 Choose your Signal Type from three unique analysis modes.
📏 Modify Fast/Slow/Signal lengths and Regression parameters to suit your strategy.
📈 Enable or disable Stdev Bands and adjust multiplier.
🎨 Select from Classic, Mystic, Accented, or Royal color palettes — or create your own.
📌 Use Cases :
🟢 Identify trend continuation or reversal zones with volume-adjusted signals.
🔴 Detect volatility breakouts using standard deviation bands.
🧭 Use in confluence with price structure, RSI, or market sentiment.
⚠️ Disclaimer :
This indicator is for educational purposes only. It is not financial advice. Always use in conjunction with your own research and risk management strategy.

Weighted Regression Bands (Zeiierman)█ Overview
Weighted Regression Bands is a precision-engineered trend and volatility tool designed to adapt to the real market structure instead of reacting to price noise.
This indicator analyzes Weighted High/Low medians and applies user-selectable smoothing methods — including Kalman Filtering, ALMA, and custom Linear Regression — to generate a Fair Value line. Around this, it constructs dynamic standard deviation bands that adapt in real-time to market volatility.
The result is a visually clean and structurally intelligent trend framework suitable for breakout traders, mean reversion strategies, and trend-driven analysis.
█ How It Works
⚪ Structural High/Low Analysis
At the heart of this indicator is a custom high/low weighting system. Instead of using just the raw high or low values, it calculates a midline = (high + low) / 2, then applies one of three weighting methods to determine which price zones matter most.
Users can select the method using the “Weighted HL Method” setting:
Simple
Selects the single most dominant median (highest or lowest) in the lookback window. Ideal for fast, reactive signals.
Advanced
Ranks each bar based on a composite score: median × range × recency. This method highlights structurally meaningful bars that had both volatility and recency. A built-in Kalman filter is applied for extra stability.
Smooth
Blends multiple bars into a single weighted average using smoothed decay and range. This provides the softest and most stable structural response.
⚪ Smoothing Methods (ALMA / Linear Regression)
ALMA provides responsive, low-lag smoothing for fast trend reading.
Linear Regression projects the Fair Value forward, ideal for trend modeling.
⚪ Kalman Smoothing Filter
Before trend calculations, the indicator applies an optional Kalman-style smoothing filter. This helps:
Reduce choppy false shifts in trend,
Retain signal clarity during volatile periods,
Provide stability for long-term setups.
⚪ Deviation Bands (Dynamic Volatility Envelopes)
The indicator builds ±1, ±2, and ±3 standard deviation bands around the fair value line:
Calculated from the standard deviation of price,
Bands expand and contract based on recent volatility,
Visualizes potential overbought/oversold or trending conditions.
█ How to Use
⚪ Trend Trading & Filtering
Use the Fair Value line to identify the dominant direction.
Only trade in the direction of the slope for higher probability setups.
⚪ Volatility-Based Entries
Watch for price reaching outer bands (+2σ, +3σ) for possible exhaustion.
Mean reversion entries become higher quality when far from Fair Value.
█ Settings
Length – Lookback for Weighted HL and trend smoothing
Deviation Multiplier – Controls how wide the bands are from the fair value line
Method – Choose between ALMA or Linear Regression smoothing
Smoothing – Strength of Kalman Filter (1 = none, <1 = stronger smoothing)
-----------------
Disclaimer
The content provided in my scripts, indicators, ideas, algorithms, and systems is for educational and informational purposes only. It does not constitute financial advice, investment recommendations, or a solicitation to buy or sell any financial instruments. I will not accept liability for any loss or damage, including without limitation any loss of profit, which may arise directly or indirectly from the use of or reliance on such information.
All investments involve risk, and the past performance of a security, industry, sector, market, financial product, trading strategy, backtest, or individual's trading does not guarantee future results or returns. Investors are fully responsible for any investment decisions they make. Such decisions should be based solely on an evaluation of their financial circumstances, investment objectives, risk tolerance, and liquidity needs.

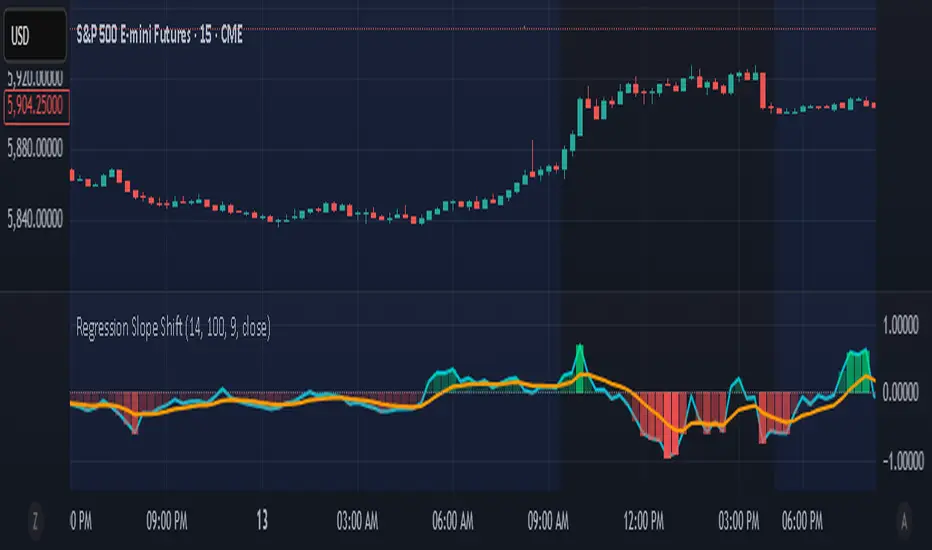
Regression Slope ShiftNormalized Regression Slope Shift + Dynamic Histogram
This indicator detects subtle shifts in price momentum using a rolling linear regression approach. It calculates the slope of a linear regression line for each bar over a specified lookback period, then measures how that slope changes from bar to bar.
Both the slope and its change (delta) are normalized to a -1 to 1 scale for consistent visual interpretation across assets and timeframes. A signal line (EMA) is applied to the slope delta to help identify turning points and crossovers.
Key features:
- Normalized slope and slope change lines
- Dynamic histogram of slope delta with transparency based on magnitude
- Customizable colors for all visual elements
- Signal line for crossover-based momentum shifts
This tool helps traders anticipate trend acceleration or weakening before traditional momentum indicators react, making it useful for early trend detection, divergence spotting, and confirmation signals.
Cointegration Heatmap & Spread Table [EdgeTerminal]The Cointegration Heatmap is a powerful visual and quantitative tool designed to uncover deep, statistically meaningful relationships between assets.
Unlike traditional indicators that react to price movement, this tool analyzes the underlying statistical relationship between two time series and tracks when they diverge from their long-term equilibrium — offering actionable signals for mean-reversion trades .
What Is Cointegration?
Most traders are familiar with correlation, which measures how two assets move together in the short term. But correlation is shallow — it doesn’t imply a stable or predictable relationship over time.
Cointegration, however, is a deeper statistical concept: Two assets are cointegrated if a linear combination of their prices or returns is stationary , even if the individual series themselves are non-stationary.
Cointegration is a foundational concept in time series analysis, widely used by hedge funds, proprietary trading firms, and quantitative researchers. This indicator brings that institutional-grade concept into an easy-to-use and fully visual TradingView indicator.
This tool helps answer key questions like:
“Which stocks tend to move in sync over the long term?”
“When are two assets diverging beyond statistical norms?”
“Is now the right time to short one and long the other?”
Using a combination of regression analysis, residual modeling, and Z-score evaluation, this indicator surfaces opportunities where price relationships are stretched and likely to snap back — making it ideal for building low-risk, high-probability trade setups.
In simple terms:
Cointegrated assets drift apart temporarily, but always come back together over time. This behavior is the foundation of successful pairs trading.
How the Indicator Works
Cointegration Heatmap indicator works across any market supported on TradingView — from stocks and ETFs to cryptocurrencies and forex pairs.
You enter your list of symbols, choose a timeframe, and the indicator updates every bar with live cointegration scores, spread signals, and trade-ready insights.
Indicator Settings:
Symbol list: a customizable list of symbols separated by commas
Returns timeframe: time frame selection for return sampling (Weekly or Monthly)
Max periods: max periods to limit the data to a certain time and to control indicator performance
This indicator accomplishes three major goals in one streamlined package:
Identifies stable long-term relationships (cointegration) between assets, using a heatmap visualization.
Tracks the spread — the difference between actual prices and the predicted linear relationship — between each pair.
Generates trade signals based on Z-score deviations from the mean spread, helping traders know when a pair is statistically overextended and likely to mean revert.
The math:
Returns are calculated using spread tickers to ensure alignment in time and adjust for dividends, splits, and other inconsistencies.
For each unique pair of symbols, we perform a linear regression
Yt=α+βXt+ε
Then we compute the residuals (errors from the regression):
Spreadt=Yt−(α+βXt)
Calculate the standard deviation of the spread over a moving window (default: 100 samples) and finally, define the Cointegration Score:
S=1/Standard Deviation of Residuals
This means, the lower the deviation, the tighter the relationship, so higher scores indicate stronger cointegration.
Always remember that cointegration can break down so monitor the asset over time and over multiple different timeframes before making a decision.
How to use the indicator
The heatmap table:
The indicator displays 2 very important tables, one in the middle and one on the right side. After entering your symbols, the first table to pay attention to is the middle heatmap table.
Any assets with a cointegration value of 25% is something to pay attention to and have a strong and stable relationship. Anything below is weak and not tradable.
Additionally, the 40% level is another important line to cross. Assets that have a cointegration score of over 40% will most likely have an extremely strong relationship.
Think about it this way, the higher the percentage, the tighter and more statistically reliable the relationship is.
The spread table:
After finding a good asset pair using heatmap, locate the same pair in the spread table (right side).
Here’s what you’ll see on the table:
Spread: Current difference between the two symbols based on the regression fit
Mean: Historical average of that spread
Z-score: How far current spread is from the mean in standard deviations
Signal: Trade suggestion: Short, Long, or Neutral
Since you’re expecting mean reversion, the idea is that the spread will return to the average. You want to take a trade when the z-score is either over +2 or below -2 and exit when z-score returns to near 0.
You will usually see the trade suggestion on the spread chart but you can make your own decision based on your risk level.
Keep in mind that the Z-score for each pair refers to how off the first asset is from the mean compared to the second one, so for example if you see STOCKA vs STOCKB with a Z-score of -1.55, we are regressing STOCKB (Y) on STOCKA (X).
In this case, STOCKB is the quoted asset and STOCKA is the base asset.
In this case, this means that STOCKB is much lower than expected relative to STOCKA, so the trade would be a long position on stock B and short position on stock A.

Index Futures vs Cash ArbitrageThis indicator measures the statistical spread between major stock index futures and their corresponding cash indices (e.g., ES vs SPX, NQ vs NDX) using Z-score normalization. It automatically detects commonly traded index pairs (S&P 500, Nasdaq, Dow Jones, Russell 2000) and calculates a smoothed spread between futures and spot prices. A Z-score is then derived from this spread to highlight potential overpricing or underpricing conditions.
Traders can use customizable thresholds to identify mean-reversion opportunities where the futures contract may be temporarily overvalued or undervalued relative to the index. The histogram highlights the direction of the Z-score (green = futures > index, red = futures < index), while built-in alerts notify users of key threshold breaches or zero-line crosses.
This tool is designed for discretionary traders, pairs traders, or anyone exploring statistical arbitrage strategies between futures and spot markets. It is not a buy/sell signal by itself and should be used with additional confluence or risk management techniques.

Bober XM v2.0# ₿ober XM v2.0 Trading Bot Documentation
**Developer's Note**: While our previous Bot 1.3.1 was removed due to guideline violations, this setback only fueled our determination to create something even better. Rising from this challenge, Bober XM 2.0 emerges not just as an update, but as a complete reimagining with multi-timeframe analysis, enhanced filters, and superior adaptability. This adversity pushed us to innovate further and deliver a strategy that's smarter, more agile, and more powerful than ever before. Challenges create opportunity - welcome to Cryptobeat's finest work yet.
## !!!!You need to tune it for your own pair and timeframe and retune it periodicaly!!!!!
## Overview
The ₿ober XM v2.0 is an advanced dual-channel trading bot with multi-timeframe analysis capabilities. It integrates multiple technical indicators, customizable risk management, and advanced order execution via webhook for automated trading. The bot's distinctive feature is its separate channel systems for long and short positions, allowing for asymmetric trade strategies that adapt to different market conditions across multiple timeframes.
### Key Features
- **Multi-Timeframe Analysis**: Analyze price data across multiple timeframes simultaneously
- **Dual Channel System**: Separate parameter sets for long and short positions
- **Advanced Entry Filters**: RSI, Volatility, Volume, Bollinger Bands, and KEMAD filters
- **Machine Learning Moving Average**: Adaptive prediction-based channels
- **Multiple Entry Strategies**: Breakout, Pullback, and Mean Reversion modes
- **Risk Management**: Customizable stop-loss, take-profit, and trailing stop settings
- **Webhook Integration**: Compatible with external trading bots and platforms
### Strategy Components
| Component | Description |
|---------|-------------|
| **Dual Channel Trading** | Uses either Keltner Channels or Machine Learning Moving Average (MLMA) with separate settings for long and short positions |
| **MLMA Implementation** | Machine learning algorithm that predicts future price movements and creates adaptive bands |
| **Pivot Point SuperTrend** | Trend identification and confirmation system based on pivot points |
| **Three Entry Strategies** | Choose between Breakout, Pullback, or Mean Reversion approaches |
| **Advanced Filter System** | Multiple customizable filters with multi-timeframe support to avoid false signals |
| **Custom Exit Logic** | Exits based on OBV crossover of its moving average combined with pivot trend changes |
### Note for Novice Users
This is a fully featured real trading bot and can be tweaked for any ticker — SOL is just an example. It follows this structure:
1. **Indicator** – gives the initial signal
2. **Entry strategy** – decides when to open a trade
3. **Exit strategy** – defines when to close it
4. **Trend confirmation** – ensures the trade follows the market direction
5. **Filters** – cuts out noise and avoids weak setups
6. **Risk management** – controls losses and protects your capital
To tune it for a different pair, you'll need to start from scratch:
1. Select the timeframe (candle size)
2. Turn off all filters and trend entry/exit confirmations
3. Choose a channel type, channel source and entry strategy
4. Adjust risk parameters
5. Tune long and short settings for the channel
6. Fine-tune the Pivot Point Supertrend and Main Exit condition OBV
This will generate a lot of signals and activity on the chart. Your next task is to find the right combination of filters and settings to reduce noise and tune it for profitability.
### Default Strategy values
Default values are tuned for: Symbol BITGET:SOLUSDT.P 5min candle
Filters are off by default: Try to play with it to understand how it works
## Configuration Guide
### General Settings
| Setting | Description | Default Value |
|---------|-------------|---------------|
| **Long Positions** | Enable or disable long trades | Enabled |
| **Short Positions** | Enable or disable short trades | Enabled |
| **Risk/Reward Area** | Visual display of stop-loss and take-profit zones | Enabled |
| **Long Entry Source** | Price data used for long entry signals | hl2 (High+Low/2) |
| **Short Entry Source** | Price data used for short entry signals | hl2 (High+Low/2) |
The bot allows you to trade long positions, short positions, or both simultaneously. Each direction has its own set of parameters, allowing for fine-tuned strategies that recognize the asymmetric nature of market movements.
### Multi-Timeframe Settings
1. **Enable Multi-Timeframe Analysis**: Toggle 'Enable Multi-Timeframe Analysis' in the Multi-Timeframe Settings section
2. **Configure Timeframes**: Set appropriate higher timeframes based on your trading style:
- Timeframe 1: Default is now 15 minutes (intraday confirmation)
- Timeframe 2: Default is 4 hours (trend direction)
3. **Select Sources per Indicator**: For each indicator (RSI, KEMAD, Volume, etc.), choose:
- The desired timeframe (current, mtf1, or mtf2)
- The appropriate price type (open, high, low, close, hl2, hlc3, ohlc4)
### Entry Strategies
- **Breakout**: Enter when price breaks above/below the channel
- **Pullback**: Enter when price pulls back to the channel
- **Mean Reversion**: Enter when price is extended from the channel
You can enable different strategies for long and short positions.
### Core Components
### Risk Management
- **Position Size**: Control risk with percentage-based position sizing
- **Stop Loss Options**:
- Fixed: Set a specific price or percentage from entry
- ATR-based: Dynamic stop-loss based on market volatility
- Swing: Uses recent swing high/low points
- **Take Profit**: Multiple targets with percentage allocation
- **Trailing Stop**: Dynamic stop that follows price movement
## Advanced Usage Strategies
### Moving Average Type Selection Guide
- **SMA**: More stable in choppy markets, good for higher timeframes
- **EMA/WMA**: More responsive to recent price changes, better for entry signals
- **VWMA**: Adds volume weighting for stronger trends, use with Volume filter
- **HMA**: Balance between responsiveness and noise reduction, good for volatile markets
### Multi-Timeframe Strategy Approaches
- **Trend Confirmation**: Use higher timeframe RSI (mtf2) for overall trend, current timeframe for entries
- **Entry Precision**: Use KEMAD on current timeframe with volume filter on mtf1
- **False Signal Reduction**: Apply RSI filter on mtf1 with strict KEMAD settings
### Market Condition Optimization
| Market Condition | Recommended Settings |
|------------------|----------------------|
| **Trending** | Use Breakout strategy with KEMAD filter on higher timeframe |
| **Ranging** | Use Mean Reversion with strict RSI filter (mtf1) |
| **Volatile** | Increase ATR multipliers, use HMA for moving averages |
| **Low Volatility** | Decrease noise parameters, use pullback strategy |
## Webhook Integration
The strategy features a professional webhook system that allows direct connectivity to your exchange or trading platform of choice through third-party services like 3commas, Alertatron, or Autoview.
The webhook payload includes all necessary parameters for automated execution:
- Entry price and direction
- Stop loss and take profit levels
- Position size
- Custom identifier for webhook routing
## Performance Optimization Tips
1. **Start with Defaults**: Begin with the default settings for your timeframe before customizing
2. **Adjust One Component at a Time**: Make incremental changes and test the impact
3. **Match MA Types to Market Conditions**: Use appropriate moving average types based on the Market Condition Optimization table
4. **Timeframe Synergy**: Create logical relationships between timeframes (e.g., 5min chart with 15min and 4h higher timeframes)
5. **Periodic Retuning**: Markets evolve - regularly review and adjust parameters
## Common Setups
### Crypto Trend-Following
- MLMA with EMA or HMA
- Higher RSI thresholds (75/25)
- KEMAD filter on mtf1
- Breakout entry strategy
### Stock Swing Trading
- MLMA with SMA for stability
- Volume filter with higher threshold
- KEMAD with increased filter order
- Pullback entry strategy
### Forex Scalping
- MLMA with WMA and lower noise parameter
- RSI filter on current timeframe
- Use highest timeframe for trend direction only
- Mean Reversion strategy
## Webhook Configuration
- **Benefits**:
- Automated trade execution without manual intervention
- Immediate response to market conditions
- Consistent execution of your strategy
- **Implementation Notes**:
- Requires proper webhook configuration on your exchange or platform
- Test thoroughly with small position sizes before full deployment
- Consider latency between signal generation and execution
### Backtesting Period
Define a specific historical period to evaluate the bot's performance:
| Setting | Description | Default Value |
|---------|-------------|---------------|
| **Start Date** | Beginning of backtest period | January 1, 2025 |
| **End Date** | End of backtest period | December 31, 2026 |
- **Best Practice**: Test across different market conditions (bull markets, bear markets, sideways markets)
- **Limitation**: Past performance doesn't guarantee future results
## Entry and Exit Strategies
### Dual-Channel System
A key innovation of the Bober XM is its dual-channel approach:
- **Independent Parameters**: Each trade direction has its own channel settings
- **Asymmetric Trading**: Recognizes that markets often behave differently in uptrends versus downtrends
- **Optimized Performance**: Fine-tune settings for both bullish and bearish conditions
This approach allows the bot to adapt to the natural asymmetry of markets, where uptrends often develop gradually while downtrends can be sharp and sudden.
### Channel Types
#### 1. Keltner Channels
Traditional volatility-based channels using EMA and ATR:
| Setting | Long Default | Short Default |
|---------|--------------|---------------|
| **EMA Length** | 37 | 20 |
| **ATR Length** | 13 | 17 |
| **Multiplier** | 1.4 | 1.9 |
| **Source** | low | high |
- **Strengths**:
- Reliable in trending markets
- Less prone to whipsaws than Bollinger Bands
- Clear visual representation of volatility
- **Weaknesses**:
- Can lag during rapid market changes
- Less effective in choppy, non-trending markets
#### 2. Machine Learning Moving Average (MLMA)
Advanced predictive model using kernel regression (RBF kernel):
| Setting | Description | Options |
|---------|-------------|--------|
| **Source MA** | Price data used for MA calculations | Any price source (low/high/close/etc.) |
| **Moving Average Type** | Type of MA algorithm for calculations | SMA, EMA, WMA, VWMA, RMA, HMA |
| **Trend Source** | Price data used for trend determination | Any price source (close default) |
| **Window Size** | Historical window for MLMA calculations | 5+ (default: 16) |
| **Forecast Length** | Number of bars to forecast ahead | 1+ (default: 3) |
| **Noise Parameter** | Controls smoothness of prediction | 0.01+ (default: ~0.43) |
| **Band Multiplier** | Multiplier for channel width | 0.1+ (default: 0.5-0.6) |
- **Strengths**:
- Predictive rather than reactive
- Adapts quickly to changing market conditions
- Better at identifying trend reversals early
- **Weaknesses**:
- More computationally intensive
- Requires careful parameter tuning
- Can be sensitive to input data quality
### Entry Strategies
| Strategy | Description | Ideal Market Conditions |
|----------|-------------|-------------------------|
| **Breakout** | Enters when price breaks through channel bands, indicating strong momentum | High volatility, emerging trends |
| **Pullback** | Enters when price retraces to the middle band after testing extremes | Established trends with regular pullbacks |
| **Mean Reversion** | Enters at channel extremes, betting on a return to the mean | Range-bound or oscillating markets |
#### Breakout Strategy (Default)
- **Implementation**: Enters long when price crosses above the upper band, short when price crosses below the lower band
- **Strengths**: Captures strong momentum moves, performs well in trending markets
- **Weaknesses**: Can lead to late entries, higher risk of false breakouts
- **Optimization Tips**:
- Increase channel multiplier for fewer but more reliable signals
- Combine with volume confirmation for better accuracy
#### Pullback Strategy
- **Implementation**: Enters long when price pulls back to middle band during uptrend, short during downtrend pullbacks
- **Strengths**: Better entry prices, lower risk, higher probability setups
- **Weaknesses**: Misses some strong moves, requires clear trend identification
- **Optimization Tips**:
- Use with trend filters to confirm overall direction
- Adjust middle band calculation for market volatility
#### Mean Reversion Strategy
- **Implementation**: Enters long at lower band, short at upper band, expecting price to revert to the mean
- **Strengths**: Excellent entry prices, works well in ranging markets
- **Weaknesses**: Dangerous in strong trends, can lead to fighting the trend
- **Optimization Tips**:
- Implement strong trend filters to avoid counter-trend trades
- Use smaller position sizes due to higher risk nature
### Confirmation Indicators
#### Pivot Point SuperTrend
Combines pivot points with ATR-based SuperTrend for trend confirmation:
| Setting | Default Value |
|---------|---------------|
| **Pivot Period** | 25 |
| **ATR Factor** | 2.2 |
| **ATR Period** | 41 |
- **Function**: Identifies significant market turning points and confirms trend direction
- **Implementation**: Requires price to respect the SuperTrend line for trade confirmation
#### Weighted Moving Average (WMA)
Provides additional confirmation layer for entries:
| Setting | Default Value |
|---------|---------------|
| **Period** | 15 |
| **Source** | ohlc4 (average of Open, High, Low, Close) |
- **Function**: Confirms trend direction and filters out low-quality signals
- **Implementation**: Price must be above WMA for longs, below for shorts
### Exit Strategies
#### On-Balance Volume (OBV) Based Exits
Uses volume flow to identify potential reversals:
| Setting | Default Value |
|---------|---------------|
| **Source** | ohlc4 |
| **MA Type** | HMA (Options: SMA, EMA, WMA, RMA, VWMA, HMA) |
| **Period** | 22 |
- **Function**: Identifies divergences between price and volume to exit before reversals
- **Implementation**: Exits when OBV crosses its moving average in the opposite direction
- **Customizable MA Type**: Different MA types provide varying sensitivity to OBV changes:
- **SMA**: Traditional simple average, equal weight to all periods
- **EMA**: More weight to recent data, responds faster to price changes
- **WMA**: Weighted by recency, smoother than EMA
- **RMA**: Similar to EMA but smoother, reduces noise
- **VWMA**: Factors in volume, helpful for OBV confirmation
- **HMA**: Reduces lag while maintaining smoothness (default)
#### ADX Exit Confirmation
Uses Average Directional Index to confirm trend exhaustion:
| Setting | Default Value |
|---------|---------------|
| **ADX Threshold** | 35 |
| **ADX Smoothing** | 60 |
| **DI Length** | 60 |
- **Function**: Confirms trend weakness before exiting positions
- **Implementation**: Requires ADX to drop below threshold or DI lines to cross
## Filter System
### RSI Filter
- **Function**: Controls entries based on momentum conditions
- **Parameters**:
- Period: 15 (default)
- Overbought level: 71
- Oversold level: 23
- Multi-timeframe support: Current, MTF1 (15min), or MTF2 (4h)
- Customizable price source (open, high, low, close, hl2, hlc3, ohlc4)
- **Implementation**: Blocks long entries when RSI > overbought, short entries when RSI < oversold
### Volatility Filter
- **Function**: Prevents trading during excessive market volatility
- **Parameters**:
- Measure: ATR (Average True Range)
- Period: Customizable (default varies by timeframe)
- Threshold: Adjustable multiplier
- Multi-timeframe support
- Customizable price source
- **Implementation**: Blocks trades when current volatility exceeds threshold × average volatility
### Volume Filter
- **Function**: Ensures adequate market liquidity for trades
- **Parameters**:
- Threshold: 0.4× average (default)
- Measurement period: 5 (default)
- Moving average type: Customizable (HMA default)
- Multi-timeframe support
- Customizable price source
- **Implementation**: Requires current volume to exceed threshold × average volume
### Bollinger Bands Filter
- **Function**: Controls entries based on price relative to statistical boundaries
- **Parameters**:
- Period: Customizable
- Standard deviation multiplier: Adjustable
- Moving average type: Customizable
- Multi-timeframe support
- Customizable price source
- **Implementation**: Can require price to be within bands or breaking out of bands depending on strategy
### KEMAD Filter (Kalman EMA Distance)
- **Function**: Advanced trend confirmation using Kalman filter algorithm
- **Parameters**:
- Process Noise: 0.35 (controls smoothness)
- Measurement Noise: 24 (controls reactivity)
- Filter Order: 6 (higher = more smoothing)
- ATR Length: 8 (for bandwidth calculation)
- Upper Multiplier: 2.0 (for long signals)
- Lower Multiplier: 2.7 (for short signals)
- Multi-timeframe support
- Customizable visual indicators
- **Implementation**: Generates signals based on price position relative to Kalman-filtered EMA bands
## Risk Management System
### Position Sizing
Automatically calculates position size based on account equity and risk parameters:
| Setting | Default Value |
|---------|---------------|
| **Risk % of Equity** | 50% |
- **Implementation**:
- Position size = (Account equity × Risk %) ÷ (Entry price × Stop loss distance)
- Adjusts automatically based on volatility and stop placement
- **Best Practices**:
- Start with lower risk percentages (1-2%) until strategy is proven
- Consider reducing risk during high volatility periods
### Stop-Loss Methods
Multiple stop-loss calculation methods with separate configurations for long and short positions:
| Method | Description | Configuration |
|--------|-------------|---------------|
| **ATR-Based** | Dynamic stops based on volatility | ATR Period: 14, Multiplier: 2.0 |
| **Percentage** | Fixed percentage from entry | Long: 1.5%, Short: 1.5% |
| **PIP-Based** | Fixed currency unit distance | 10.0 pips |
- **Implementation Notes**:
- ATR-based stops adapt to changing market volatility
- Percentage stops maintain consistent risk exposure
- PIP-based stops provide precise control in stable markets
### Trailing Stops
Locks in profits by adjusting stop-loss levels as price moves favorably:
| Setting | Default Value |
|---------|---------------|
| **Stop-Loss %** | 1.5% |
| **Activation Threshold** | 2.1% |
| **Trailing Distance** | 1.4% |
- **Implementation**:
- Initial stop remains fixed until profit reaches activation threshold
- Once activated, stop follows price at specified distance
- Locks in profit while allowing room for normal price fluctuations
### Risk-Reward Parameters
Defines the relationship between risk and potential reward:
| Setting | Default Value |
|---------|---------------|
| **Risk-Reward Ratio** | 1.4 |
| **Take Profit %** | 2.4% |
| **Stop-Loss %** | 1.5% |
- **Implementation**:
- Take profit distance = Stop loss distance × Risk-reward ratio
- Higher ratios require fewer winning trades for profitability
- Lower ratios increase win rate but reduce average profit
### Filter Combinations
The strategy allows for simultaneous application of multiple filters:
- **Recommended Combinations**:
- Trending markets: RSI + KEMAD filters
- Ranging markets: Bollinger Bands + Volatility filters
- All markets: Volume filter as minimum requirement
- **Performance Impact**:
- Each additional filter reduces the number of trades
- Quality of remaining trades typically improves
- Optimal combination depends on market conditions and timeframe
### Multi-Timeframe Filter Applications
| Filter Type | Current Timeframe | MTF1 (15min) | MTF2 (4h) |
|-------------|-------------------|-------------|------------|
| RSI | Quick entries/exits | Intraday trend | Overall trend |
| Volume | Immediate liquidity | Sustained support | Market participation |
| Volatility | Entry timing | Short-term risk | Regime changes |
| KEMAD | Precise signals | Trend confirmation | Major reversals |
## Visual Indicators and Chart Analysis
The bot provides comprehensive visual feedback on the chart:
- **Channel Bands**: Keltner or MLMA bands showing potential support/resistance
- **Pivot SuperTrend**: Colored line showing trend direction and potential reversal points
- **Entry/Exit Markers**: Annotations showing actual trade entries and exits
- **Risk/Reward Zones**: Visual representation of stop-loss and take-profit levels
These visual elements allow for:
- Real-time strategy assessment
- Post-trade analysis and optimization
- Educational understanding of the strategy logic
## Implementation Guide
### TradingView Setup
1. Load the script in TradingView Pine Editor
2. Apply to your preferred chart and timeframe
3. Adjust parameters based on your trading preferences
4. Enable alerts for webhook integration
### Webhook Integration
1. Configure webhook URL in TradingView alerts
2. Set up receiving endpoint on your trading platform
3. Define message format matching the bot's output
4. Test with small position sizes before full deployment
### Optimization Process
1. Backtest across different market conditions
2. Identify parameter sensitivity through multiple tests
3. Focus on risk management parameters first
4. Fine-tune entry/exit conditions based on performance metrics
5. Validate with out-of-sample testing
## Performance Considerations
### Strengths
- Adaptability to different market conditions through dual channels
- Multiple layers of confirmation reducing false signals
- Comprehensive risk management protecting capital
- Machine learning integration for predictive edge
### Limitations
- Complex parameter set requiring careful optimization
- Potential over-optimization risk with so many variables
- Computational intensity of MLMA calculations
- Dependency on proper webhook configuration for execution
### Best Practices
- Start with conservative risk settings (1-2% of equity)
- Test thoroughly in demo environment before live trading
- Monitor performance regularly and adjust parameters
- Consider market regime changes when evaluating results
## Conclusion
The ₿ober XM v2.0 represents a significant evolution in trading strategy design, combining traditional technical analysis with machine learning elements and multi-timeframe analysis. The core strength of this system lies in its adaptability and recognition of market asymmetry.
### Market Asymmetry and Adaptive Approach
The strategy acknowledges a fundamental truth about markets: bullish and bearish phases behave differently and should be treated as distinct environments. The dual-channel system with separate parameters for long and short positions directly addresses this asymmetry, allowing for optimized performance regardless of market direction.
### Targeted Backtesting Philosophy
It's counterproductive to run backtests over excessively long periods. Markets evolve continuously, and strategies that worked in previous market regimes may be ineffective in current conditions. Instead:
- Test specific market phases separately (bull markets, bear markets, range-bound periods)
- Regularly re-optimize parameters as market conditions change
- Focus on recent performance with higher weight than historical results
- Test across multiple timeframes to ensure robustness
### Multi-Timeframe Analysis as a Game-Changer
The integration of multi-timeframe analysis fundamentally transforms the strategy's effectiveness:
- **Increased Safety**: Higher timeframe confirmations reduce false signals and improve trade quality
- **Context Awareness**: Decisions made with awareness of larger trends reduce adverse entries
- **Adaptable Precision**: Apply strict filters on lower timeframes while maintaining awareness of broader conditions
- **Reduced Noise**: Higher timeframe data naturally filters market noise that can trigger poor entries
The ₿ober XM v2.0 provides traders with a framework that acknowledges market complexity while offering practical tools to navigate it. With proper setup, realistic expectations, and attention to changing market conditions, it delivers a sophisticated approach to systematic trading that can be continuously refined and optimized.

PolyBand Convergence System (PBCS)PolyBand Convergence System (PBCS)
The PolyBand Convergence System (PBCS) is an advanced technical analysis indicator that combines multiple polynomial regressions with statistical bands to identify trend strength and potential reversal zones.
Key Features
Multi-Degree Polynomial Analysis: Combines 1st, 2nd, 3rd, and 4th degree polynomial regressions into a composite regression line
Adaptive Statistical Bands: Uses percentile-based bands enhanced with standard deviation multipliers
Asymmetric Volatility Measurement: Separately calculates upside and downside volatility for more accurate band placement
Smart Trend Detection: Identifies bullish, bearish, or neutral market conditions based on price position relative to bands
How It Works
PBCS creates a composite regression line from multiple polynomial fits to better capture the underlying price structure. This line is then surrounded by adaptive bands that represent statistical thresholds for price movement. When price breaks above the upper band, a bullish trend is signaled; when it breaks below the lower band, a bearish trend is indicated.
Customization Options
Regression Settings: Adjust source data, lookback period, and smoothing parameters
Percentile Controls: Fine-tune the statistical thresholds for upper and lower bands
Volatility Sensitivity: Modify standard deviation multipliers to control band width
Visual Preferences: Choose from multiple color schemes to match your trading platform
Disclaimer
This indicator is provided for educational and informational purposes only and does not constitute investment advice. Trading involves risk and may result in financial loss. Always perform your own research and consult with a qualified financial advisor before making any trading decisions.

Kernel Regression Bands SuiteMulti-Kernel Regression Bands
A versatile indicator that applies kernel regression smoothing to price data, then dynamically calculates upper and lower bands using a wide variety of deviation methods. This tool is designed to help traders identify trend direction, volatility, and potential reversal zones with customizable visual styles.
Key Features
Multiple Kernel Types: Choose from 17+ kernel regression styles (Gaussian, Laplace, Epanechnikov, etc.) for smoothing.
Flexible Band Calculation: Select from 12+ deviation types including Standard Deviation, Mean/Median Absolute Deviation, Exponential, True Range, Hull, Parabolic SAR, Quantile, and more.
Adaptive Bands: Bands are calculated around the kernel regression line, with a user-defined multiplier.
Signal Logic: Trend state is determined by crossovers/crossunders of price and bands, coloring the regression line and band fills accordingly.
Custom Color Modes: Six unique color palettes for visual clarity and personal preference.
Highly Customizable Inputs: Adjust kernel type, lookback, deviation method, band source, and more.
How to Use
Trend Identification: The regression line changes color based on the detected trend (up/down)
Volatility Zones: Bands expand/contract with volatility, helping spot breakouts or mean-reversion opportunities.
Visual Styling: Use color modes to match your chart theme or highlight specific market states.
Credits:
Kernel regression logic adapted from:
ChartPrime | Multi-Kernel-Regression-ChartPrime (Link in the script)
Disclaimer
This script is for educational and informational purposes only. Not financial advice. Use at your own risk.

Open-Close / High-Low RibbonThis indicator visualizes smoothed Open, Close, High, and Low price levels as continuous lines, helping users observe underlying price structure with reduced noise. The Open and Close values are shaded to highlight bullish (green) or bearish (red) zones based on their relationship. Smoothing is applied using a simple moving average (SMA) over a user-defined length to make trends easier to interpret. This tool can be useful for identifying directional bias, trend shifts, or areas of support and resistance on any timeframe.
Linear Regression Volume | Lyro RSLinear Regression Volume | Lyro RS
⚠️Disclaimer⚠️
Always combine this indicator with other forms of analysis and risk management. Please do your own research before making any trading decisions.
The LR Volume | 𝓛𝔂𝓻𝓸 𝓡𝓢 indicator blends linear regression with volume-adjusted moving average s to dynamically outline price equilibrium and trend intensity. By integrating volume into its regression model, it highlights meaningful price movement relative to trading activity.
📌 How It Works:
Volume-Weighted Regression Baseline
Price is filtered through one of four volume-adjusted moving averages (SMA, RMA, HMA, ALMA) before being passed through a linear regression model, forming a dynamic fair value line.
Deviation Bands
The indicator plots 1x, 2x, and 3x standard deviation zones above and below the baseline, helping identify potential extremes, volatility spikes, and mean reversion areas.
Slope-Based Color Logic
The baseline and fill areas are dynamically colored:
- 🟢 Green for positive slope (uptrend)
- 🔴 Red for negative slope (downtrend)
- ⚪ Gray for neutral movement
⚙️ Inputs & Options:
Regression Length – Controls how many bars are used in the moving average and regression calculation.
Deviation Multiplier – Adjusts the width of the bands surrounding the regression baseline.
MA Type – Choose from 4 types:
SMA (Simple Moving Average)
RMA (Relative Moving Average)
HMA (Hull Moving Average)
ALMA (Arnaud Legoux Moving Average)
Band Colors – Customizable upper/lower band colors to match your visual style.
🔔 Alerts:
Long Signal – Triggers when the regression slope turns positive.
Short Signal – Triggers when the regression slope turns negative.

LANZ Strategy 3.0🔷 LANZ Strategy 3.0 — Asian Range Fibonacci Strategy with Execution Window Logic
LANZ Strategy 3.0 is a rule-based trading system that utilizes the Asian session range to project Fibonacci levels and manage entries during a defined execution window. Designed for Forex and index traders, this strategy focuses on structured price behavior around key levels before the New York session.
🧠 Core Components:
Asian Session Range Mapping: Automatically detects the high, low, and midpoint during the Asian session.
Fibonacci Level Projection: Projects configurable Fibonacci retracement and extension levels based on the Asian range.
Execution Window Logic: Uses the 01:15 NY candle as a reference to validate potential reversals or continuation setups.
Conditional Entry System: Includes logic for limit order entries (buy or sell) at specific Fib levels, with reversal logic if price breaks structure before execution.
Risk Management: Entry orders are paired with dynamic SL and TP based on Fibonacci-based distances, maintaining a risk-reward ratio consistent with intraday strategies.
📊 Visual Features:
Asian session high/low/mid lines.
Fibonacci levels: Original (based on raw range) and Optimized (user-adjustable).
Session background coloring for Asia, Execution Window, and NY session.
Labels and lines for entry, SL, and TP targets.
Dynamic deletion of untriggered orders after execution window expires.
⚙️ How It Works:
The script calculates the Asian session range.
Projects Fibonacci levels from the range.
Waits for the 01:15 NY candle to close to validate a signal.
If valid, a limit entry order (BUY or SELL) is plotted at the selected level.
If price structure changes (e.g., breaks the high/low), reversal logic may activate.
If no trade is triggered, orders are cleared before the NY session.
🔔 Alerts:
Alerts trigger when a valid setup appears after 01:15 NY candle.
Optional alerts for order activation, SL/TP hit, or trade cancellation.
📝 Notes:
Intended for semi-automated or discretionary trading.
Best used on highly liquid markets like Forex majors or indices.
Script parameters include session times, Fib ratios, SL/TP settings, and reversal logic toggle.
Credits:
Developed by LANZ, this script merges traditional session-based analysis with Fibonacci tools and structured execution timing, offering a unique framework for morning volatility plays.