Quick Valuation V.1.0 (Ibo)This Pine Script indicator performs a Quick Discounted Cash Flow (DCF)-style Valuation to estimate the intrinsic value of a stock.
It calculates a projected Fair Value and a Margin of Safety based on user inputs or automatically pulled financial data from TradingView (like revenue, growth, margin, and exit P/E). It also automatically computes a Discount Rate using a modified CAPM model.
Key Features
Valuation Output: Calculates a target Fair Value and the resulting Margin of Safety.
Data Flexibility: Automatically pulls essential fundamentals (Revenue, Margins, Shares Outstanding, etc.) but allows the user to override any value (revenue, growth, P/E, shares, etc.) via the settings.
Automated Discount Rate: Calculates the Discount Rate (Cost of Equity) using the current 10-Year Real Yield and a computed or user-defined Beta.
Clear Display: Presents all input metrics, calculated values, and data sources (TradingView or User Input) in a neat table on the chart.
Quick

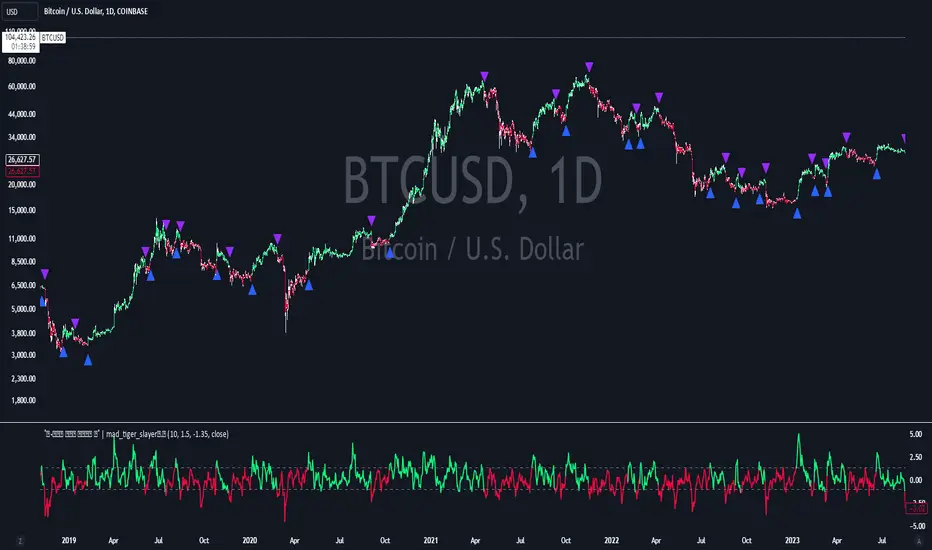
PGO For Loop | mad_tiger_slayerPGO For Loop Indicator
The PGO For Loop indicator, inspired by Alex Orekhov's "Pretty Good Oscillator," and indicator originally made by Mark Johnson, the PGO designed as a fast and responsive tool to capture quick price movements in financial markets. This oscillator leverages a combination of moving averages and Average True Range (ATR) to measure price deviations, providing a concise yet powerful framework for identifying potential trade entry and exit points. What makes this
"enhanced" PGO indicator special is its ability to identify trending periods more accurately. By using thresholds, this allows the script to enter accurate long and short conditions extremely quickly.
Intended Uses:
Used to capture long-term trends:
Used to identify quick reversals:
Used on higher timeframes above 8hrs for more accurate signals
Used in strategies to enter and exit trades quickly
Can be used for Scalping
NOT Intended Uses:
Not to be used as Mean Reversion
Not to be used as valuation (Overbought or Oversold)
Key Features:
Quick Detection of Market Movements:
The indicator's primary focus is on speed, making it suitable for medium-term traders looking to capitalize on rapid price changes. It is particularly effective in trending or volatile markets.
Customizable Thresholds:
Users can set upper and lower thresholds to define long and short conditions, offering flexibility to adapt the indicator to different trading styles and asset classes.
Noisy but Purposeful:
While the PGO For Loop may generate frequent signals, it is specifically tuned for traders aiming to enter and exit trades quickly, embracing the noise as part of its effectiveness in capturing rapid market dynamics.
Integrated Visuals:
The script plots key levels and provides dynamic visual feedback through colored candles and shapes, enabling intuitive and quick decision-making.
How It Works:
Oscillator Calculation:
The PGO value is derived by comparing the source price's deviation from its moving average to the ATR. This highlights price movements relative to recent volatility.
Signal Identification:
When the oscillator exceeds the upper threshold, it signals potential long opportunities UNTIL the PGO reaches the lower threshold.
When the oscillator drops below the lower threshold, it signals potential short opportunities UNTIL the oscillator reaches above the upper threshold.
No signals occur when the oscillator lies between these thresholds.
Visual Cues:
Color-coded candles indicate market bias (green for long, red for short, gray for neutral).
Upward and downward triangles highlight changes in signal direction.
Note:
This indicator is intentionally "noisy," as it prioritizes capturing fast movements over filtering out minor fluctuations. Users should pair it with other tools or techniques to confirm signals and manage risk effectively.
[TTI] Mike Webster Quick Break, QuickSand & Grateful Dead RS📜 ––––HISTORY & CREDITS–––
This TradingView script, " Mike Webster (Webby) Quick Break, Quicksand & Grateful Dead RS," is inspired by the trading methodology developed by Mike Webster. The concept was shared by Webster in a Twitter post, where he emphasized the strategy's role in managing a core position in a winning stock. Webster's approach is unique as it is based on Relative Strength (RS) line movements and their interaction with fast and slow moving averages. Credits go to Mike Webster for the foundational concept and to the script developer for adapting it into this practical tool.
🦄 –––UNIQUENESS–––
The uniqueness of this script lies in its innovative use of the Relative Strength line in conjunction with two distinct moving averages. It features three key stages:
"Quick Break," where the RS line crosses the fast-moving average;
"Quicksand," where the RS line moves lower than its level during the "Quick Break";
"Grateful Dead Break," where the RS line crosses the slow-moving average.
This approach offers a dynamic and nuanced method to manage positions in trending stocks. The indicator plots little triangle shapes above the bars/candles, which violate the rules. Colors can be changed in settings.
🎯 ––––WHAT IT DOES––––
The script monitors and signals three critical phases in stock holding based on the Relative Strength line and moving averages.
👉First, the "Quick Break" indicates a potential short-term weakening in trend strength.
👉Following this, the "Quicksand" condition suggests a further decline in relative performance, prompting a more defensive stance.
👉Finally, the "Grateful Dead Break" signals a more significant trend reversal, potentially warranting the liquidation of the position.
These signals are visualized as shapes plotted on the chart for easy recognition.
🛠️ ––––HOW TO USE IT––––
To use this indicator, traders should input their desired index for RS comparison and adjust the moving average lengths and types according to their strategy. The default settings are an 8-period fast moving average and a 21-period slow moving average, but these can be modified. The script generates alerts for each of the three conditions - Quick Break, Quicksand, and Grateful Dead Break - aiding traders in decision-making. It is crucial to note that this tool is designed for managing a core position in a winning stock and should be used in conjunction with a comprehensive trading strategy. Testing and understanding the pros and cons of this method before implementation is advised, as emphasized by Mike Webster.

Quick LevelsQuick Levels allow users to quickly add multiple levels to their chart all at once through an intuitive user interface!
No need to fiddle with drawing lines and then inputting their exact position afterwards, do all of it with one string of numbers!
Insert multiple levels at once, simply separate your price levels by commas(,).
Insert levels across tickers to save time when switching between charts.
Notes:
For users coming from "Copy/Paste Levels", this system is very robust.
The only user input variable that is not multiple choice is the "levels" box. I have taken steps to fool proof this box, by (input processing) removing spaces, removing commas at the start or end, and replacing semicolons with commas. You can see in the cover chart that the inputs for the first level have a lot of spaces and a comma at the end, yet it does not effect the output.
If there is no ticker entered in the "Ticker" box, the levels will be drawn on your current chart.
Enjoy!

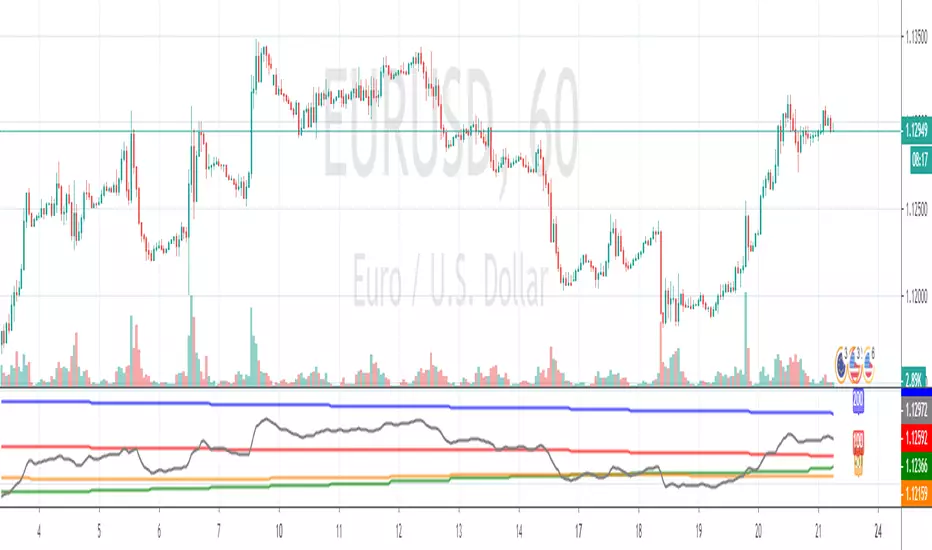
Daily Moving Averages OscillatorThis is the best way I've found so far for gauging directional bias (i.e. overall trend) at-a-glance. It shows current price in black along with the 20, 50 & 100 daily MAs, all of which are visible at all times, and from all timeframes. No wondering where the 100MA is cause it's now showing on the chart. I also find this good for keeping my charts visually cleaner. Having the undulating lines moved underneath makes it easier for me to see support/resistance and other imporant stuff,
The trend is your friend and this helps to make sure you're on the right side of a trade.
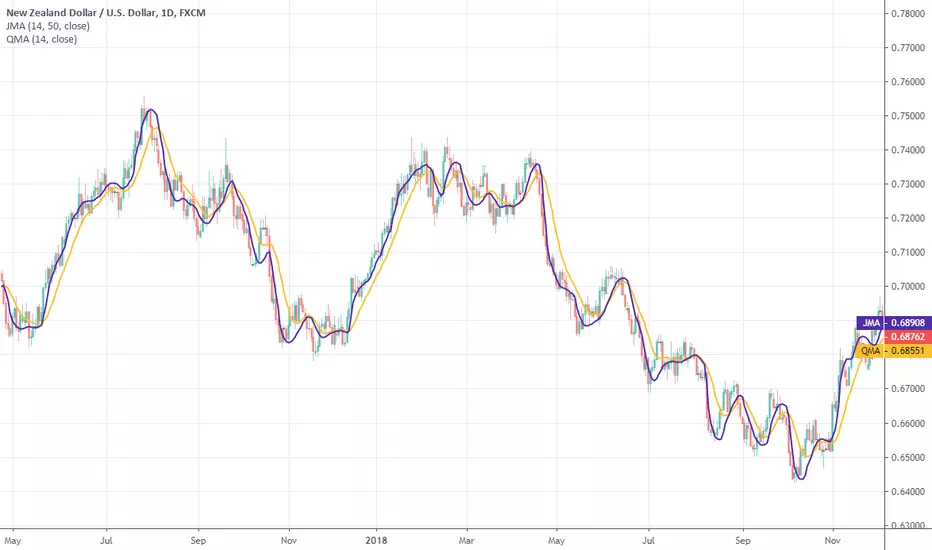
Quick Moving AverageThis moving average was originally developed by John McCormick in 2008 as NinjaTrader indicator. The purpose was to find a cheap replacement for JMA ( ).
Well, not impressive concerning the response.
Source code on request .