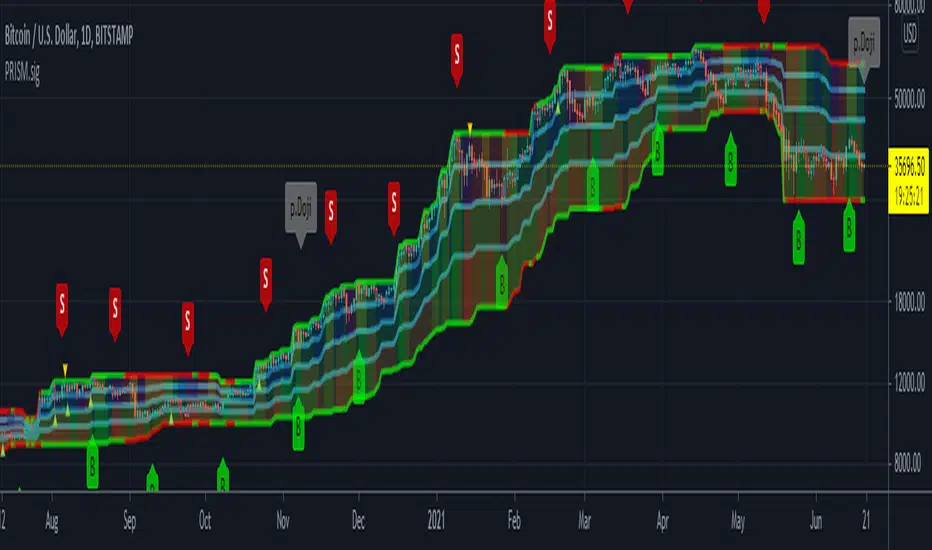
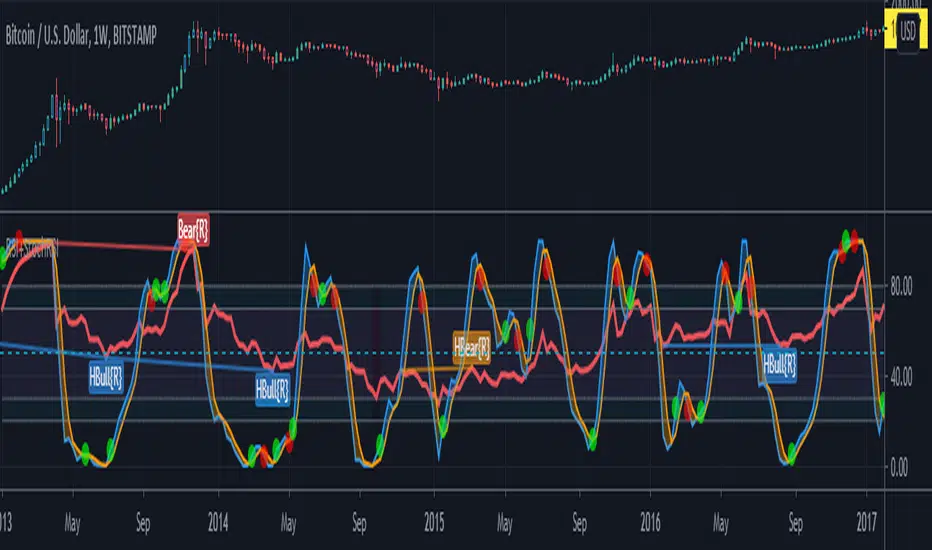
PRISM Signals {PREMIUM}PRISM Signals is an advance algorithm designed to generate bullish/bearish signals derived from the scoring of the PRISM oscillators set as its driving engine, with >1000 lines of code .
The PRISM Oscillator Set consists of:
(1) A modified-pSAR derived main driving oscillator (P-Oscillator).
(2) With MAJeStic (Momentum, Acceleration, Jerk, Snap) Oscillators Set (M-, A-, J-, S-Oscillators respectively).
Users are advised to manually back-test and optimize the settings for a particular chart and time frame, before proceeding with its use.
This script is typically used in conjunction with the Cyber Ensemble signaling algorithm -- another sophisticated signaling script base on the interplay of an ensemble of optimized indicators and market state filters; as well as the PRISM oscillators set .
Note: In no way is this intended as a financial/investment/trading advice. You are responsible for your own investment/trade decisions.
Prism
Super EMA PrismThis script implements the Binary Trade Logic (BTL) algorithm to calculate two distinct scores that range from 0 to 7. One score is calculated assigning a power of 2 weight to the positive sign of 3 Phi^3 distant Moving Average (MA) slopes. The other score is calculated assigning a power of 2 weight to the sign of the difference between the price and the value of 3 Phi^3 distant Moving Average (MA).
For the first score, hereafter called as the angle score (AS), the largest MA slope positive sign receives weight 4, the middle length MA slope positive sign receives weight 2 and the shortest MA slope positive sign receives weight 1. The positive sign of an MA is defined as 1 if the slope of the MA is positive and 0, otherwise. Therefore, for MAs 305, 72 and 17, if slope(MA305) > 0, slope(MA72) < 0 and slope(MA17) > 0, then score will be 4*1 + 2*0 + 1*1 = 5. Up to my knowledge, this score was first proposed by Bo Williams and named by him as Prisma.
For the second score, hereafter called as the value score (VS), if the price > largest MA, it receives weight 4. If the price > the middle length MA, it receives weight 2 and if the price > the the shortest MA, it receives weight 1. Therefore, for MAs 305, 72 and 17, if price < MA305, price > MA72 and price > MA17, then score will be 4*0 + 2*1 + 1*1 = 3. Up to my knowledge, this score was first proposed by Bo Williams and named by him as Prisma.
Both AS and VS are calculated for Phi^3 lengths (610, 144, 34) and for Phi^3/2 lengths (305, 72, 17). The scores of the same kind calculated for each set of length are combined multiplying the Phi^3 length score by 10 and adding with with the Phi^3/2 score, therefore providing a 2 digit score ranging from 0 to 77. For instance, if we have AS(610, 144, 34) = 7 and AS(305, 72, 17) = 5, we have AS=75. At the same time, if we have VS(610, 144, 34) = 6 and VS(305, 72, 17) = 4, we have VS=64.
VS score is plotted by default in black, but it can be on white for dark themes. AS is plotted with the color of the longest MA used.
Chart background is colored according to the range of values for AS and VS, checked in the following order:
if AS >= 13 and VS <= 13 then back color = red
if AS >= 13 or VS <= 13 then back color = orange
if AS >= 64 and VS >= 64 then back color = green
if AS >= 64 or VS >= 64 then back color = blue
otherwise back color = none (white o black)

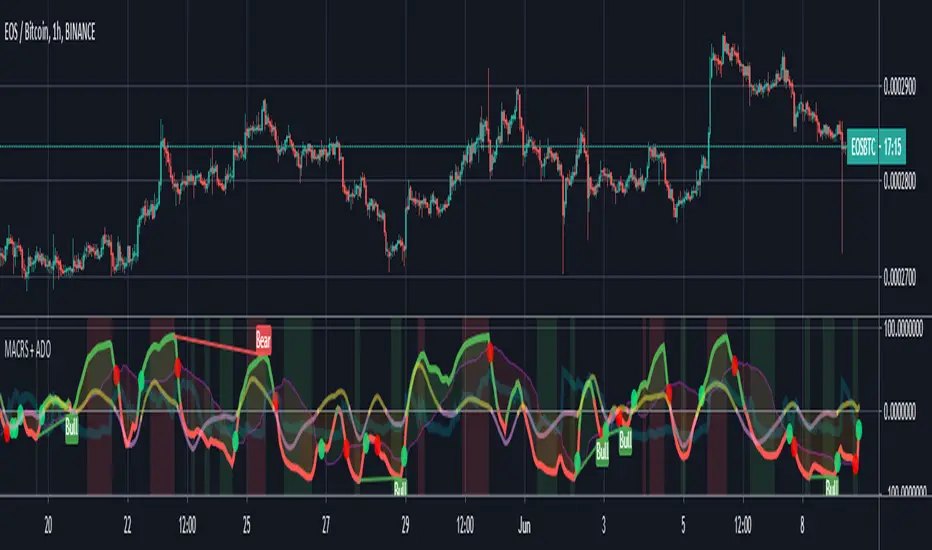
MACRS {Lite}This is the open-source stripped down version of the full-featured RSI-MACD indicator (MACRS), with the ADO and the option to filter out weekend price action removed.
The main oscillator is the RSI modulated by the MACD (default). The RSI mode can be disabled to revert to a normal MACD oscillator for the main oscillator.
When the main oscillator (thicker line) is > 0, it is green; and if it is < 0, it is red.
The MACD can be re-scaled and whenever its value > 100, a background fill between the oscillator and the zeroline appear to indicates overbought condition; and < -100 indicates oversold condition. The user can tweak the scaling factor to optimize this for a given chart and timeframe.
A (thick transparent light blue) volume oscillator is also provided. An increase in volume trend provides confirmation of (or solidifies) the movements in the main oscillator over that period. A falling volume oscillator trend raises doubts on the main oscillator trend, and hints of the possibility of a counter-trend (also look at the secondary ADO oscillator for clues).
The novel aspects and principles of this indicator and this source code are the property of © cybernetwork.
This indicator and script is free for the TV community to use.

MACD modulated RSIThe main oscillator is the RSI modulated by the MACD (default). The RSI mode can be disabled to revert to a normal MACD oscillator for the main oscillator.
When the main oscillator (thicker line) is > 0, it is green; and if it is < 0, it is red.
The MACD can be re-scaled and whenever its value > 100, a background fill between the oscillator and the zeroline appear to indicates overbought condition; and < -100 indicates oversold condition. The user can tweak the scaling factor to optimize this for a given chart and timeframe.
A proprietary asymmetric differential oscillator (ADO) is also implemented, which is modulated by the main oscillator. When this (thinner line) secondary oscillator is > 0, it is yellow; and when it is < 0, it is lavender. The user can select the order of the differential (i.e. Order 1 = Momentum, Order 2 = Acceleration, Order 3 = Jerk, Order 4 = Snap, Order 5 = Crackle, Order 6 = Pop). This oscillator provides details of the more subtle underlying/hidden trends that is emerging or brewing, and may hint of an incoming move ahead of time. Divergence in the sign and slope of this secondary oscillator with respect to the main oscillator may provide a useful edge for trade setup.
A (thick transparent light blue) volume oscillator is also provided. An increase in volume trend provides confirmation of (or solidifies) the movements in the main oscillator over that period. A falling volume oscillator trend raises doubts on the main oscillator trend, and hints of the possibility of a counter-trend (also look at the secondary ADO oscillator for clues).
The novel aspects and principles of this indicator and this source code are the property of © cybernetwork.
This indicator and script is free for the TV community to use.
Multiple Moving Averages {Cybernetwork}Multiple moving average (MA) plots in a single script.
Can select between different MA types, and enable/disable a particular MA in the settings.
Enjoy. :)

JERK UP {LM.Alerts Edition} (D)This is the " LONGS-MANAGEMENT Alerts " {LM.Alerts} Edition of JERK UP to enable auto-trading via alerts signaling.
Only the long-signals, generated from the underlying JERK UP algorithm, is used in this strategy-alerts script, with my latest risk-exit (collect gains) and stop-limit algorithms, as well as a bear-market filter, implemented.
~ * ~ * ~ * ~ * ~ * ~ * ~ * ~ * ~ * ~ * ~ * ~ * ~ * ~ * ~ * ~ * ~ * ~ * ~ * ~ * ~
Since {LM.Alerts} engine only focuses on trading and managing longs, a bear-market filter is implemented base on the FUSIONGAPS indicator.
The FUSIONGAPS algorithm signals local bull or bear market phases, and then disables trades conditionally to reduce the chances of having to take losses during a local bear market phase (since the short-signals are not traded).
Enabling the different (Fastest >> Slowest) FUSIONGAPS levels (e.g. 50/15, 100/50, 200/50, 200/100, etc) activates the use of each of these levels to decide the local bull/bear market phases.
So in summary, the {LM.Alerts} algorithm trades up a bullish-hill, taking profits along the way; but stops all trading activity when the market is rolling down a bearish-hill; and then once a local bull-phase is detected again, it resumes trading, etc.
Note: To trade on both bullish and bearish phases, {LM.Alerts} scripts can be applied on an inverse-chart (i.e. 0-BTCUSD) for shorts.
The {LM.Alerts} engine will be ported to my other more powerful trade-signaling scripts in the future.
~ * ~ * ~ * ~ * ~ * ~ * ~ * ~ * ~ * ~ * ~ * ~ * ~ * ~ * ~ * ~ * ~ * ~ * ~ * ~ * ~
FUSIONGAPS V5
Note: In no way is this intended as a financial/investment/trading advice. You are responsible for your own investment decisions and/or trades.
~JuniAiko
(=^~^=)v~
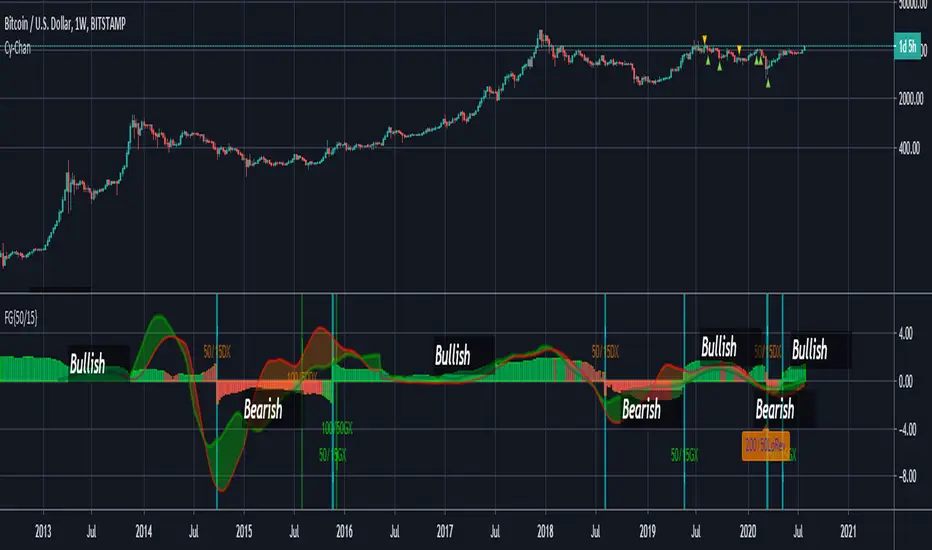
FUSIONGAPS V5Market bullish/bearish phase indicator , with trend-reversal and golden/death cross indicators.
This the re-implementation of my old script, now allowing the selection between different moving-averaging modes.
Note: In no way is this intended as a financial/investment/trading advice. You are responsible for your own investment decisions and/or trades.
~ JuniAiko
(=^~^=)v~

AEONDRIFT-KThis is a special edition of the AEONDRIFT Band that is implemented in my Strategies , which have substantially boosted their profitability.
Squeeze Zone = Increase chance for a big move to happen. I used this to decrease (buy/sell) trading thresholds in my strategy scripts to increase the chances of making a trade.
No Trading Zone = Increase chances for bad trades due to difficulty for indicators to . As the name implies, I used this to disable trading completely during this period.
Alerts are enabled for these states.
~ * ~ * ~ * ~ * ~ * ~ * ~ * ~ * ~ * ~ * ~ * ~ * ~ * ~ * ~ * ~ * ~ * ~ * ~ * ~ * ~
Note:
In no way is this intended as a financial/investment/trading advice. You are responsible for your own investment decisions and trades.
Please exercise your own judgement for your own trades base on your own risk-aversion level and goals as an investor or a trader. The use of OTHER indicators and analysis in conjunction (tailored to your own style of investing/trading) will help improve confidence of your analysis, for you to determine your own trade decisions.
~ * ~ * ~ * ~ * ~ * ~ * ~ * ~ * ~ * ~ * ~ * ~ * ~ * ~ * ~ * ~ * ~ * ~ * ~ * ~ * ~
Please check out my other indicators sets and series, e.g.
LIVIDITIUM (dynamic levels),
AEONDRIFT (multi-levels standard deviation bands),
FUSIONGAPS (MA based oscillators),
MAJESTIC (Momentum/Acceleration/Jerk Oscillators),
PRISM (pSAR based oscillator, with RSI/StochRSI as well as Momentum/Acceleration/Jerk indicators),
PDF (parabolic SAR /w HighLow Trends Indicator/Bar-color-marking + Dynamic Fib Retrace and Extension Level)
and more to come.
Constructive feedback and suggestions are welcome.
~ JuniAiko
(=^~^=)v~
AEONDRIFT
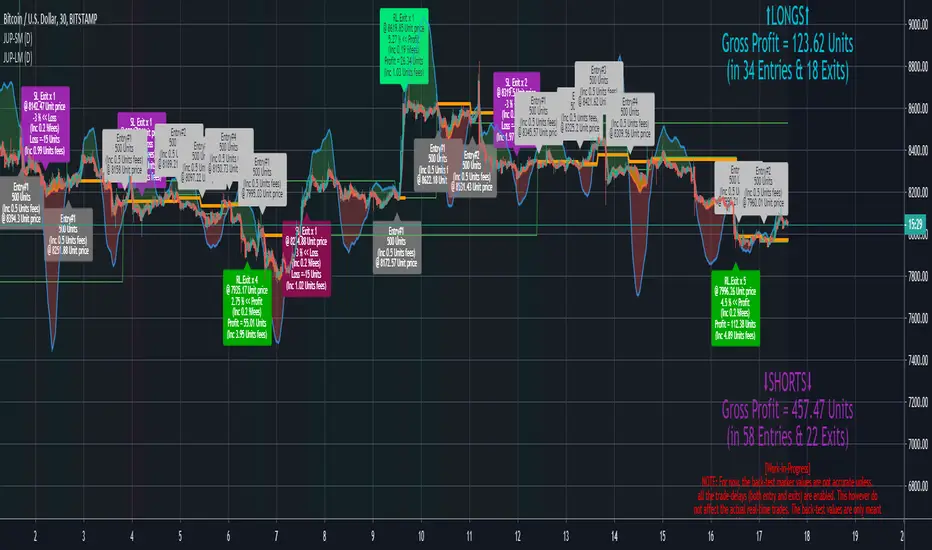
Strategy Scripts:
Cyber Momentum Strategy
Cyber Ensemble Strategy
See Also: Relative Candle Volatility & Directionality Index (RCVI and RCDI)

Relative Candle Volatility IndexI am not certain if something similar is already available out there. However, here's my own implementation of my simple idea of using the length of the candle-body, or wicks (high-low), to derive a Relative Volatility Index / Oscillator.
In summary: When the R.CVI is significantly positive, it indicates a sudden increase in volatility; whereas, when the R.CVI drops significantly negative, it indicates a sudden decrease in volatility -- in relative to the (just prior) market trend.
If you do wish to copy, modify, and publish an alternate version base on this script, please do not plagiarize and kindly reference/link back to this original script. =D
~ * ~ * ~ * ~ * ~ * ~ * ~ * ~ * ~ * ~ * ~ * ~ * ~ * ~ * ~ * ~ * ~ * ~ * ~ * ~ * ~
Note:
In no way is this intended as a financial/investment/trading advice. You are responsible for your own investment decisions and trades.
Please exercise your own judgement for your own trades base on your own risk-aversion level and goals as an investor or a trader. The use of OTHER indicators and analysis in conjunction (tailored to your own style of investing/trading) will help improve confidence of your analysis, for you to determine your own trade decisions.
~ * ~ * ~ * ~ * ~ * ~ * ~ * ~ * ~ * ~ * ~ * ~ * ~ * ~ * ~ * ~ * ~ * ~ * ~ * ~ * ~
Please check out my other indicators sets and series, e.g.
LIVIDITIUM (dynamic levels),
AEONDRIFT (multi-levels standard deviation bands),
FUSIONGAPS (MA based oscillators),
MAJESTIC (Momentum/Acceleration/Jerk Oscillators),
PRISM (pSAR based oscillator, with RSI/StochRSI as well as Momentum/Acceleration/Jerk indicators),
PDF (parabolic SAR /w HighLow Trends Indicator/Bar-color-marking + Dynamic Fib Retrace and Extension Level)
and more to come.
Constructive feedback and suggestions are welcome.
~ JuniAiko
(=^~^=)v~

FG-DIVERGENCE V4 {50/15-Series} [Buy/Sell]This script is derived from the FUSIONGAPS V4 {50/15-Series} to generate buy/sell signals.
~ * ~ * ~ * ~ * ~ * ~ * ~ * ~ * ~ * ~ * ~ * ~ * ~ * ~ * ~ * ~ * ~ * ~ * ~ * ~ * ~
Note:
In no way is this intended as a financial/investment/trading advice. You are responsible for your own investment decisions and trades.
Please exercise your own judgement for your own trades base on your own risk-aversion level and goals as an investor or a trader. The use of OTHER indicators and analysis in conjunction (tailored to your own style of investing/trading) will help improve confidence of your analysis, for you to determine your own trade decisions.
~ * ~ * ~ * ~ * ~ * ~ * ~ * ~ * ~ * ~ * ~ * ~ * ~ * ~ * ~ * ~ * ~ * ~ * ~ * ~ * ~
Please check out my other indicators sets and series, e.g.
LIVIDITIUM (dynamic levels),
AEONDRIFT (multi-levels standard deviation bands),
FUSIONGAPS (MA based oscillators),
MAJESTIC (Momentum/Acceleration/Jerk Oscillators),
PRISM (pSAR based oscillator, with RSI/StochRSI as well as Momentum/Acceleration/Jerk indicators),
PDF (parabolic SAR /w HighLow Trends Indicator/Bar-color-marking + Dynamic Fib Retrace and Extension Level)
and more to come.
Constructive feedback and suggestions are welcome.
~ JuniAiko
(=^~^=)v~
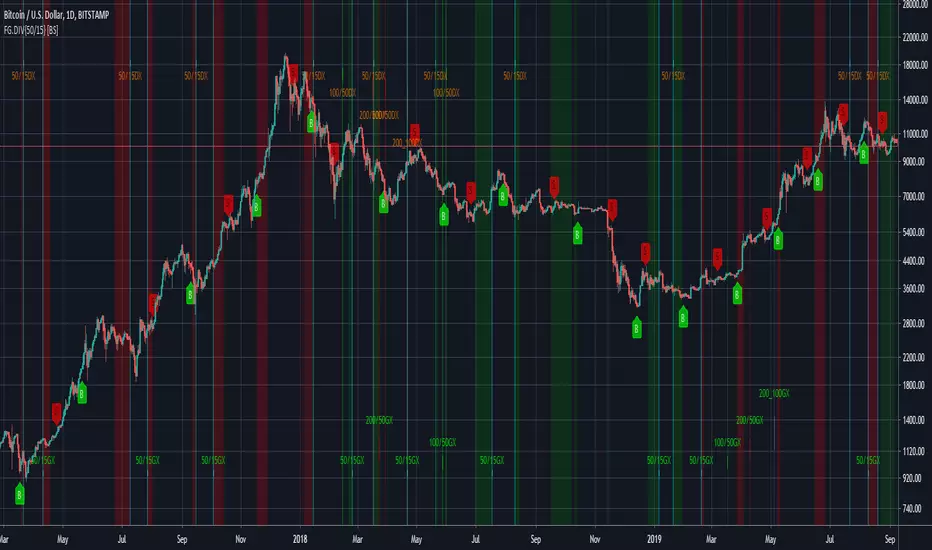
FG-DIVERGENCE V4 {50/15-Series}This script is derived from the FUSIONGAPS V4 {50/15-Series} to generate buy/sell signals.
Green Dot = Buy Signal
Red Dot = Sell Signal
~ * ~ * ~ * ~ * ~ * ~ * ~ * ~ * ~ * ~ * ~ * ~ * ~ * ~ * ~ * ~ * ~ * ~ * ~ * ~ * ~
Note:
In no way is this intended as a financial/investment/trading advice. You are responsible for your own investment decisions and trades.
Please exercise your own judgement for your own trades base on your own risk-aversion level and goals as an investor or a trader. The use of OTHER indicators and analysis in conjunction (tailored to your own style of investing/trading) will help improve confidence of your analysis, for you to determine your own trade decisions.
~ * ~ * ~ * ~ * ~ * ~ * ~ * ~ * ~ * ~ * ~ * ~ * ~ * ~ * ~ * ~ * ~ * ~ * ~ * ~ * ~
Please check out my other indicators sets and series, e.g.
LIVIDITIUM (dynamic levels),
AEONDRIFT (multi-levels standard deviation bands),
FUSIONGAPS (MA based oscillators),
MAJESTIC (Momentum/Acceleration/Jerk Oscillators),
PRISM (pSAR based oscillator, with RSI/StochRSI as well as Momentum/Acceleration/Jerk indicators),
PDF (parabolic SAR /w HighLow Trends Indicator/Bar-color-marking + Dynamic Fib Retrace and Extension Level)
and more to come.
Constructive feedback and suggestions are welcome.
~ JuniAiko
(=^~^=)v~
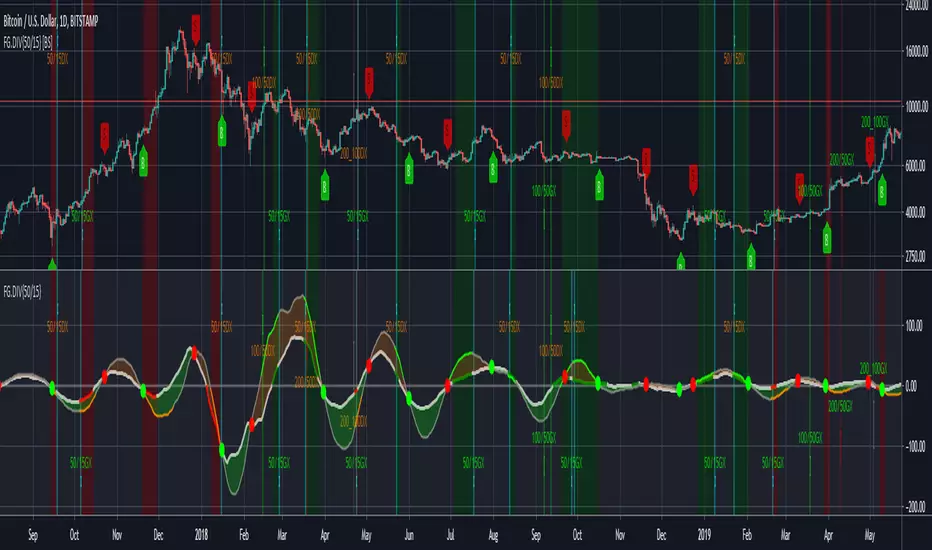
FUSIONGAPS V4 {50/15-Series}Base on the FUSIONGAPS oscillator series, but Only the 50/15 oscillator is plotted, and with Momentum and Acceleration oscillators added.
The thickest line is the FG oscillator: Red/Green coloring indicates if the market is in a Bearish/Bullish period.
The green colored line is the DFG oscillator (DIFFERENTIAL FUSIONGAPS: Price Momentum)
The red colored line is the D2FG oscillator (DOUBLE-DIFFERENTIAL FUSIONGAPS: Price Acceleration)
Indicators:
DeathCrosses ( DX ) and GoldenCrosses ( GX )
Momentum Reversal indicators (D2FG based filter applied to reduce false-positives, but can be manually disabled.)
~ * ~ * ~ * ~ * ~ * ~ * ~ * ~ * ~ * ~ * ~ * ~ * ~ * ~ * ~ * ~ * ~ * ~ * ~ * ~ * ~
Note:
In no way is this intended as a financial/investment/trading advice. You are responsible for your own investment decisions and trades.
Please exercise your own judgement for your own trades base on your own risk-aversion level and goals as an investor or a trader. The use of OTHER indicators and analysis in conjunction (tailored to your own style of investing/trading) will help improve confidence of your analysis, for you to determine your own trade decisions.
~ * ~ * ~ * ~ * ~ * ~ * ~ * ~ * ~ * ~ * ~ * ~ * ~ * ~ * ~ * ~ * ~ * ~ * ~ * ~ * ~
Please check out my other indicators sets and series, e.g.
LIVIDITIUM (dynamic levels),
AEONDRIFT (multi-levels standard deviation bands),
FUSIONGAPS (MA based oscillators),
MAJESTIC (Momentum/Acceleration/Jerk Oscillators),
PRISM (pSAR based oscillator, with RSI/StochRSI as well as Momentum/Acceleration/Jerk indicators),
PDF (parabolic SAR /w HighLow Trends Indicator/Bar-color-marking + Dynamic Fib Retrace and Extension Level)
and more to come.
Constructive feedback and suggestions are welcome.
~ JuniAiko
(=^~^=)v~
PDF {pSAR /w HiLo Trends + Fib Retrace/Extension Levels}parabolic SAR /w HighLow Trends Indicator/Bar-color-marking + Dynamic Fib Retrace and Extension Level
~ * ~ * ~ * ~ * ~ * ~ * ~ * ~ * ~ * ~ * ~ * ~ * ~ * ~ * ~ * ~ * ~ * ~ * ~ * ~ * ~
Note:
In no way is this intended as a financial/investment/trading advice. You are responsible for your own investment decisions and trades.
Please exercise your own judgement for your own trades base on your own risk-aversion level and goals as an investor or a trader. The use of OTHER indicators and analysis in conjunction (tailored to your own style of investing/trading) will help improve confidence of your analysis, for you to determine your own trade decisions.
~ * ~ * ~ * ~ * ~ * ~ * ~ * ~ * ~ * ~ * ~ * ~ * ~ * ~ * ~ * ~ * ~ * ~ * ~ * ~ * ~
Please check out my other indicators sets and series, e.g.
LIVIDITIUM (dynamic levels),
AEONDRIFT (standard deviation bands),
FUSIONGAPS (MA based oscillators),
MAJESTIC (Momentum/Acceleration/Jerk Oscillators),
PRISM (pSAR based oscillator, with RSI/StochRSI as well as Momentum/Acceleration/Jerk indicators),
and more to come.
Constructive feedback and suggestions are welcome.
~ JuniAiko
(=^~^=)v~

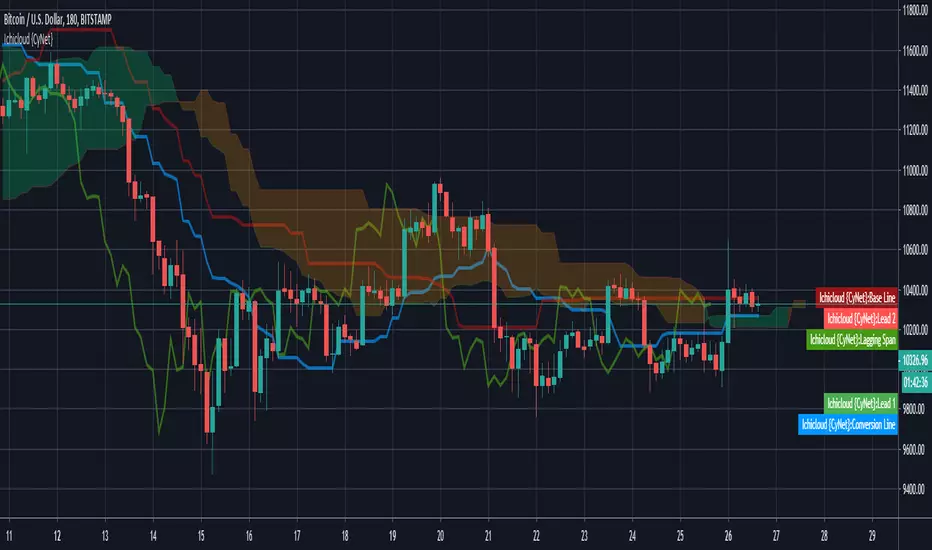
Ichimoku Cloud {Cybernetwork}Ichimoku Cloud with parameters optimized for Crypto.
~ * ~ * ~ * ~ * ~ * ~ * ~ * ~ * ~ * ~ * ~ * ~ * ~ * ~ * ~ * ~ * ~ * ~ * ~ * ~ * ~
Taken from: school.stockcharts.com (Aug 2019)
Bullish Signals:
Price moves above cloud (trend)
Cloud turns from red to green (ebb-flow within trend)
Price Moves above the Base Line (momentum)
Conversion Line moves above Base Line (momentum)
Bearish Signals:
Price moves below cloud (trend)
Cloud turns from green to red (ebb-flow within trend)
Price Moves below Base Line (momentum)
Conversion Line moves below Base Line (momentum)
~ * ~ * ~ * ~ * ~ * ~ * ~ * ~ * ~ * ~ * ~ * ~ * ~ * ~ * ~ * ~ * ~ * ~ * ~ * ~ * ~
Please check out my other indicators sets and series, e.g.
LIVIDITIUM (dynamic levels),
AEONDRIFT (standard deviation bands),
FUSIONGAPS (MA based oscillators),
MAJESTIC (Momentum/Acceleration/Jerk Oscillators),
PRISM (PSAR based oscillator, with RSI/StochRSI as well as Momentum/Acceleration/Jerk indicators),
and more to come.
Constructive feedback and suggestions are welcome.
~ JuniAiko
(=^~^=)v~

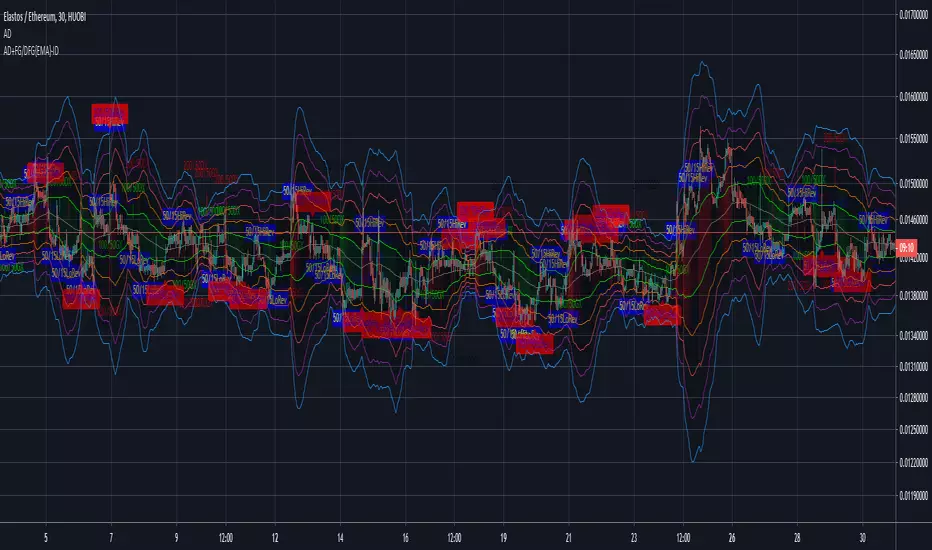
AEONDRIFT with FG & DFG {EMA} indicatorsAEONDRIFT with {EMA} implementation of FUSIONGAPS (FG) and DIFFERENTIAL FUSIONGAPS (DFG) derived indicators.
~JuniAiko
(=^~^=)v~
Check out the other analytical tools that I had published.
AEONDRIFT: