Dynamic Volume Clusters with Retest Signals (Zeiierman)█ Overview
The Dynamic Volume Clusters with Retest Signals indicator is designed to detect key Volume Clusters and provide Retest Signals. This tool is specifically engineered for traders looking to capitalize on volume-based trends, reversals, and key price retest points.
The indicator seamlessly combines volume analysis, dynamic cluster calculations, and retest signal logic to present a comprehensive trading framework. It adapts to market conditions, identifying clusters of volume activity and signaling when the price retests critical zones.
█ How It Works
⚪ Volume Cluster Detection
The indicator dynamically calculates volume clusters by analyzing the highest and lowest price points within a specified lookback period.
Cluster Logic:
Bright Lines (Strong Red/Green):
These indicate that the price has frequently revisited these levels, creating a dense cluster.
Such areas serve as support or resistance, where significant historical trading has occurred, often acting as barriers to price movement.
Traders should consider these levels as potential reversal zones or consolidation points.
Faded or Darker Lines:
These lines indicate areas where the price has less historical activity, suggesting weaker clustering.
These zones have less market memory and are more likely to break, supporting trend continuation and rapid price movement.
⚪ Candle Color Logic (Market Memory)
Blue Candles (High Cluster Density):
Candles turn blue when the price has revisited a particular area many times.
This signals a highly clustered zone, likely to act as a barrier, creating consolidation or range phases.
These areas indicate strong market memory, potentially rejecting price attempts to break through.
Green or Red Candles (Low Cluster Density):
Once the price breaks out of these dense clusters, the candles turn green (bullish) or red (bearish).
This suggests the price has moved into a less clustered territory, where the path forward is clearer and trends are likely to extend without immediate resistance.
⚪ Retest Signal Logic
The indicator identifies critical retest points where the price crosses a cluster boundary and then reverses. These points are essential for traders looking to catch continuation or reversal setups.
⚪ Dynamic Price Clustering
The indicator dynamically adapts the clustering logic based on price movement and volume shifts.
Uses a dynamic moving average (VPMA) to maintain adaptive cluster levels.
Integrates a Kalman Filter for smoothing, reducing noise, and improving trend clarity.
Automatically updates as new data is received, keeping the clusters relevant in real-time.
█ How to Use
⚪ Trend Following & Reversal Detection
Use Retest signals to identify potential trend continuation or reversal points.
⚪ Trading Volume Clusters and Market Memory
Identify Key Zones:
Focus on bright, saturated cluster lines (strong red or green) as they indicate high market memory, where price has spent significant time in the past.
These zones are likely to exhibit a more choppy market. Apply range or mean reversion strategies.
Spot Potential Breakouts:
Faded or darker cluster lines indicate areas of low market memory, where the price has moved quickly and spent less time.
Use these areas to identify possible trend setups, as they represent lower resistance to price movement.
⚪ Interpreting Candle Colors for Market Phases
Blue Candles (High Cluster Density):
When candles turn blue, it signals that the price has revisited this area multiple times, creating a dense cluster.
These zones often trap price movement, leading to consolidations or range phases.
Use these areas as caution zones, where price can slow down or reverse.
Green or Red Candles (Low Cluster Density):
Once the price breaks out of these clustered zones, the candles turn green (bullish) or red (bearish), indicating lower market memory.
This signals a trend initiation with less immediate resistance, ideal for momentum and breakout trades.
Use these signals to identify emerging trends and ride the momentum.
█ Settings
Range Lookback Period: Sets the number of bars for calculating the range.
Zone Width (% of Range): Determines how wide the volume clusters are relative to the calculated range.
Volume Line Colors: Customize the appearance of bullish and bearish lines.
Retest Signals: Toggle the appearance of Triangle Up/Down retest markers.
Minimum Bars for Retest: Define the minimum number of bars required before a retest is valid.
Maximum Bars for Retest: Set the maximum number of bars within which a retest can occur.
Price Cluster Period: Adjusts the sensitivity of the dynamic clustering logic.
Cluster Confirmation: Controls how tightly the clusters respond to price action.
Price Cluster Start/Peak: Sets the minimum and maximum touches required to fully form a cluster.
-----------------
Disclaimer
The content provided in my scripts, indicators, ideas, algorithms, and systems is for educational and informational purposes only. It does not constitute financial advice, investment recommendations, or a solicitation to buy or sell any financial instruments. I will not accept liability for any loss or damage, including without limitation any loss of profit, which may arise directly or indirectly from the use of or reliance on such information.
All investments involve risk, and the past performance of a security, industry, sector, market, financial product, trading strategy, backtest, or individual's trading does not guarantee future results or returns. Investors are fully responsible for any investment decisions they make. Such decisions should be based solely on an evaluation of their financial circumstances, investment objectives, risk tolerance, and liquidity needs.
Indicadores e estratégias

Market Breadth Toolkit [LuxAlgo]The Market Breadth Toolkit allows traders to use up to 6 different market breadth measures on two different exchanges, for a total of 12 different views of the market.
This toolkit includes divergence detection and allows setting custom fixed levels for traders who want to experiment with them.
🔶 USAGE
The main idea behind Breadth is to measure the number of advancing and declining issues and/or volume by exchange to have an idea of the underlying strength of the whole exchange.
On the other hand, thrusts represent big impulses in the breadth, as it is described by technicians to be the start of a new bullish trend.
By default, the Toolkit is set to "Breadth Thrust Zweig", with divergences enabled.
We will now explain all the different breadth measures available in the toolkit.
🔹 Deemer Breakaway Momentum
The "Breakaway Momentum" is a concept related to market breadth introduced by legendary technical analyst Walter Deemer.
As stated on his website:
We coined the term "breakaway momentum" in the 1970's to describe this REALLY powerful upward momentum
and:
We now know that the stock market generates breakaway momentum when the 10-day total advances on the NYSE are greater than 1.97 times the 10-day total NYSE declines OR the 20-day total advances on the NYSE are greater than 1.72 times the 20-day total NYSE declines.
As we can see in the chart above, which shows both methods, momentum is identified when the ratio of advancing issues to declining issues is greater than 1.97 for the 10-day average or 1.72 for the 20-day average.
🔹 Zweig Breadth Tools
Legendary trader and author Marting Zweig, best known as the author of "Winning on Wall Street" and the creator of the Put/Call Ratio.
In this toolkit, we feature two of his other tools:
Breadth Thrust: Number of Advancing / (Number of Advancing + Number of Declining Stocks)
Market Thrust: (Number of Advancing × Advancing Volume) — (Number of Declining Stocks × Declining Volume)
As we can see on the above chart, the Breadth Thrust printed a new signal on April 24, 2025, which is a bullish signal on the daily chart that can last several months, considering the previous signals.
On the right side, we have the Market Thrust as the delta between advancing minus declining volume weighted.
🔹 Whaley Measures
Wayne Whaley received the 2010 Charles Dow Award from the CMT Association, as stated on their website: "In 1994, the CMT Association established the Charles H. Dow Award to recognize outstanding research in technical analysis."
We include two of the tools from this paper:
Advance Decline Thrust: Number of Advancing / (Number of Advancing + Number of Declining Stocks)
Up/Down Volume Thrust Advancing Volume / (Advancing Volume + Declining Volume)
The chart above shows Thrust signals at extreme readings as described in the paper.
🔹 Divergences
The divergence detector is enabled by default, traders can disable it and fine-tune the detection length in the settings panel.
🔹 Fixed Levels
Traders can adjust the Thrust detection thresholds in the settings panel.
In the image above, we can see the Deemer Breakaway Momentum 10 with the original threshold (below) and with the 3.0 threshold (above).
🔶 SETTINGS
Breadth: Choose between 6 different breadth thrust measurement methods.
Data: Choose between NYSE or NASDAQ exchanges.
Divergences: Enable/Disable divergences and select the length detection.
🔹 Levels
Use Fixed Levels: Enable/Disable Fixed Levels.
Top Level: Select the top-level threshold.
Bottom Level: Select bottom level threshold.
Levels Style: Choose between dashed, dotted, or solid style.
🔹 Style
Breadth: Select breadth colors
Divergence: Select divergence colors

Liquidity + OB + FVG + Market Structure [v2]Coach Tae's Confirmations by detecting liquidity sweeps along with FVG+ OB + Bos/Choch. See the best entry repeatedly as much as possible.

AlgoRanger Dynamic Trend Flow + Smart Buy and Sell📊 AlgoRanger Dynamic Trend Flow + Smart Buy/Sell
An Intelligent Trend Indicator with Automated Buy & Sell Signals
🔍 What This Indicator Does:
This indicator dynamically visualizes market trend direction using color-coded zones (green for bullish, red for bearish), along with automated Buy/Sell labels to guide your entry and exit points.
🟢 Green Zones = Bullish Trend
🔴 Red Zones = Bearish Trend
✅ Buy/Sell Labels = Smart signals based on momentum and trend strength
Perfect for trend-following traders looking for a clean, simple visual to assess trend direction and make confident trading decisions.
⭐ Best Used with Line Chart (Not Candlesticks)
This indicator is designed to work best with Line Charts, which emphasize price flow and trend direction without the noise of candlestick wicks.
Using it with Line Charts provides a clearer visualization of Trend Flow and smoother signal recognition.
It reduces market noise, especially on lower timeframes, improving accuracy in identifying trend changes.
🧠 How to Use:
1. Watch for Zone Colors
Green Zone = Look for Buy opportunities
Red Zone = Look for Sell opportunities
Frequent color shifts = Ranging market — use caution
2. Follow Buy/Sell Signals
Buy Signal: When the zone turns green and a Buy label appears
Sell Signal: When the zone turns red and a Sell label appears
Tip: Signals work best in trending conditions where zones hold direction consistently
⚙️ Customization & Flexibility
Adjustable smoothing and sensitivity settings (for short- or long-term trends)
Turn Buy/Sell labels on/off

Smart S/R ZonesThis is not your average S/R script.
It combines proximity, bounce frequency, and volume clustering to automatically identify the most reliable support and resistance zones on your chart — no guesswork needed.
How It Works:
• Scans for recent highs/lows, SMA50 & SMA200, and pivot swing points
• Ranks each potential level using a weighted scoring system:
• Proximity to current price (50%)
• Bounce Count (30%) — how many times price respected that level
• Volume Score (20%) — how much volume traded around that level
• The top support and resistance levels are plotted with:
• Clear dashed lines
• Color-filled zones
• Simple percentage distance labels
Why This Script Stands Out:
• No settings to tweak — it just works
• Helps you react faster with high-confidence levels
• Adapts to any market: crypto, forex, stocks, indexes
• Ideal for both intraday and swing trading setups
Built-in Intelligence. Clean Visuals. Zero Noise.

CandelaCharts - Buyside & Sellside 📝 Overview
The Buyside & Sellside Liquidity Indicator is designed to identify and emphasize one of the foundational concepts within the ICT (Inner Circle Trader) trading methodology: liquidity levels.
This tool focuses on pinpointing key areas in the market where buy-side and sell-side liquidity is concentrated, providing traders with insights into potential price targets, reversal zones, and institutional order flow behavior.
By highlighting these liquidity zones, the indicator serves as a strategic aid in understanding market dynamics and enhancing decision-making in alignment with ICT principles.
📦 Features
Buyside & Sellside Liquidity
Invalidated Liquidity
Threshold
Styling
⚙️ Settings
Liquidity: Controls visibility of Bullish/Bearish Liquidity levels.
Invalidated: Displays the invalidated liquidity levels.
Levels: Controls the number of Liquidity levels that will be displayed.
Line Style: Customize the line style and width.
Threshold: Filter by swing points the Liquidity levels.
Labels: Control the Labels visibility.
⚡️ Showcase
Buyside & Sellside
Invalidated
🚨 Alerts
This script offers alert options for all signal types.
Bearish Signal
A bearish signal is generated when the price reaches a Buyside Liquidity level.
Bullish Signal
A bullish signal is generated when the price reaches a Sellside Liquidity level.
⚠️ Disclaimer
Trading involves significant risk, and many participants may incur losses. The content on this site is not intended as financial advice and should not be interpreted as such. Decisions to buy, sell, hold, or trade securities, commodities, or other financial instruments carry inherent risks and are best made with guidance from qualified financial professionals. Past performance is not indicative of future results.

Futures Scalping Signal by AK_Trades – RISK PROTECTED MODEFutures Scalping Signal by AK_Trades – RISK PROTECTED MODE
This precision-built scalping indicator is designed for futures traders who demand clarity, speed, and protection.
✅ Smart Signal Logic:
Based on UT Bot ATR trailing stop logic
Requires minimum price movement for confirmation
Prevents repeated signals in the same direction using trend memory
✅ Visuals That Guide You, Not Distract:
Clear Buy/Sell signals labeled on the chart
Dynamic support or resistance line always visible
Price-tagged signal entries (Buy @, Sell @)
✅ Candlestick Awareness:
Highlights key patterns: Engulfing, Doji, Hammer, Shooting Star
Patterns are visual only — no interference with signal flow
✅ Trend Label:
Clean top-right corner label updates periodically to guide sentiment
⚠️ Disclaimer:
This tool is for educational purposes only. No financial advice is provided. Use at your own risk.
Built by @AK_Trades to help scalpers trade smarter, not harder.

TASC 2025.06 Cybernetic Oscillator█ OVERVIEW
This script implements the Cybernetic Oscillator introduced by John F. Ehlers in his article "The Cybernetic Oscillator For More Flexibility, Making A Better Oscillator" from the June 2025 edition of the TASC Traders' Tips . It cascades two-pole highpass and lowpass filters, then scales the result by its root mean square (RMS) to create a flexible normalized oscillator that responds to a customizable frequency range for different trading styles.
█ CONCEPTS
Oscillators are indicators widely used by technical traders. These indicators swing above and below a center value, emphasizing cyclic movements within a frequency range. In his article, Ehlers explains that all oscillators share a common characteristic: their calculations involve computing differences . The reliance on differences is what causes these indicators to oscillate about a central point.
The difference between two data points in a series acts as a highpass filter — it allows high frequencies (short wavelengths) to pass through while significantly attenuating low frequencies (long wavelengths). Ehlers demonstrates that a simple difference calculation attenuates lower-frequency cycles at a rate of 6 dB per octave. However, the difference also significantly amplifies cycles near the shortest observable wavelength, making the result appear noisier than the original series. To mitigate the effects of noise in a differenced series, oscillators typically smooth the series with a lowpass filter, such as a moving average.
Ehlers highlights an underlying issue with smoothing differenced data to create oscillators. He postulates that market data statistically follows a pink spectrum , where the amplitudes of cyclic components in the data are approximately directly proportional to the underlying periods. Specifically, he suggests that cyclic amplitude increases by 6 dB per octave of wavelength.
Because some conventional oscillators, such as RSI, use differencing calculations that attenuate cycles by only 6 dB per octave, and market cycles increase in amplitude by 6 dB per octave, such calculations do not have a tangible net effect on larger wavelengths in the analyzed data. The influence of larger wavelengths can be especially problematic when using these oscillators for mean reversion or swing signals. For instance, an expected reversion to the mean might be erroneous because oscillator's mean might significantly deviate from its center over time.
To address the issues with conventional oscillator responses, Ehlers created a new indicator dubbed the Cybernetic Oscillator. It uses a simple combination of highpass and lowpass filters to emphasize a specific range of frequencies in the market data, then normalizes the result based on RMS. The process is as follows:
Apply a two-pole highpass filter to the data. This filter's critical period defines the longest wavelength in the oscillator's passband.
Apply a two-pole SuperSmoother (lowpass filter) to the highpass-filtered data. This filter's critical period defines the shortest wavelength in the passband.
Scale the resulting waveform by its RMS. If the filtered waveform follows a normal distribution, the scaled result represents amplitude in standard deviations.
The oscillator's two-pole filters attenuate cycles outside the desired frequency range by 12 dB per octave. This rate outweighs the apparent rate of amplitude increase for successively longer market cycles (6 dB per octave). Therefore, the Cybernetic Oscillator provides a more robust isolation of cyclic content than conventional oscillators. Best of all, traders can set the periods of the highpass and lowpass filters separately, enabling fine-tuning of the frequency range for different trading styles.
█ USAGE
The "Highpass period" input in the "Settings/Inputs" tab specifies the longest wavelength in the oscillator's passband, and the "Lowpass period" input defines the shortest wavelength. The oscillator becomes more responsive to rapid movements with a smaller lowpass period. Conversely, it becomes more sensitive to trends with a larger highpass period. Ehlers recommends setting the smallest period to a value above 8 to avoid aliasing. The highpass period must not be smaller than the lowpass period. Otherwise, it causes a runtime error.
The "RMS length" input determines the number of bars in the RMS calculation that the indicator uses to normalize the filtered result.
This indicator also features two distinct display styles, which users can toggle with the "Display style" input. With the "Trend" style enabled, the indicator plots the oscillator with one of two colors based on whether its value is above or below zero. With the "Threshold" style enabled, it plots the oscillator as a gray line and highlights overbought and oversold areas based on the user-specified threshold.
Below, we show two instances of the script with different settings on an equities chart. The first uses the "Threshold" style with default settings to pass cycles between 20 and 30 bars for mean reversion signals. The second uses a larger highpass period of 250 bars and the "Trend" style to visualize trends based on cycles spanning less than one year:

SuperTrend: Silent Shadow 🕶️ SuperTrend: Silent Shadow — Operate in trend. Vanish in noise.
Overview
SuperTrend: Silent Shadow is an enhanced trend-following system designed for traders who demand clarity in volatile markets and silence during indecision.
It combines classic Supertrend logic with a proprietary ShadowTrail engine and an adaptive Silence Protocol to filter noise and highlight only the cleanest signals.
Key Features
✅ Core Supertrend Logic
Built on Average True Range (ATR), this trend engine identifies directional bias with visual clarity. Lines adjust dynamically with price action and flip when meaningful reversals occur.
✅ ShadowTrail: Stepped Counter-Barrier
ShadowTrail doesn’t predict reversals — it reinforces structure.
When price is trending, ShadowTrail forms a stepped ceiling in downtrends and a stepped floor in uptrends. This visual containment zone helps define the edges of price behavior and offers a clear visual anchor for stop-loss placement and trade containment.
✅ Silence Protocol: Adaptive Noise Filtering
During low-volatility zones, the system enters “stealth mode”:
• Trend lines turn white to indicate reduced signal quality
• Fill disappears to reduce distraction
This helps avoid choppy entries and keeps your focus sharp when the market isn’t.
✅ Visual Support & Stop-Loss Utility
When trendlines flatten or pause, they naturally highlight price memory zones. These flat sections often align with:
• Logical stop-loss levels
• Prior support/resistance areas
• Zones of reduced volatility where price recharges or rejects
✅ Custom Styling
Full control over line colors, width, transparency, fill visibility, and silence behavior. Tailor it to your strategy and visual preferences.
How to Use
• Use Supertrend color to determine bias — flips mark momentum shifts
• ShadowTrail mirrors the primary trend as a structural ceiling/floor
• Use flat segments of both lines to identify consolidation zones or place stops
• White lines = low-quality signal → stand by
• Combine with RSI, volume, divergence, or your favorite tools for confirmation
Recommended For:
• Traders seeking clearer trend signals
• Avoiding false entries in sideways or silent markets
• Identifying key support/resistance visually
• Structuring stops around real market containment levels
• Scalping, swing, or position trading with adaptive clarity
Built by Sherlock Macgyver
Forged for precision. Designed for silence.
When the market speaks, you listen.
When it doesn’t — you wait in the shadows.

IU Three Line Strike Candlestick PatternIU Three Line Strike Candlestick Pattern
This indicator identifies the Three Line Strike candlestick pattern — a rare yet powerful 4-bar reversal setup that captures exhaustion and momentum shifts at the end of strong trends.
Pattern Logic:
The Three Line Strike is a 4-candle pattern that typically signals a sharp reversal after a sustained directional move. This script detects both bullish and bearish variations using strict criteria to ensure accuracy.
Bullish Three Line Strike:
* Previous three candles must be bearish (red)
* Each of these candles must close progressively lower (indicating a strong downtrend)
* The current candle must:
* Be bullish (green)
* Open below the prior close
* Completely engulf the previous three candles by closing above the first candle's open
* And make a higher high than the last 3 bars — confirming a strong reversal
* Once confirmed, a green shaded box is drawn around the 4-bar zone to highlight the pattern
Bearish Three Line Strike:
* Previous three candles must be bullish (green)
* Each must close progressively higher (indicating a strong uptrend)
* The current candle must:
* Be bearish (red)
* Open above the prior close
* Completely engulf the prior three candles by closing below the first candle's open
* And make a lower low than the last 3 bars — confirming downside strength
* A red shaded box is plotted around the 4-bar formation to emphasize the reversal zone
Why this is unique:
Most candlestick tools focus on 1–2 bar patterns. The Three Line Strike goes a step further by combining trend exhaustion (3 same-colored candles) with a full reversal engulfing candle. This pattern is both rare and highly expressive of sentiment shift, making it a standout signal for discretionary and algorithmic traders alike.
How users can benefit:
* High-probability setups: Filters out weak signals using multi-bar confirmation logic
* Clear visual cues: Dynamic shaded boxes and labels make spotting reversals effortless
* Cross-timeframe compatible: Works on intraday and higher timeframes across all markets
* Real-time alerts: Get notified instantly when a bullish or bearish setup forms
This indicator is a valuable addition for traders who want to capture key reversals backed by strong multi-bar price action logic. Whether you are a price action purist or a pattern-based strategist, the IU Three Line Strike gives you a reliable edge.
Disclaimer:
This script is for educational purposes only and does not constitute financial advice. Trading involves risk, and past performance is not indicative of future results. Always do your own research and consult with a licensed financial advisor before making trading decisions.

Price Action Pattern DetectorThis indicator detects price action on the chart. It will automatically add tags when an automatic pattern is formed.

Sonic Simple Long & Short BiasHi Guys
This is one simple indicator help us find the Long (Buy) Bias or Short (Sell) Bias.

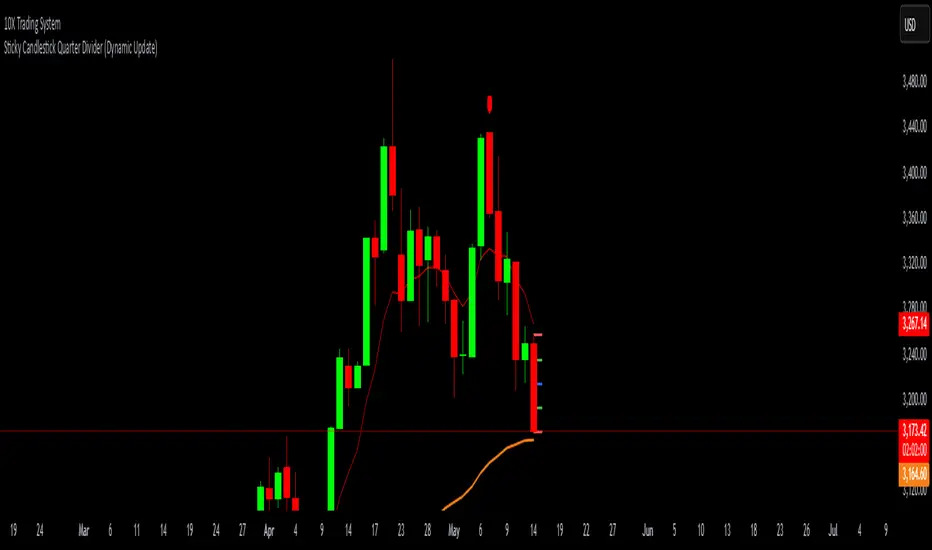
Sticky Candlestick Quarter Divider (Dynamic Update)This indicator divides the most recent candlestick into four equal parts and dynamically plots horizontal lines that move along with the latest candle.
Features:
Dynamic Sticky Lines:
The lines remain visually attached to the current candle, moving seamlessly as the chart updates, zooms, or pans.
Price Level Calculation:
Divides the candlestick into four distinct levels:
High Line (Red): Marks the highest point of the candle.
Low Line (Red): Marks the lowest point of the candle.
Midpoint Line (Blue): Marks the midpoint between high and low.
Upper Quarter Line (Green): Marks the 25% level between low and high.
Lower Quarter Line (Green): Marks the 75% level between low and high.
Real-Time Update:
The lines automatically adjust to the latest candle, maintaining accurate positioning.
Ideal for Candle Analysis:
Quickly identify key price levels and candle structure.
Suitable for analyzing trend strength and potential price reversals.
Multi VWAPsMulti VWAPs Inspired by Biran Shannon and his book:
"MAXIMUM TRADING GAINS WITH ANCHORED VWAP . The Perfect Combination of Price, Time & Volume."
(ISBN 9798986868004)
A comprehensive VWAP (Volume Weighted Average Price) indicator that combines multiple timeframes and sessions in one view. Perfect for day trading and swing trading across different markets.
Features:
• Multiple VWAP Timeframes:
- Daily VWAP
- Weekly VWAP
- Monthly VWAP
- Quarterly VWAP
- Yearly VWAP
• Session-specific VWAPs:
- London Session (3:00 AM - 11:30 AM NY time)
- New York Session (9:30 AM - 4:00 PM NY time)
• Additional Indicators:
- Midnight Price Line (Previous day's closing price)
- 5-Day Moving Average
- 50-Day Moving Average
• Customization Options:
- Toggle individual VWAPs and indicators
- Customize colors for each component
- Adjustable label positioning
- MA smoothing settings
- Option to show/hide previous day's midnight price
• Smart Features:
- Auto-adjusting calculations based on timeframe
- Clear session boundaries
- Optimized for all chart timeframes
- Clean label system
Perfect for:
• Day traders tracking multiple timeframe momentum
• Swing traders using longer-term VWAPs
• Session traders focusing on London/NY hours
• Multi-timeframe analysis
• Price action trading with VWAP support/resistance
This indicator combines essential trading tools in one clean interface, helping you make informed decisions without cluttering your chart.

Any Divergence for Many Indicators v6The community-based modification of the Divergence for Many Indicators v4 version has been upgraded to Pine Script v6, with the addition of 3 integrated alert signals. These alerts can simultaneously trigger notifications for both top and bottom divergences, fully utilizing the alert conditions of the watchlist.

Deviation over Deviation (DoD) (DAFE) Deviation over Deviation (DoD)
Let’s call it out: The vast majority of “volatility” tools on TradingView are just new wrappers on old math—ATR, bands, and basic deviation, all chasing the same tired after-the-fact moves. They’re built to describe the aftermath, not the ignition. If you’re still relying on these, you’re trading in the rearview mirror while the real edge is already gone. That’s not our game, and it shouldn’t be yours.
Deviation over Deviation (DoD) is built for one purpose:
To expose the hidden regime shifts—the moments when volatility itself becomes volatile, when the market’s “normal” deviation is no longer normal, and when the next move is about to erupt. This isn’t just another overlay. This is a quant-grade anomaly detector, engineered to show you the probability surface before the crowd even knows it’s changed.
What sets this apart:
Deviation over Deviation (DoD):
Not just “how much did price move,” but “how unusual is the current volatility compared to its own history?” This is the Z-score of Z-scores—a true rarity detector for market stress, lull, or impending breakout.
VoVix Integration:
Select VoVix as your source and you’re not just tracking price, but the volatility of volatility—the same math that powers institutional regime models. This is the edge that front-runs the move, not follows it.
Multi-Timeframe Comparative Engine:
Instantly compare current and higher timeframe DoD Z-scores. See when the micro and macro regimes align—or when they’re about to collide.
Professional, Adaptive Dashboard:
No cosmetic fluff, always showing you the real quant state: current DoD Z, HTF DoD Z, and regime warnings. Every color, every plot, every signal is a direct function of the logic—no distractions, no lag.
How this destroys the lag:
Standard deviation, ATR, and “volatility bands” are always late. They tell you what just happened. DoD and VoVix show you when the nature of volatility itself is changing—when the market is about to leave the old regime behind. This is the difference between trading the past and trading the future.
Inputs/Signals—explained for clarity:
Deviation Lookback & DoD Lookback:
Control the sensitivity and selectivity of the regime detector. Shorter = more signals, longer = only the rarest events.
Source Selection:
Choose from price, volume, volatility, or VoVix. Each source gives you a different lens on market stress. VoVix is for those who want to see the “regime quake” before the aftershocks.
HTF (Comparative Timeframe):
Set your higher timeframe for macro regime confirmation. When both DoD Z-scores align, you’re seeing a true market inflection.
VoVix Parameters:
Fine-tune the volatility-of-volatility engine for your market. Lower ATR Fast = more responsive; higher ATR Slow = more selective. Adjust for your asset, your timeframe, your edge.
Bottom line:
This isn’t just another “volatility” script. This is a regime anomaly detector, built for traders who want to anticipate, not react. Every input is there for a reason. Every plot is a direct readout of the quant logic. Use it to filter your entries, to time your exits, or to simply see the market’s hidden structure in real time.
Disclaimer:
Trading is risky. This script is for research and informational purposes only, not financial advice. Backtest, paper trade, and know your risk before going live. Past performance is not a guarantee of future results.
*Updated the Dashboard/Metrics Display for better visibility
Use with discipline. Trade your edge.
— Dskyz, for DAFE Trading Systems

Wick SweepThe Wick Sweep indicator identifies potential trend reversal zones based on price action patterns and swing points. Specifically, it looks for "Wick Sweeps," a concept where the market temporarily breaks a swing low or high (creating a "wick"), only to reverse in the opposite direction. This pattern is often indicative of a market attempting to trap traders before making a larger move. The indicator marks these zones using dashed lines, helping traders spot key areas of potential price action.
Key Features:
* Swing Low and High Detection: The indicator identifies significant swing lows and highs within a user-defined period by employing Williams fractals.
* Wick Sweep Detection: Once a swing low or high is identified, the indicator looks for price movements that break through the low or high (creating a wick) and then reverses direction.
* Fractal Plotting: Optionally, the indicator plots fractal points (triangle shapes) on the chart when a swing low or high is detected. This can assist in visually identifying the potential wick sweep areas.
* Line Plotting: When a wick sweep is detected, a dashed line is drawn at the price level of the failed low or high, visually marking the potential reversal zone.
Inputs:
* Periods: The number of bars used to identify swing highs and lows. A higher value results in fewer, more significant swing points.
* Line Color: The color of the dashed lines drawn when a wick sweep is detected. Customize this to match your chart's theme or preferences.
* Show Fractals: A toggle that, when enabled, plots triangle shapes above and below bars indicating swing highs (up triangles) and swing lows (down triangles).
Functionality:
* Swing High and Low Calculation:
- The indicator calculates the swing low and swing high based on the periods input. A swing low is identified when the current low is the lowest within a range of (2 * periods + 1), with the lowest point being at the center of the period.
- Similarly, a swing high is identified when the current high is the highest within the same range.
* Wick Sweep Detection:
- Once a swing low or high is detected, the script looks for a potential wick. This happens when the price breaks the swing low or high and then reverses in the opposite direction.
- For a valid wick sweep, the price should briefly move beyond the identified swing point but then close in the opposite direction (i.e., a bullish reversal for a swing low and a bearish reversal for a swing high).
- A line is drawn at the price level of the failed low or high when a wick sweep is confirmed.
Confirmations for Reversal:
* The confirmation for a wick sweep requires that the price not only break the swing low/high but also close in the opposite direction (i.e., close above the low for a bullish reversal or close below the high for a bearish reversal).
* The confirmation is further refined by checking that the price movement is within a reasonable distance from the original swing point, which prevents the indicator from marking distant, unimportant price levels.
Additional Notes:
* The Wick Sweep indicator does not provide standalone trading signals; it is best used in conjunction with other technical analysis tools, such as trend analysis, oscillators, or volume indicators.
* The periods input can be adjusted based on the trader’s preferred level of sensitivity. A lower period value will result in more frequent swing points and potentially more signals, while a higher value will focus on more significant market swings.
* The indicator may work well in ranging markets where price tends to oscillate between key support and resistance levels.

Interests Zones | @CRYPTOKAZANCEVInterests Zones (POI)
The indicator highlights key Interests Zones on the chart (i.e. support and resistance levels)
Developed based on the trading strategy of Pavel Kazantsev @cryptokazancev
Developer - @ZeeZeeMon
Зоны интереса (POI)
Индикатор выделяет на графике ключевые зоны интереса (то есть уровни поддержки и сопротивления)
Разработаны на основе торговой стратегии Павла Казанцева @cryptokazancev
Разработчик - @ZeeZeeMon


Moffitt Candle ClosureMoffitt Candle Closure method, wait for a closure above or below the wick of the prior opposing candle!

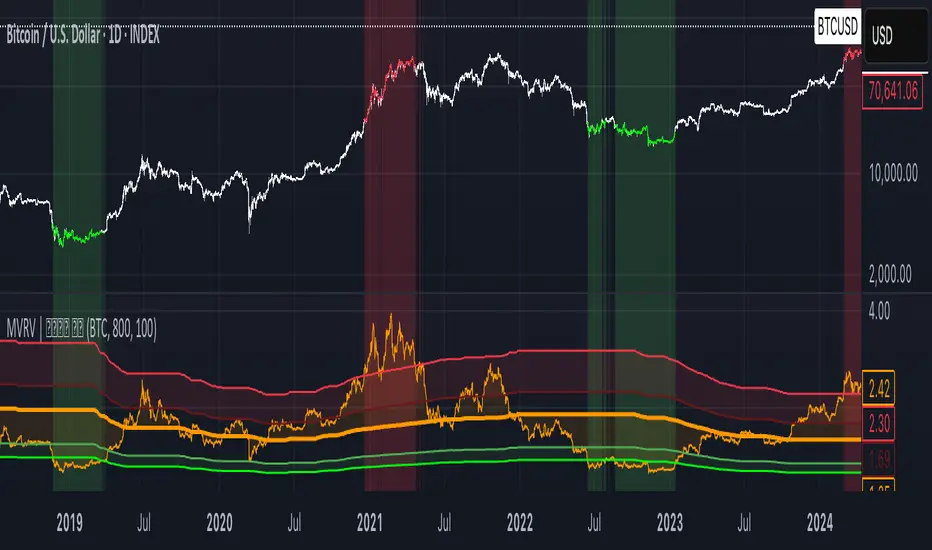
MVRV | Lyro RS📊 MVRV | Lyro RS is a powerful on-chain valuation tool designed to assess the relative market positioning of Bitcoin (BTC) or Ethereum (ETH) based on the Market Value to Realized Value (MVRV) ratio. It highlights potential undervaluation or overvaluation zones, helping traders and investors anticipate cyclical tops and bottoms.
✨ Key Features :
🔁 Dual Asset Support: Analyze either BTC or ETH with a single toggle.
📐 Dynamic MVRV Thresholds: Automatically calculates median-based bands at 50%, 64%, 125%, and 170%.
📊 Median Calculation: Period-based median MVRV for long-term trend context.
💡 Optional Smoothing: Use SMA to smooth MVRV for cleaner analysis.
🎯 Visual Threshold Alerts: Background and bar colors change based on MVRV position relative to thresholds.
⚠️ Built-in Alerts: Get notified when MVRV enters under- or overvalued territory.
📈 How It Works :
💰 MVRV Calculation: Uses data from IntoTheBlock and CoinMetrics to obtain real-time MVRV values.
🧠 Threshold Bands: Median MVRV is used as a baseline. Ratios like 50%, 64%, 125%, and 170% signal various levels of market extremes.
🎨 Visual Zones: Green zones for undervaluation and red zones for overvaluation, providing intuitive visual cues.
🛠️ Custom Highlights: Toggle individual threshold zones on/off for a cleaner view.
⚙️ Customization Options :
🔄 Switch between BTC or ETH for analysis.
📏 Adjust period length for median MVRV calculation.
🔧 Enable/disable threshold visibility (50%, 64%, 125%, 170%).
📉 Toggle smoothing to reduce noise in volatile markets.
📌 Use Cases :
🟢 Identify undervalued zones for long-term entry opportunities.
🔴 Spot potential overvaluation zones that may precede corrections.
🧭 Use in confluence with price action or macro indicators for better timing.
⚠️ Disclaimer :
This indicator is for educational purposes only. It should not be used in isolation for making trading or investment decisions. Always combine with price action, fundamentals, and proper risk management.
(DAFE) DEVMA - Crossover (Deviation Moving Average) (DAFE) DEVMA - Crossover (Deviation Moving Average)
Let’s keep pushing the edge. After the breakthrough of Deviation over Deviation (DoD)—which gave traders a true lens into volatility’s hidden regime shifts—many asked: “What’s next?” The answer is DEVMA: a crossover engine built not on price, but on the heartbeat of the market itself.
Why is this different?
DEVMA isn’t just a moving average crossover. It’s a regime detector that tracks the expansion and contraction of deviation—giving you a real-time readout of when the market’s energy is about to shift. This is the next step for anyone who wants to anticipate volatility, not just react to it.
What sets DEVMA apart:
Volatility-First Logic:Both fast and slow lines are moving averages of deviation, not price. You’re tracking the market’s “energy,” not just its direction. This is the quant edge that most scripts miss.
Regime-Colored Lines:
The fast and slow DEVMA lines change color in real time—green/aqua for expansion, maroon/orange for contraction—so you can see regime shifts at a glance.
Quant-Pro Visuals:
Subtle glow, clean cross markers, and a minimalist dashboard keep your focus on what matters: the regime, not the noise.
Static Regime Thresholds:
Reference lines at 1.5 and 0.5 (custom colors) give you instant context for “normal” vs. “extreme” volatility states.
No Price Chasing:
This isn’t about following price. It’s about anticipating the next volatility regime—before the crowd even knows what’s coming.
How this builds on DoD:
DoD showed you when volatility itself was about to change. DEVMA takes that insight and turns it into a crossover engine—so you can see, filter, and act on regime shifts in real time. If DoD was the radar, DEVMA is the navigation system.
Inputs/Signals—explained for clarity:
Deviation Lookback:
Controls the sensitivity of the regime detector. Shorter = more signals, longer = only the rarest events.
Fast/Slow DEVMA Lengths:
Fine-tune how quickly the regime lines react. Fast for scalping, slow for swing trading.
Source Selection:
Choose from price, volume, volatility, or VoVix. Each source gives you a different lens on market stress. VoVix is for those who want to see the “regime quake” before the aftershocks.
VoVix Parameters:
Fine-tune the volatility-of-volatility engine for your market. Lower ATR Fast = more responsive; higher ATR Slow = more selective.
Bottom line:
DEVMA is for those who want to see the market’s heartbeat, not just its shadow. Use it to filter your trades, time your entries, or simply understand the market’s true rhythm. Every input is there for a reason. Every plot is a direct readout of the quant logic. Use with discipline, and make it your own.
Disclaimer:
Trading is risky. This script is for research and informational purposes only, not financial advice. Backtest, paper trade, and know your risk before going live. Past performance is not a guarantee of future results.
*Updated the Dashboard/Metrics Display for better visibility
Use with discipline. Trade your edge.
— Dskyz, for DAFE Trading Systems

Fibonacci Pivot PointsMultiple Fibonacci calculation methods: including Classic, Camarilla and Woodie different Fibonacci pivot point calculation methods
Period customization: H1 (60 minutes) period is used by default, but it can be changed through settings
City customization: line color, width and label can be shaped
Price table: Displays the price values of all support and resistance levels in the upper right corner of the chart
Automatic update: Whenever a new time period starts, the indicator automatically updates all Fibonacci lines
You can adjust the parameters as needed, such as changing the color, line width or choosing a different Fibonacci calculation method.

Enigma Sniper 369The "Enigma Sniper 369" is a custom-built Pine Script indicator designed for TradingView, tailored specifically for forex traders seeking high-probability entries during high-volatility market sessions.
Unlike generic trend-following or scalping tools, this indicator uniquely combines session-based "kill zones" (London and US sessions), momentum-based candle analysis, and an optional EMA trend filter to pinpoint liquidity grabs and reversal opportunities.
Its originality lies in its focus on liquidity hunting—identifying levels where stop losses are likely clustered (around swing highs/lows and wick midpoints)—and providing visual entry zones that are dynamically removed once price breaches them, reducing clutter and focusing on actionable signals.
The name "369" reflects the structured approach of three key components (session timing, candle logic, and trend filter) working in harmony to snipe precise entries.
What It Does
"Enigma Sniper 369" identifies potential buy and sell opportunities by drawing two types of horizontal lines on the chart during user-defined London and US
session kill zones:
Solid Lines: Mark the swing low (for buys) or swing high (for sells) of a trigger candle, indicating a potential entry point where stop losses might be clustered.
Dotted Lines: Mark the 50% level of the candle’s wick (lower wick for buys, upper wick for sells), serving as a secondary confirmation zone for entries or tighter stop-loss placement.
These lines are plotted only when specific candle conditions are met within the kill zones, and they are automatically deleted once the price crosses them, signaling that the liquidity at that level has likely been grabbed. The indicator also includes an optional EMA filter to ensure trades align with the broader trend, reducing false signals in choppy markets.
How It Works
The indicator’s logic is built on a multi-layered approach:
Kill Zone Timing: Trades are only considered during user-defined London and US session hours (e.g., London from 02:00 to 12:00 UTC, as seen in the screenshots). These sessions are known for high volatility and liquidity, making them ideal for capturing institutional moves.
Candle-Based Momentum Logic:
Buy Signal: A candle must close above its midpoint (indicating bullish momentum) and have a lower low than the previous candle (suggesting a potential liquidity grab below the previous swing low). This is expressed as close > (high + low) / 2 and low < low .
Sell Signal: A candle must close below its midpoint (bearish momentum) and have a higher high than the previous candle (indicating a potential liquidity grab above the previous swing high), expressed as close < (high + low) / 2 and high > high .
These conditions ensure the indicator targets candles that break recent structure to hunt stop losses while showing directional momentum.
Optional EMA Filter: A 50-period EMA (customizable) can be enabled to filter signals based on trend direction.
Buy signals are only generated if the EMA is trending upward (ema_value > ema_value ), and sell signals require a downward EMA trend (ema_value < ema_value ). This reduces noise by aligning entries with the broader market trend.
Liquidity Levels and Deletion Logic:
For a buy signal, a solid green line is drawn at the candle’s low, and a dotted green line at the 50% level of the lower wick (from the candle body’s bottom to the low).
For a sell signal, a solid red line is drawn at the candle’s high, and a dotted red line at the 50% level of the upper wick (from the body’s top to the high).
These lines extend to the right until the price crosses them, at which point they are deleted, indicating the liquidity at that level has been taken (e.g., stop losses triggered).
Alerts: The indicator includes alert conditions for buy and sell signals, notifying traders when a new setup is identified.
Underlying Concepts
The indicator is grounded in the concept of liquidity hunting, a strategy often employed by institutional traders. Markets frequently move to levels where stop losses are clustered—typically just beyond swing highs or lows—before reversing in the opposite direction. The "Enigma Sniper 369" targets these moves by identifying candles that break structure (e.g., a lower low or higher high) during high-volatility sessions, suggesting a potential sweep of stop losses. The 50% wick level acts as a secondary confirmation, as this midpoint often represents a zone where tighter stop losses are placed by retail traders. The optional EMA filter adds a trend-following element, ensuring entries are taken in the direction of the broader market momentum, which is particularly useful on lower timeframes like the 15-minute chart shown in the screenshots.
How to Use It
Here’s a step-by-step guide based on the provided usage example on the GBP/USD 15-minute chart:
Setup the Indicator: Add "Enigma Sniper 369" to your TradingView chart. Adjust the London and US session hours to match your timezone (e.g., London from 02:00 to 12:00 UTC, US from 13:00 to 22:00 UTC). Customize the EMA period (default 50) and line styles/colors if desired.
Identify Kill Zones: The indicator highlights the London session in light green and the US session in light purple, as seen in the screenshots. Focus on these periods for signals, as they are the most volatile and likely to produce liquidity grabs.
Wait for a Signal: Look for solid and dotted lines to appear during the kill zones:
Buy Setup: A solid green line at the swing low and a dotted green line at the 50% lower wick level indicate a potential buy. This suggests the market may have grabbed liquidity below the swing low and is now poised to move higher.
Sell Setup: A solid red line at the swing high and a dotted red line at the 50% upper wick level indicate a potential sell, suggesting liquidity was taken above the swing high.
Place Your Trade:
For a buy, set a buy limit order at the dotted green line (50% wick level), as this is a more conservative entry point. Place your stop loss just below the solid green line (swing low) to cover the full swing. For example, in the screenshots, the market retraces to the dotted line at 1.32980 after a liquidity grab below the swing low, triggering a buy limit order.
For a sell, set a sell limit order at the dotted red line, with a stop loss just above the solid red line.
Monitor Price Action: Once the price crosses a line, it is deleted, indicating the liquidity at that level has been taken. In the screenshots, after the buy limit is triggered, the market moves higher, confirming the setup. The caption notes, “The market returns and tags us in long with a buy limit,” highlighting this retracement strategy.
Additional Context: Use the indicator to identify liquidity levels that may be targeted later. For example, the screenshot notes, “If a new session is about to open I will wait for the grab liquidity to go long,” showing how the indicator can be used to anticipate future moves at session opens (e.g., London open at 1.32980).
Risk Management: Always set a stop loss below the swing low (for buys) or above the swing high (for sells) to protect against adverse moves. The 50% wick level helps tighten entries, improving the risk-reward ratio.
Practical Example
On the GBP/USD 15-minute chart, during the London session (02:00 UTC), the indicator identifies a buy setup with a solid green line at 1.32901 (swing low) and a dotted green line at 1.32980 (50% wick level). The market initially dips below the swing low, grabbing liquidity, then retraces to the dotted line, triggering a buy limit order. The price subsequently rises to 1.33404, yielding a profitable trade. The user notes, “The logic is in the last candle it provides new level to go long,” emphasizing the indicator’s ability to identify fresh levels after a liquidity sweep.
Customization Tips
Adjust the EMA period to suit your timeframe (e.g., a shorter period like 20 for faster signals on lower timeframes).
Modify the session hours to align with your broker’s timezone or specific market conditions.
Use the alert feature to get notified of new setups without constantly monitoring the chart.
Why It’s Useful for Traders
The "Enigma Sniper 369" stands out by combining session timing, momentum-based candle analysis, and liquidity hunting into a single tool. It provides clear, actionable levels for entries and stop losses, removes invalid signals dynamically, and aligns trades with high-probability market conditions. Whether you’re a scalper looking for quick moves during London open or a swing trader targeting session-based reversals, this indicator offers a structured, data-driven approach to trading.
