Expanded Cloud [LuxAlgo]The Expanded Cloud tool allows traders to identify and follow trends accurately. It is based on the well-known Donchian Channels, but with enhanced features.
It features a trailing cloud that expands with the price and a trading stats dashboard.
🔶 USAGE
The tool is super easy to use. Traders can identify bigger or smaller trends just by adjusting the length from the settings panel.
Trend identification is based on Donchian Channels. An uptrend is indicated when the cloud is located below the price, while a downtrend is indicated when the cloud is above it.
Dots signal the start of a new trend, and the width of the clouds identifies the strength of the price expansion. The wider the cloud, the bigger the move.
The expanded cloud, due to its visual, can also act as a trailing stop.
🔹 Trend Identification
As we can see in the chart above, different length values identify different trends on the same BTC daily chart. Larger values identify larger trends.
🔹 Cloud Expansion
From the settings panel, traders can adjust how the clouds expand based on the Expansion % parameter. It accepts values from 0 to 100, which controls how much of the expansion is taken into account. Higher values will make the cloud expand and get closer to the price faster.
When the cloud moves opposite to the direction of the indicated trend (e.g: the cloud decreases while being below the price), it is often indicative of the end of a retracement, and we can expect the price to move with the indicated trend.
The chart above shows the effect of different Expansion % values.
🔹 Dashboard
The trading statistics dashboard informs traders of key metrics derived from the tool. The following are notable:
PNL: Theoretical profit or loss from all trends identified by the tool in the right scale units.
EXPECT.: Expected value of each trade. It is derived from win rate and risk-to-reward metrics.
AVG: 1st TOUCH: The average number of bars from the beginning of a new trend until the price touches the cloud for the first time.
🔶 SETTINGS
Length: Length for trend detection
Expansion %: Percentage of price expansion for cloud formation
Source: Source of the data
🔹 Dashboard
Show Dashboard: Enable/disable the statistics dashboard
Location: Dashboard location
Size: Dashboard size
Indicadores e estratégias

Opening candle indicator
The indicator only works in the US and Saudi markets. Its idea is to draw a line for the highest and lowest prices of the first opening candle on a five-minute frame. A break of the highest price of the candle means a buy, while a break of the lowest price of the candle means a sell. Three lines are drawn as price targets calculated at twice the length of the opening candle... The lines in the previous trading session disappear when the current session begins.
Exponential moving averages can be used to help decide whether to stay in the trade or sell.
When using the indicator, you must go to the indicator settings and change the market.
يعمل هذا المؤشر فقط في السوقين الأمريكي والسعودي. وتتمثل فكرته في رسم خط لأعلى وأدنى سعرين للشمعة الافتتاحية الأولى على إطار زمني مدته خمس دقائق. كسر أعلى سعر للشمعة يعني الشراء، بينما كسر أدنى سعر للشمعة يعني البيع. تُرسم ثلاثة خطوط كأهداف سعرية محسوبة بضعف طول الشمعة الافتتاحية... تختفي خطوط جلسة التداول السابقة عند بدء الجلسة الحالية.
يمكن استخدام المتوسطات المتحركة الأسية للمساعدة في تحديد ما إذا كان ينبغي الاستمرار في التداول أم البيع. عند الرغبة في استخدامه يجب الذهاب لإعدادت المؤشر وتحديد السوق إما الأمريكي أو السعودي.

ICT Setup 04 [TradingFinder] SFP Sweep Liquidity Fake CHoCH/BOS🔵 Introduction
In smart money and ICT based trading, liquidity is never random. Some of the most meaningful market moves begin with a liquidity sweep where price intentionally hunts a previous swing high or swing low to trigger stop loss orders and absorb volume.
This manipulation is often followed by a sharp reversal from a reaction zone, creating ideal conditions for a high probability entry. This indicator is built to detect exactly that. It identifies a valid swing point and defines a reaction zone where price is likely to react.
For short setups, the zone lies between the swing high and the maximum of the candle’s open or close. For long setups, it’s drawn from the swing low to the minimum of the open or close.
When price returns to this zone and forms a qualified confirmation candle typically a doji or a small bodied candle that closes inside the zone while sweeping the liquidity this is a potential sign of reversal.
The candle must show both the sweep and the inability to hold above or below the key level, signaling a fake breakout or failed move. By combining elements of liquidity hunt, reaction zone rejection, and candle based entry confirmation, this tool highlights sniper entry points used by smart money to trap retail traders and reverse the trend. It helps filter out noise and enhances timing, making it ideal for trading in alignment with institutional order flow.
Long Position :
Short Position :
🔵 How to Use
This indicator is designed to highlight precise moments where price sweeps liquidity and reacts within a high probability reversal zone. By identifying clean swing highs and lows and defining a smart reaction zone around them, it filters out weak fakeouts and focuses only on setups with strong institutional footprints.
The tool works best when combined with market structure analysis and is suitable for both scalping and intraday trading. Below is a breakdown of how to interpret the signals for long and short positions based on the visual setups provided.
🟣 Long Setup
In a long setup, the indicator first detects a valid swing low where liquidity has likely accumulated below. A reaction zone is then drawn between the swing low and the minimum of the open or close of the swing candle.
When price returns to this zone, it must sweep the previous low and form a precise confirmation candle, such as a doji or a small bodied candle, that closes inside the zone. This candle must also reject the lower level, showing failure to continue downward.
As shown in the chart, once the liquidity grab is complete and the confirmation candle forms, a clean long signal is issued, indicating a potential bullish reversal backed by smart money behavior.
🟣 Short Setup
In a short setup, the indicator identifies a swing high where buy-side liquidity is resting. It then constructs a reaction zone between the high and the maximum of the open or close of the swing candle. Price must return to this zone, sweep the swing high, and form a bearish confirmation candle inside the zone.
A classic example is a doji or rejection candle that traps breakout buyers and fails to hold above the previous high. In the provided chart, the price aggressively hunts the liquidity above the swing high, but the close within the reaction zone signals exhaustion, prompting a short signal with high reversal probability.
These setups represent moments where price action, liquidity behavior, and candle structure align to offer strong entries. By focusing on clean sweeps and reactive confirmations, the indicator helps traders stay on the side of smart money and avoid common breakout traps.
🔵 Settings
🟣 Logical settings
Swing period : You can set the swing detection period.
Max Swing Back Method : It is in two modes "All" and "Custom". If it is in "All" mode, it will check all swings, and if it is in "Custom" mode, it will check the swings to the extent you determine.
Max Swing Back : You can set the number of swings that will go back for checking.
Maximum Distance Between Swing and Signal :The maximum number of candles allowed between the swing point and the potential signal. The default value is 50, ensuring that only recent and relevant price reactions are considered valid.
🟣 Display settings
Displaying or not displaying swings and setting the color of labels and lines.
🟣 Alert Settings
Alert SFP : Enables alerts for Swing Failure Pattern.
Message Frequency : Determines the frequency of alerts. Options include 'All' (every function call), 'Once Per Bar' (first call within the bar), and 'Once Per Bar Close' (final script execution of the real-time bar). Default is 'Once per Bar'.
Show Alert Time by Time Zone : Configures the time zone for alert messages. Default is 'UTC'.
🔵 Conclusion
This indicator is built for traders who rely on liquidity driven setups and smart money principles. By combining swing structure analysis with precision reaction zones and strict entry confirmation, it isolates the exact moments where price sweeps liquidity and fails to continue. These are high value points where institutional activity often reveals itself, and retail traps unfold.
Unlike generic breakout tools, this script focuses on quality over quantity by requiring both a sweep of a swing high or low and a confirmed rejection candle that closes inside a predefined zone. With customizable swing depth, proximity filters, visual highlights, and alert functions, it offers a complete framework for identifying and acting on fake breakouts with confidence. Whether you trade forex, crypto, or indices, this tool enhances your ability to align with true order flow and take entries where liquidity is most likely to shift.

RSI Divergence Pro+ VolumeRSI Divergence Pro+ Volume
What It Does:
RSI Divergence Pro+ Volume is a non-repainting indicator that helps traders spot potential bullish and bearish reversal zones using a classic technical analysis concept—RSI divergence—combined with advanced volume confirmation. The script highlights moments when price and RSI disagree, filtering for signals only when there is a significant volume spike, which helps reduce false positives in quiet or illiquid markets.
How It Works:
Bullish Divergence: Triggered when price makes a lower low but RSI forms a higher low, suggesting possible exhaustion in selling pressure.
Bearish Divergence: Triggered when price makes a higher high but RSI forms a lower high, signaling potential buying exhaustion.
Volume Confirmation: Signals only appear when trading volume exceeds a dynamic threshold (based on a user-defined moving average and multiplier), making alerts more reliable.
Visual Features: Customizable labels and optional gradient highlights mark the exact bars where divergence with volume confirmation occurs, making signals easy to see.
Alert System: Built-in alerts for both bullish and bearish divergences so traders can receive instant notifications.
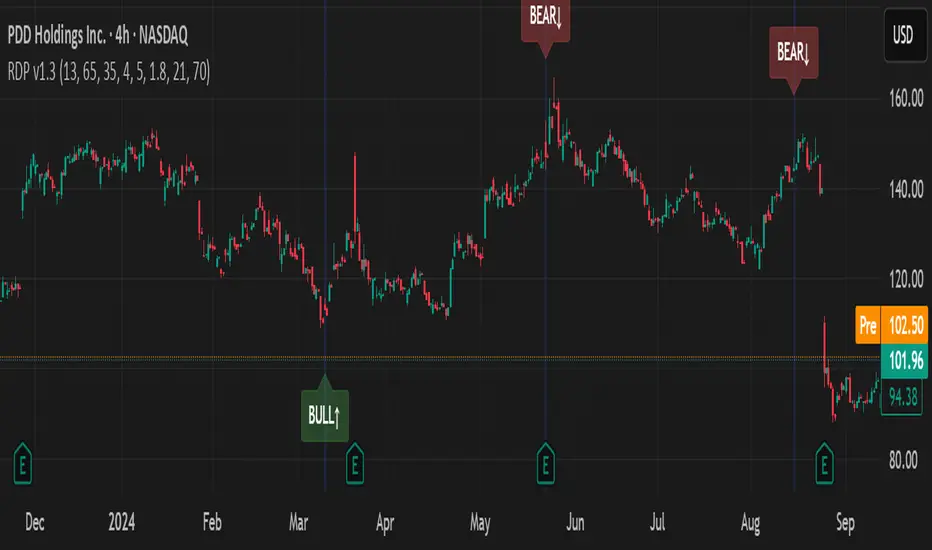
How to Use:
Apply the script to any timeframe or liquid asset (15m–4H recommended for best results).
Watch for green “BULL↑” labels below bars (bullish divergence) and red “BEAR↓” labels above bars (bearish divergence).
Blue/violet background highlights confirm volume-verified signals.
Combine with your own risk management and confirmation tools for trade entries/exits.
Adjust lookback and volume settings to match your asset and style.
Originality & Usefulness:
This indicator stands out by combining traditional RSI divergence with advanced volume filtering, giving more credible and actionable reversal alerts. All logic is non-repainting and calculated on closed bars only. Settings are fully grouped and customizable, with professional visuals for clarity.
Limitations & Disclaimers:
Not every divergence results in a major reversal—use with other analysis.
More effective in trending or volatile markets; may produce more false signals in choppy/range conditions.
Signals are generated on bar close and do not repaint.
No indicator is a substitute for proper trading discipline and risk management.
Intraday BUY/SELL & AUTO SL (5-min timeframe only) by chaitu50c)Intraday BUY/SELL & AUTO SL (5-min timeframe only) by chaitu50c
This indicator provides intraday traders with BUY/SELL reversal signals and automated SL (Stoploss) tracking, based on a 3-candle reversal block logic — designed to work exclusively on the 5-min timeframe.
Key Features:
• 3-Candle Reversal Logic — Signals are generated when a defined 3-candle reversal pattern is detected (body-close breakout).
• Current Session Only — All signals and SL lines are valid only for the current session and automatically reset at session start.
• BUY/SELL Signal Labels — Visual ▲ and ▼ labels mark valid reversal signals on the chart.
• Dynamic Auto SL Lines — Plots dashed SL lines based on the reversal block's low/high.
• SL HIT Tracking — If SL is broken, the line stops extending and a ‘SL HIT’ label is displayed at the midpoint of the SL line.
• Adjustable Visual Settings — Customize signal label size, SL line width, colors, and more.
• Clean & Lightweight — Optimized for intraday use without cluttering the chart.
How to Use:
You can trade this indicator in two ways:
1. Direct Signal Entry — Take a BUY or SELL trade when a valid ▲/▼ reversal signal forms.
2. SL HIT Re-entry — If an existing SL line is broken and ‘SL HIT’ appears, you can optionally take an opposite side trade in the direction of the SL HIT.
Example:
A BUY signal is generated and an SL line is plotted below.
If price breaks the SL (SL HIT appears), you may consider entering a SELL trade at that point — as it indicates weakness.
Important Notes:
• Works only on 5-min timeframe — Set your chart to 5-min for correct behavior.
• Designed for intraday trading — all signals and SL levels reset at session start.
• Does not carry signals between sessions.
• SL lines and HIT labels provide a clear and simple visual aid for trade management.
---

Multi-Indicator Trading BotMACD stands for Moving Average Convergence Divergence. It is a momentum indicator that shows the relationship between two moving averages of a stock’s price:
MACD Line = 12 EMA – 26 EMA
Signal Line = 9 EMA of the MACD Line
Histogram = MACD Line – Signal Line
✅ MACD Crossover Strategy: The Basic

Open Interest Footprint IQ [TradingIQ]Hello Traders!
Th e Open Interest Footprint IQ indicator is an advanced visualization tool designed for cryptocurrency markets. It provides a granular, real-time breakdown of open interest changes across different price levels, allowing traders to see how aggressive market participation is distributed within each bar.
Unlike standard footprint charts that rely solely on volume, this indicator offers unique insights by focusing on the interaction between price action and changes in open interest (OI) — a leading metric often used to infer trader intent and positioning.
How it works
The Open Interest Footprint IQ processes lower timeframe price and open interest data to build a footprint-style chart that shows how traders are positioning themselves within each candle.
Here’s a breakdown of the process:
1. Granular OI & Price Sampling
The script retrieves lower-timeframe data (1-minute, 1-second, or 1-tick, based on your setting).
For each candle, it captures:
High and low prices
Price change direction
Change in open interest (OI)
2. Classifying Trader Behavior
For each lower-timeframe segment, the indicator determines the type of positioning occurring based on price movement and OI change:
If price is moving up and open interest is increasing, it suggests that long positions are being opened. This is considered a "Longs Opening" event, labeled as UU (Up/Up).
If price is moving up but open interest is decreasing, it indicates that short positions are being closed. This is referred to as UD (Up/Down), or "Shorts Closing."
If price is moving down and open interest is increasing, it signals that short positions are being opened. This is known as DU (Down/Up), or "Shorts Opening."
If price is moving down while open interest is also decreasing, it means that long positions are being closed. This is labeled as DD (Down/Down), or "Longs Closing."
These are stored in separate arrays and displayed at specific price levels.
It is particularly useful for identifying:
Where longs or shorts are opening/closing positions
Stacked imbalances (indicative of potential absorption or exhaustion)
Value area zones and POC (Point of Control) based on OI, not volume
This footprint runs on your choice of sub-bar granularity and is ideal for high-frequency trading, scalping, and entries based on order flow dynamics.
Key Features
Footprint Visualization
At each price level within a candle:
Long/short opening and closing behavior is broken down.
Delta (net open interest change) is displayed both numerically and color-coded.
Optional gradient coloring shows intensity and type of flow (longs/shorts opened/closed).
Cumulative or per-bar reset modes allow you to track OI evolution over time.
The image above explains the information that each Footprint box shows across a candlestick!
Each footprint box shows:
OI Delta
OI Delta %
Longs Opened (LO)
Longs Closed (LC)
Shorts Opened (SO)
Shorts Closed (SC)
The image above explains the color-coding feature of the indicator.
Boxes are color coded to show which position action
dominated at the price area.
For this example:
Green boxes = Long positions being opened dominated
Purple boxes = Long positions being closed dominated
Red boxes = Short positions being opened dominated
Yellow boxes = Short positions being closed dominated
All colors are customizable.
Additionally, for traders who are only interested in whether OI increased/decreased, a "two-color" option is available in the settings.
For the two-color option, footprint boxes can be one of two colors. Showing whether OI increased or decreased at the level.
Cumulative Levels
Open Interest Footprint IQ contains a "Cumulative Levels" feature that tracks/stores open interest change at tick levels over time, rather than resetting per bar.
With the "Cumulative Levels" feature enabled, traders can see open interest changes persist across all candlesticks. This feature is useful for determining whether longs opening, longs closing, shorts opening, or shorts closing are dominating at particular price areas over time rather than on a single bar.
A useful feature to see if shorts/longs are favoring certain price throughout the day, week, month, etc.
Input Settings Explained
Granularity (Dropdown: Granularity)
Options: 1-Minute, 1-Second, 1-Tick
Determines how finely the script samples the lower timeframe data to construct the footprint.
For precision:
1-Tick = Highest accuracy, but more resource-intensive.
1-Second/1-Minute = Suitable for broader or more zoomed-out analysis.
Tick Level Distance (Tick Level Distance (0 = Auto))
Defines the vertical spacing between levels in the footprint chart.
If 0, the script uses an automatic calculation based on ATR to adapt to volatility.
Set a manual value (e.g., 5) to control the height granularity of each level in ticks.
Cumulative Levels (Toggle)
If enabled, the footprint builds cumulatively over time, rather than resetting per candle.
Use case: Visualize ongoing buildup of OI activity across a session or day.
Cumulative Levels Reset TF (Timeframe)
Sets the reset interval for the cumulative view (e.g., reset daily, hourly, etc.)
Works only when Cumulative Levels is enabled.
Delta Box Display Settings
Show Delta Percentage
Toggles the display of the percentage change in OI across the footprint level.
Helpful to gauge how aggressive positioning is relative to total OI at that level.
Show Longs/Shorts (Opened/Closed)
Show Longs Opened: Displays OI increase in up candles (price ↑, OI ↑).
Show Longs Closed: Displays OI decrease in down candles (price ↓, OI ↓).
Show Shorts Opened: OI increase in down candles (price ↓, OI ↑).
Show Shorts Closed: OI decrease in up candles (price ↑, OI ↓).
These behaviors are color-coded to give traders instant context:
Blue-green for longs opening.
Purple for longs closing.
Red for shorts opening.
Yellow for shorts closing.
Value Area & POC
Value Area % (Value Area %)
Controls how much cumulative open interest is used to define the value area.
Example: 70% means the smallest range of prices that contains 70% of total OI in that bar will be marked.
Helps identify zones of interest, support/resistance, and institutional levels.
The image above explains how to identify the VAH/VAL/POC shown by Open Interest Footprint IQ.
VAH = Upper 🞂
POC = ●
VAL = Lower 🞂
Imbalances
Imbalance Percentage
Defines the minimum delta % required at a level to be marked as an imbalance.
If the net open interest change at a level exceeds this threshold, a visual marker appears.
Stacked Imbalance Count
If the number of consecutive imbalance levels meets this count, a “Stacked Imbalance” alert will trigger.
This can signal aggressive buying or selling pressure, potential breakout zones, or institutional absorption.
Color Settings
Longs Opened / Closed, Shorts Opened / Closed
Customize the color palette for each order flow behavior.
These colors appear in the background gradient of the footprint boxes.
Up/Down Only Mode
Toggle to override all behavior-based colors with a single Up Color and Down Color.
Useful if you prefer a simple bull/bear view.
Up Color / Down Color
If "Up/Down Only" is enabled, these two colors are used to represent all net positive or negative deltas.
Special Notes
Crypto only: This script works only with crypto tickers on TradingView.
For other assets (stocks, futures), a warning message will appear instead.
OI data must be available from the exchange (many perpetual pairs support this).
If the footprint is too small or invisible, increase your tick level spacing in the settings.
Alerts
When a stacked imbalance is detected, an alert is fired ("Stacked Imbalance").
This feature is useful for automated systems, bots, or simply staying informed of potential trade setups.
And that's all for now!
If you have any questions or features you'd like to see feel free to share them in the comments below!
Thank you traders!

The Sequences of FibonacciThe Sequences of Fibonacci - Advanced Multi-Timeframe Confluence Analysis System
THEORETICAL FOUNDATION & MATHEMATICAL INNOVATION
The Sequences of Fibonacci represents a revolutionary approach to market analysis that synthesizes classical Fibonacci mathematics with modern adaptive signal processing. This indicator transcends traditional Fibonacci retracement tools by implementing a sophisticated multi-dimensional confluence detection system that reveals hidden market structure through mathematical precision.
Core Mathematical Framework
Dynamic Fibonacci Grid System:
Unlike static Fibonacci tools, this system calculates highest highs and lowest lows across true Fibonacci sequence periods (8, 13, 21, 34, 55 bars) creating a dynamic grid of mathematical support and resistance levels that adapt to market structure in real-time.
Multi-Dimensional Confluence Detection:
The engine employs advanced mathematical clustering algorithms to identify areas where multiple derived Fibonacci retracement levels (0.382, 0.500, 0.618) from different timeframe perspectives converge. These "Confluence Zones" are mathematically classified by strength:
- CRITICAL Zones: 8+ converging Fibonacci levels
- HIGH Zones: 6-7 converging levels
- MEDIUM Zones: 4-5 converging levels
- LOW Zones: 3+ converging levels
Adaptive Signal Processing Architecture:
The system implements adaptive Stochastic RSI calculations with dynamic overbought/oversold levels that adjust to recent market volatility rather than using fixed thresholds. This prevents false signals during changing market conditions.
COMPREHENSIVE FEATURE ARCHITECTURE
Quantum Field Visualization System
Dynamic Price Field Mathematics:
The Quantum Field creates adaptive price channels based on EMA center points and ATR-based amplitude calculations, influenced by the Unified Field metric. This visualization system helps traders understand:
- Expected price volatility ranges
- Potential overextension zones
- Mathematical pressure points in market structure
- Dynamic support/resistance boundaries
Field Amplitude Calculation:
Field Amplitude = ATR × (1 + |Unified Field| / 10)
The system generates three quantum levels:
- Q⁰ Level: 0.618 × Field Amplitude (Primary channel)
- Q¹ Level: 1.0 × Field Amplitude (Secondary boundary)
- Q² Level: 1.618 × Field Amplitude (Extreme extension)
Advanced Market Analysis Dashboard
Unified Field Analysis:
A composite metric combining:
- Price momentum (40% weighting)
- Volume momentum (30% weighting)
- Trend strength (30% weighting)
Market Resonance Calculation:
Measures price-volume correlation over 14 periods to identify harmony between price action and volume participation.
Signal Quality Assessment:
Synthesizes Unified Field, Market Resonance, and RSI positioning to provide real-time evaluation of setup potential.
Tiered Signal Generation Logic
Tier 1 Signals (Highest Conviction):
Require ALL conditions:
- Adaptive StochRSI setup (exiting dynamic OB/OS levels)
- Classic StochRSI divergence confirmation
- Strong reversal bar pattern (adaptive ATR-based sizing)
- Level rejection from Confluence Zone or Fibonacci level
- Supportive Unified Field context
Tier 2 Signals (Enhanced Opportunity Detection):
Generated when Tier 1 conditions aren't met but exceptional circumstances exist:
- Divergence candidate patterns (relaxed divergence requirements)
- Exceptionally strong reversal bars at critical levels
- Enhanced level rejection criteria
- Maintained context filtering
Intelligent Visualization Features
Fractal Matrix Grid:
Multi-layer visualization system displaying:
- Shadow Layer: Foundational support (width 5)
- Glow Layer: Core identification (width 3, white)
- Quantum Layer: Mathematical overlay (width 1, dotted)
Smart Labeling System:
Prevents overlap using ATR-based minimum spacing while providing:
- Fibonacci period identification
- Topological complexity classification (0, I, II, III)
- Exact price levels
- Strength indicators (○ ◐ ● ⚡)
Wick Pressure Analysis:
Dynamic visualization showing momentum direction through:
- Multi-beam projection lines
- Particle density effects
- Progressive transparency for natural flow
- Strength-based sizing adaptation
PRACTICAL TRADING IMPLEMENTATION
Signal Interpretation Framework
Entry Protocol:
1. Confluence Zone Approach: Monitor price approaching High/Critical confluence zones
2. Adaptive Setup Confirmation: Wait for StochRSI to exit adaptive OB/OS levels
3. Divergence Verification: Confirm classic or candidate divergence patterns
4. Reversal Bar Assessment: Validate strong rejection using adaptive ATR criteria
5. Context Evaluation: Ensure Unified Field provides supportive environment
Risk Management Integration:
- Stop Placement: Beyond rejected confluence zone or Fibonacci level
- Position Sizing: Based on signal tier and confluence strength
- Profit Targets: Next significant confluence zone or quantum field boundary
Adaptive Parameter System
Dynamic StochRSI Levels:
Unlike fixed 80/20 levels, the system calculates adaptive OB/OS based on recent StochRSI range:
- Adaptive OB: Recent minimum + (range × OB percentile)
- Adaptive OS: Recent minimum + (range × OS percentile)
- Lookback Period: Configurable 20-100 bars for range calculation
Intelligent ATR Adaptation:
Bar size requirements adjust to market volatility:
- High Volatility: Reduced multiplier (bars naturally larger)
- Low Volatility: Increased multiplier (ensuring significance)
- Base Multiplier: 0.6× ATR with adaptive scaling
Optimization Guidelines
Timeframe-Specific Settings:
Scalping (1-5 minutes):
- Fibonacci Rejection Sensitivity: 0.3-0.8
- Confluence Threshold: 2-3 levels
- StochRSI Lookback: 20-30 bars
Day Trading (15min-1H):
- Fibonacci Rejection Sensitivity: 0.5-1.2
- Confluence Threshold: 3-4 levels
- StochRSI Lookback: 40-60 bars
Swing Trading (4H-1D):
- Fibonacci Rejection Sensitivity: 1.0-2.0
- Confluence Threshold: 4-5 levels
- StochRSI Lookback: 60-80 bars
Asset-Specific Optimization:
Cryptocurrency:
- Higher rejection sensitivity (1.0-2.5) for volatile conditions
- Enable Tier 2 signals for increased opportunity detection
- Shorter adaptive lookbacks for rapid market changes
Forex Major Pairs:
- Moderate sensitivity (0.8-1.5) for stable trending
- Focus on Higher/Critical confluence zones
- Longer lookbacks for institutional flow detection
Stock Indices:
- Conservative sensitivity (0.5-1.0) for institutional participation
- Standard confluence thresholds
- Balanced adaptive parameters
IMPORTANT USAGE CONSIDERATIONS
Realistic Performance Expectations
This indicator provides probabilistic advantages based on mathematical confluence analysis, not guaranteed outcomes. Signal quality varies with market conditions, and proper risk management remains essential regardless of signal tier.
Understanding Adaptive Features:
- Adaptive parameters react to historical data, not future market conditions
- Dynamic levels adjust to past volatility patterns
- Signal quality reflects mathematical alignment probability, not certainty
Market Context Awareness:
- Strong trending markets may produce fewer reversal signals
- Range-bound conditions typically generate more confluence opportunities
- News events and fundamental factors can override technical analysis
Educational Value
Mathematical Concepts Introduced:
- Multi-dimensional confluence analysis
- Adaptive signal processing techniques
- Dynamic parameter optimization
- Mathematical field theory applications in trading
- Advanced Fibonacci sequence applications
Skill Development Benefits:
- Understanding market structure through mathematical lens
- Recognition of multi-timeframe confluence principles
- Appreciation for adaptive vs. static analysis methods
- Integration of classical Fibonacci with modern signal processing
UNIQUE INNOVATIONS
First-Ever Implementations
1. True Fibonacci Sequence Periods: First indicator using authentic Fibonacci numbers (8,13,21,34,55) for timeframe analysis
2. Mathematical Confluence Clustering: Advanced algorithm identifying true Fibonacci level convergence
3. Adaptive StochRSI Boundaries: Dynamic OB/OS levels replacing fixed thresholds
4. Tiered Signal Architecture: Democratic signal weighting with quality classification
5. Quantum Field Price Visualization: Mathematical field representation of price dynamics
Visualization Breakthroughs
- Multi-Layer Fibonacci Grid: Three-layer rendering with intelligent spacing
- Dynamic Confluence Zones: Strength-based color coding and sizing
- Adaptive Parameter Display: Real-time visualization of dynamic calculations
- Mathematical Field Effects: Quantum-inspired price channel visualization
- Progressive Transparency Systems: Natural visual flow without chart clutter
COMPREHENSIVE DASHBOARD SYSTEM
Multi-Size Display Options
Small Dashboard: Core metrics for mobile/limited screen space
Normal Dashboard: Balanced information density for standard desktop use
Large Dashboard: Complete analysis suite including adaptive parameter values
Real-Time Metrics Tracking
Market Analysis Section:
- Unified Field strength with visual meter
- Market Resonance percentage
- Signal Quality assessment with emoji indicators
- Market Bias classification (Bullish/Bearish/Neutral)
Confluence Intelligence:
- Total active zones count
- High/Critical zone identification
- Nearest zone distance and strength
- Price-to-zone ATR measurement
Adaptive Parameters (Large Dashboard):
- Current StochRSI OB/OS levels
- Active ATR multiplier for bar sizing
- Volatility ratio for adaptive scaling
- Real-time StochRSI positioning
TECHNICAL SPECIFICATIONS
Pine Script Version: v5 (Latest)
Calculation Method: Real-time with confirmed bar processing
Maximum Objects: 500 boxes, 500 lines, 500 labels
Dashboard Positions: 4 corner options with size selection
Visual Themes: Quantum, Holographic, Crystalline, Plasma
Alert Integration: Complete alert system for all signal types
Performance Optimizations:
- Efficient confluence zone calculation using advanced clustering
- Smart label spacing prevents overlap
- Progressive transparency for visual clarity
- Memory-optimized array management
EDUCATIONAL FRAMEWORK
Learning Progression
Beginner Level:
- Understanding Fibonacci sequence applications
- Recognition of confluence zone concepts
- Basic signal interpretation
- Dashboard metric comprehension
Intermediate Level:
- Adaptive parameter optimization
- Multi-timeframe confluence analysis
- Signal quality assessment techniques
- Risk management integration
Advanced Level:
- Mathematical field theory applications
- Custom parameter optimization strategies
- Market regime adaptation techniques
- Professional trading system integration
DEVELOPMENT ACKNOWLEDGMENT
Special acknowledgment to @AlgoTrader90 - the foundational concepts of this system came from him and we developed it through a collaborative discussions about multi-timeframe Fibonacci analysis. While the original framework came from AlgoTrader90's innovative approach, this implementation represents a complete evolution of the logic with enhanced mathematical precision, adaptive parameters, and sophisticated signal filtering to deliver meaningful, actionable trading signals.
CONCLUSION
The Sequences of Fibonacci represents a quantum leap in technical analysis, successfully merging classical Fibonacci mathematics with cutting-edge adaptive signal processing. Through sophisticated confluence detection, intelligent parameter adaptation, and comprehensive market analysis, this system provides traders with unprecedented insight into market structure and potential reversal points.
The mathematical foundation ensures lasting relevance while the adaptive features maintain effectiveness across changing market conditions. From the dynamic Fibonacci grid to the quantum field visualization, every component reflects a commitment to mathematical precision, visual elegance, and practical utility.
Whether you're a beginner seeking to understand market confluence or an advanced trader requiring sophisticated analytical tools, this system provides the mathematical framework for informed decision-making based on time-tested Fibonacci principles enhanced with modern computational techniques.
Trade with mathematical precision. Trade with the power of confluence. Trade with The Sequences of Fibonacci.
"Mathematics is the language with which God has written the universe. In markets, Fibonacci sequences reveal the hidden harmonies that govern price movement, and those who understand these mathematical relationships hold the key to anticipating market behavior."
* Galileo Galilei (adapted for modern markets)
— Dskyz, Trade with insight. Trade with anticipation.

Sell to Buy / Buy to SellSell to Buy / Buy to Sell — Momentum Shift Detector
The Sell to Buy / Buy to Sell indicator detects simple but powerful two-bar momentum shift patterns directly on your chart, offering early insights into potential reversals or strong breakout continuation.
🔎 How it works:
Sell to Buy (StB):
Previous candle (bar -1) is bearish
Current candle (bar 0) is bullish
The bullish candle closes above the high of the previous bearish candle
Confirmed only after bar close
Buy to Sell (BtS):
Previous candle (bar -1) is bullish
Current candle (bar 0) is bearish
The bearish candle closes below the low of the previous bullish candle
Confirmed only after bar close
🎯 Key Features:
✅ Pure price action logic — no indicators, no oscillators
✅ Immediate visual markers:
Green "StB" label for bullish momentum shifts
Red "BtS" label for bearish momentum shifts
✅ Full alert system to notify you in real-time when either pattern occurs
⚙ Who is this for?
Scalpers looking for short-term momentum shifts
Swing traders identifying potential reversals or breakout confirmations
Price action traders who want clean and objective setup detection
The Sell to Buy / Buy to Sell indicator is designed to give you clear and simple signals whenever the market shows decisive strength after a short-term opposite move — potentially marking the start of a new impulse.

RSI Divergence StrategyScript identifies bullish and bearish divergences, hidden and regular. Accurate on all timeframes. There are several videos on trading with a divergence strategy, but the divergences are hard to spot.
These can be adjusted but chat gpt independently checked various token vitals and compared to the chart, and found the chart accurate with current settings.
lookback = input.int(40, title="Lookback Period for Divergence") (30-60)
minSwingDistPercent = input.float(1.5, title="Minimum Swing Distance (%)") (0.5-2.0)
minPriceMovePercent = input.float(0.5, title="Minimum Price Move from Last Swing (%)") (0.5-2.0)

Stochastic Money Flow IndexThe Stochastic Money Flow Index (or Stochastic MFI ), is a momentum indicator that combines the Money Flow Index (MFI) and the Stochastic Oscillator to identify overbought and oversold conditions in a market.
It is a variation of the classic Stochastic RSI that uses the MFI rather than the Relative Strength Index (RSI) in its calculation. While the RSI focuses solely on price momentum, the MFI is a volume-weighted indicator, meaning it incorporates both price and volume data.
The Stochastic MFI is intended to provide a more precise and sensitive reading of the MFI by measuring the level of the MFI relative to its range over a specific period.
Settings
Stochastic Settings
%K Length : The number of periods used to calculate the Stochastic. (Default: 14)
%K Smoothing : The SMA length used to 'smooth' the %K line. (Default: 3)
%D Smoothing : The SMA length used to 'smooth' the %D line. (Default: 1)
Money Flow Index Settings
MFI Length : The number of periods used to calculate the Money Flow Index. (Default: 14)
MFI Source : The source used to calculate the Money Flow Index. (Default: close)
Additional Settings
Show Overbought/Oversold Gradients? : Toggle the display of overbought/oversold gradients. (Default: true)

MT Daily ZonesMT Daily Zones
A precision market structure tool from Mindfluential Trading, combining daily CPR, PDH/PDL zones, EMAs/SMAs - all optimized for intraday traders.
🔹 Core Features
🔵 CPR (Central Pivot Range)
Plots Pivot, TC, and BC from the previous day
Helps define the market's fair value zone and compression/breakout areas
Royal blue color ensures clarity on both light and dark themes
🟠 PDH / PDL Zones
Accurately plots Previous Day’s High and Low
Useful for breakout scalps, reversal traps, and trend continuation setups
🟢 Smart Trend Filters
Toggle EMAs (8, 20, 50) and SMAs (50, 100, 200)
Smooth color-coded display for dynamic trend alignment
✅ Clean Visuals. Real Structure. No Clutter.
⚠️ Disclaimer
This indicator is for educational purposes only. Do your own research before making trading decisions.
May 27
Release Notes
MT Daily Zones
A precision market structure tool from Mindfluential Trading, combining daily CPR, PDH/PDL zones, EMAs/SMAs - all optimized for intraday traders.
🔹 Core Features
🔵 CPR (Central Pivot Range)
Plots Pivot, TC, and BC from the previous day
Helps define the market's fair value zone and compression/breakout areas
Royal blue color ensures clarity on both light and dark themes
🟠 PDH / PDL Zones
Accurately plots Previous Day’s High and Low
Useful for breakout scalps, reversal traps, and trend continuation setups
🟢 Smart Trend Filters
Toggle EMAs (8, 20, 50) and SMAs (50, 100, 200)
Smooth color-coded display for dynamic trend alignment
✅ Clean Visuals. Real Structure. No Clutter.
⚠️ Disclaimer
This indicator is for educational purposes only. Do your own research before making trading decisions.

Grid Bot v6 StrategyGrid Bot v6 Strategy
Adaptive parabolic grid that turns market structure into a step-by-step trading plan
Idea of strategy and source code of base indicator provided by my subscriber @Sergio_Nov
1. Core concept
Grid Bot v6 draws a dynamic parabola from a user-defined time/price anchor and builds a 10-level grid around it (five lines above, five below).
Each level is colour-coded:
Green – preferred buy area
Red – preferred sell area
Yellow – overlap of buy-and-sell zones (balance)
Grey – neutral zone
Orders are fired when price touches or reverses from a grid line and the signal is confirmed by current market sentiment. If sentiment contradicts the signal, the order is tagged secondary and uses a reduced lot size.
2. How the logic works
Parabola – the function f_parabola computes the curve from Accel, Curve and Sensitivity. Zero values give a flat horizontal grid; non-zero values create an accelerating or decelerating trendline.
Grid spacing – controlled by Intervals (percentage of price). Lines are recalculated every bar, so the grid “breathes” with the market.
Triggers – choose which part of the candle must reach the level (Wick, Close, Midpoint, SWMA).
Confirmation – decide whether a simple touch is enough or a full reversal is required (Touch vs Reverse).
Sentiment filter – by default the slope of the parabola (up = long bias, down = short bias). You can override it to Long, Short or Neutral.
Order types – four independent sizes: Main Buy, Secondary Buy, Main Sell, Secondary Sell. Pyramiding up to 100 entries is allowed.
Visuals – the script plots actual and projected grid lines (100 bars ahead), the SWMA trigger and the parabola itself. Trade symbols: ▲ ▼ △ ▽.
3. User inputs
Strategy Settings
Main Buy Lot / Secondary Buy Lot
Main Sell Lot / Secondary Sell Lot
Grid Settings
Accel – tilt of the curve (positive for uptrend, negative for downtrend)
Curve – concavity; higher absolute value = stronger bend
Intervals – distance between grid lines (in %)
Sensitivity – how fast the parabola adapts; higher = more reactive
Buy Zones / Sell Zones – number of active lines below/above the curve
Trigger – Wick, Close, Midpoint, SWMA
Confirm – Touch or Reverse
Sentiment – Slope, Long, Short, Neutral
Show Signals / Show Selector – toggle on-chart markers and SWMA line
Chart Settings – individual colours for active grid, projection, parabola and SWMA.
Time/Price Anchor
B_Time – starting bar (e.g. a recent swing high/low)
B_Price – price at that bar
Tip: drop the anchor on a clear pivot, then tune Accel and Curve so the parabola hugs the trend.
4. Quick-start guide
Open your favourite symbol and timeframe (works best on volatile markets from 5-minute to 4-hour).
Set B_Time / B_Price to the last significant extreme.
Adjust Accel and Curve:
Uptrend – positive Accel, negative Curve for a concave support.
Range – both zero for a flat ladder.
Choose Intervals: smaller values = more frequent trades.
Limit Buy Zones and Sell Zones if you prefer a tighter grid.
Run a back-test, check P/L, max drawdown and trade count.
Fine-tune: lower Sensitivity if the curve outruns price; switch Trigger to SWMA to filter noise.
5. Pros and cons
Strengths
Adaptive levels that keep up with trend acceleration.
Clear colour coding plus forward projection for better context.
Sentiment filter reduces counter-trend exposures.
Weaknesses
Many parameters – each asset/timeframe needs its own calibration.
In narrow ranges frequent fills can accumulate fees.
pyramiding = 100 grows exposure quickly; monitor margin closely.
6. Risk disclaimer
This script is for educational and research purposes only. Historical performance does not guarantee future results. Before going live:
Forward-test bar-by-bar;
Check that your broker supports similar order handling;
Apply sound position sizing and, where appropriate, stop-losses or hedging.

Deep Z pi SP MA + 2 CC + OB + CPR + last 5 Minmy script with proper strike price, if strike price crosses R1, take put ex + hedge, if crosses s1 take call ex. bottom bc call normal and top bc put normal.

First 15-Min Candle High/Low with Breakout AlertsDescription (for Publishing on TradingView):
This Pine Script automatically plots the high and low of the first 15-minute candle of each trading day.
✅ Features:
🟢 Green horizontal line for High
🔴 Red horizontal line for Low
Automatically resets each day
Designed for Indian markets (IST), with market open at 09:15 AM
💡 These levels are commonly used by intraday traders as breakout zones, support/resistance, or reference points for scalping and price action strategies.
📊 Best Used On:
1-min, 5-min, or 15-min timeframes
Instruments like Bank Nifty, Nifty, major NSE stocks, and global markets with adjustable timing
📌 For custom time zones, adjust the session timestamps.

[Myth Busting] [ORB] Casper SMC - 16 JunJust showcase of YouTube strategy claimed to be profitable and fool proof. Not on every asset and not long-term though

Asset Statistics Analysis 📊📊 Asset Drawdown Statistics — Full Analysis & Recommendation Tool
This indicator provides an in-depth statistical analysis of an asset’s drawdown behavior over a custom period and offers dynamic trade recommendations based on price action and moving average alignment.
🔍 Main Features:
✅ Drawdown Classification: Real-time classification of the current drawdown into 4 levels:
🟢 Low
🟡 Moderate
🟠 High
🔴 Critical
(Levels are calculated dynamically based on the asset's max drawdown in the selected period.)
⏱️ Average & Max Durations: Tracks how long the asset stays in each drawdown level on average and records the longest streaks (in bars).
📈 Dynamic Price Thresholds: Visual lines on the chart show key drawdown levels derived from peak equity.
📋 Statistical Dashboard: A floating table shows:
Current drawdown and classification
Time spent in each drawdown level (percentage)
Average and max duration per level
Live recommendation based on drawdown context and MA trend
📌 Trade Recommendations:
Based on the current drawdown + position relative to 3 moving averages (SMA):
🟢 Strong Buy / Buy
🟡 Accumulate / Hold
🟠 Reduce
🔴 Sell / Strong Sell
⚙️ Inputs:
Drawdown Period: Defines the number of bars used for peak drawdown calculation
3 customizable moving averages: Short / Medium / Long
✅ How to Use:
Use the drawdown classification to assess long-term risk phases.
Check the "Recommendation" box for guidance on timing entries/exits.
Combine with your own strategy or trend-following approach.
⚠️ Disclaimer
This script is provided for educational and informational purposes only and does not constitute financial, investment, or trading advice.
Always do your own research and consult with a qualified financial advisor before making any trading decisions.
The author assumes no responsibility for any losses or damages resulting from the use of this indicator.

CVD - Cumulative Volume Delta CandlesCumulative Volume Delta with CVD level Alerts for finding Absorption - statistically the strongest CVD divergence.
Select your CVD levels in Settings > Inputs ("Upper Y Scale Alert Level" / "Lower Y Scale Alert Level") then right click on the green/red levels to create an alert for when CVD crosses.
If CVD hits a new high/low without price doing the same, there is Absorption
Reach out on X @cvolumeprofile to find out on which charts this works best
CVD by @cvolumeprofile also shows candle by candle divergences - highlighted with a green background. This is when a market goes down on more buyers or when a market goes up on more sellers - often signalling market inflection points

[IX] 15min ORB + Volume Trend DeltaIX 15-Minute ORB + Trend Volume Delta
A powerful intraday tool that combines Opening-Range Breakouts with a real-time volume delta tracker and adaptive trend logic—built for traders who want to stay on the right side of momentum and liquidity.
🔹 WHAT THIS INDICATOR DOES
• Automatically draws the Opening Range (ORB) for London (07:00–07:15 UTC) and New York (13:30–13:45 UTC) sessions.
• Once the ORB is set, it highlights the high and low levels throughout the session.
• Adds key previous levels: yesterday’s High, Low, Open and the most recent 4H High/Low.
• Includes a Trend MA with ±2× ATR(200) bands to define bullish/bearish market conditions.
• Tracks buy vs sell volume within the current trend regime and shows it live on your chart as a percentage delta.
🔹 HOW TO USE IT
Set your chart to 5-minute timeframe (or any intraday timeframe up to the selected ORB window).
When the session begins, the script automatically locks in the ORB zone.
Once the ORB is formed:
• If price breaks and holds above the ORB ➤ focus on longs.
• If price breaks and holds below the ORB ➤ focus on shorts.
Use the Trend Volume Delta as confirmation—strong buy delta supports longs, strong sell delta supports shorts.
Targets and support/resistance can be aligned with previous Daily / 4H levels.
🔹 TREND FILTER & VOLUME DELTA
• The adaptive trend MA uses CMO-based weighting, becoming more responsive during momentum shifts and more stable during chop.
• Trend regime is defined by price closing above or below the ±2× ATR bands.
• While inside a regime (bullish or bearish), the script accumulates volume:
– Bullish = volume from green candles (close > open)
– Bearish = volume from red candles (close < open)
• Displays total buy/sell volume and the percentage delta live in a compact table.
🔹 CUSTOMIZATION OPTIONS
• ORB duration (1–15 min)
• Custom session times for London and New York
• Toggle display for ORBs, previous levels (Daily / 4H), volume delta table, watermark
• Fully adjustable ORB and trend colors
• Trend/Momentum settings, table size and position
🔹 ALERTS INCLUDED
• Price breaking above or below the London or NY ORB
• Alerts only trigger after the ORB is set—perfect for breakout entries
🔹 WHY THIS MATTERS
• ORBs are used by institutional traders to define the day’s first true directional intent
• Trend filter avoids chasing noise by adjusting to volatility
• Volume Delta shows who’s in control—buyers or sellers
• Previous levels give natural reaction points for entries, stops, and targets
🔹 DISCLAIMER
This indicator is for educational use only. Not financial advice. Always do your own research and manage risk responsibly.
🔹 JOIN THE COMMUNITY
Want more free tools like this?
Join the free IXTradingHub Discord to access additional indicators, trading resources, and live discussions.
Or check out our VIP suite if you’re ready to take your trading to the next level and start building consistent profitability.
→ Visit IXTradingHub.com to get started.

NASDAQ Reaper📈 NASDAQ Reaper – The Ultimate Wall Street Killer
The NASDAQ Reaper is a highly advanced Smart Money Concepts (SMC) + Price Action based indicator, engineered for traders who demand accuracy, precision, and real-time edge in the NASDAQ (NQ) market.
This tool was crafted for serious traders looking to dominate the charts with institutional-grade logic, featuring:
✅ Smart Buy/Sell Zones
✅ Opening Range Breakout (ORB) Detection
✅ Volume Confirmation for Strong Entries
✅ Real-Time Entry & Exit Signals
✅ Trend & Momentum Alignment (Multi-Timeframe Logic)
✅ Trailing TP & SL with Visual Feedback
✅ Backtest Module for Strategy Validation
💡 Designed to filter noise and highlight only high-probability setups, NASDAQ Reaper helps you stay one step ahead of retail traders and ride the moves the smart money makes.
🔔 Works best on:
• 5M, 15M, and 30M charts
• London and New York sessions
• Scalping or intraday swing strategy
Whether you're aiming for 50+ tick scalps or sniper entries aligned with trend reversals, this is your secret weapon to level up your trading game.

CirclesCircles - Support & Resistance Levels
Overview
This indicator plots horizontal support and resistance levels based on W.D. Gann's mathematical approach of dividing 360 degrees by 2 and by 3. These divisions create natural price magnetism points that have historically acted as significant support and resistance levels across all markets and timeframes.
How It Works
360÷2 Levels (Blue): 5.63, 11.25, 33.75, 56.25, 78.75, etc.
360÷3 Levels (Red): 7.5, 15, 30, 37.5, 52.5, 60, 75, etc.
Both Levels (Yellow): 22.5, 45, 67.5, 90, 112.5, 135, 157.5, 180 - These are "doubly strong" as they appear in both calculations
Key Features
Auto-Scaling: Automatically adjusts for any price range (from $0.001 altcoins to $100K+ Bitcoin)
Manual Scaling: Choose from 0.001x to 1000x multipliers or set custom values
Full Customization: Colors, line widths, styles (solid/dashed/dotted)
Historical View: Option to show all levels regardless of current price
Clean Display: Adjustable label positioning and line extensions
Use Cases
Identify potential reversal zones before price reaches them
Set profit targets and stop losses at key mathematical levels
Confirm breakouts when price decisively moves through major levels
Works on all timeframes and all markets (stocks, crypto, forex, commodities)
Gann Theory
W.D. Gann believed that markets move in mathematical harmony based on geometric angles and time cycles. These 360-degree divisions represent natural balance points where price often finds support or resistance, making them valuable for both short-term trading and long-term analysis.
Perfect for traders who use:
Support/Resistance trading
Fibonacci levels
Pivot points
Mathematical/geometric analysis
Multi-timeframe analysis

Simple Multi-Timeframe Trends with RSI (Realtime)Simple Multi-Timeframe Trends with RSI Realtime Updates
Overview
The Simple Multi-Timeframe Trends with RSI Realtime Updates indicator is a comprehensive dashboard designed to give you an at-a-glance understanding of market trends across nine key timeframes, from one minute (M1) to one month (M).
It moves beyond simple moving average crossovers by calculating a sophisticated Trend Score for each timeframe. This score is then intelligently combined into a single, weighted Confluence Signal , which adapts to your personal trading style. With integrated RSI and divergence detection, SMTT provides a powerful, all-in-one tool to confirm your trade ideas and stay on the right side of the market.
Key Features
Automatic Trading Presets: The most powerful feature of the script. Simply select your trading style, and the indicator will automatically adjust all internal parameters for you:
Intraday: Uses shorter moving averages and higher sensitivity, focusing on lower timeframe alignment for quick moves.
Swing Trading: A balanced preset using medium-term moving averages, ideal for capturing trends that last several days or weeks.
Investment: Uses long-term moving averages and lower sensitivity, prioritizing the major trends on high timeframes.
Advanced Trend Scoring: The trend for each timeframe isn't just "up" or "down". The score is calculated based on a combination of:
Price vs. Moving Average: Is the price above or below the MA?
MA Slope: Is the trend accelerating or decelerating? A steep slope indicates a strong trend.
Price Momentum: How quickly has the price moved recently?
Volatility Adjustment: The score's quality is adjusted based on current market volatility (using ATR) to filter out choppy conditions.
Weighted Confluence Score: The script synthesizes the trend scores from all nine timeframes into a single, actionable signal. The weights are dynamically adjusted based on your selected Trading Style , ensuring the most relevant timeframes have the most impact on the final result.
Integrated RSI & Divergence: Each timeframe includes a smoothed RSI value to help you spot overbought/oversold conditions. It also flags potential bullish (price lower, RSI higher) and bearish (price higher, RSI lower) divergences, which can be early warnings of a trend reversal.
Clean & Customizable Dashboard: The entire analysis is presented in a clean, easy-to-read table on your chart. You can choose its position and optionally display the raw numerical scores for a deeper analysis.
How to Use It
1. Add to Chart: Apply the "Simple Multi-Timeframe Trends" indicator to your chart.
2. Select Your Style: This is the most important step. Go to the indicator settings and choose the Trading Style that best fits your strategy (Intraday, Swing Trading, or Investment). All calculations will instantly adapt.
3. Analyze the Dashboard:
Look at the Trend row to see the direction and strength of the trend on individual timeframes. Strong alignment (e.g., all green or all red) indicates a powerful, market-wide move.
Check the RSI row. Is the trend overextended (RSI > 60) or is there room to run? Look for the fuchsia color, which signals a divergence and warrants caution.
Focus on the Signal row. This is your summary. A "STRONG SIGNAL" with high alignment suggests a high-probability setup. A "NEUTRAL" or "Weak" signal suggests waiting for a better opportunity.
4. Confirm Your Trades: Use the SMTT dashboard as a confirmation tool. For example, if you are looking for a long entry, wait for the dashboard to show a "BULLISH" or "STRONG SIGNAL" to confirm that the broader market structure supports your trade.
Dashboard Legend
Trend Row
This row shows the trend direction and strength for each timeframe.
⬆⬆ (Dark Green): Ultra Bullish - Very strong, established uptrend.
⬆ (Green): Strong Bullish - Confident uptrend.
▲ (Light Green): Bullish - The beginning of an uptrend or a weak uptrend.
━ (Orange): Neutral - Sideways or consolidating market.
▼ (Light Red): Bearish - The beginning of a downtrend or a weak downtrend.
⬇ (Red): Strong Bearish - Confident downtrend.
⬇⬇ (Dark Red): Ultra Bearish - Very strong, established downtrend.
RSI Row
This row displays the smoothed RSI value and its condition.
Green Text: Oversold (RSI < 40). Potential for a bounce or reversal upwards.
Red Text: Overbought (RSI > 60). Potential for a pullback or reversal downwards.
Fuchsia (Pink) Text: Divergence Detected! A potential reversal is forming.
White Text: Neutral (RSI between 40 and 60).
Signal Row
This is the final, weighted confluence of all timeframes.
Label:
🚀 STRONG SIGNAL / 💥 STRONG SIGNAL: High confluence and strong momentum.
🟢 BULLISH / 🔴 BEARISH: Clear directional bias across relevant timeframes.
🟡 Weak + / 🟠 Weak -: Minor directional bias, suggests caution.
⚪ NEUTRAL: No clear directional trend; market is likely choppy or undecided.
Numerical Score: The raw weighted confluence score. The further from zero, the stronger the signal.
Alignment %: The percentage of timeframes (out of 9) that are showing a clear bullish or bearish trend. Higher percentages indicate a more unified market.

SMA Smooth Market Structure (Multi-Timeframe)SMA Market Structure (Multi-Timeframe) is a powerful tool for tracking structural price action, using simple moving averages across any higher timeframe (HTF). It blends Smart Money Concepts with clean swing logic to reveal trend shifts, breaks of structure, and supply/demand zones.
This indicator highlights key structure features:
• Break of Structure (BOS) – Automatic detection of bullish or bearish swing breaks
• Internal Shifts – Early clues that the market is building toward a reversal
• Liquidity Sweeps (LS) – Detects swing failures that may trap traders
• Zigzag Swing Lines – Cleanly connects swing highs and lows
• Dynamic Zones – Demand (green) and supply (red) blocks drawn from engulfing breakouts
How to Use:
• Set your preferred HTF (e.g. 1H on a 15m chart) to view structure in proper context and
adjust SMA to smooth out market structure for directional consistency
• Watch BOS lines and swing labels like HH, HL, LH, LL for directional clarity
• Use the MS (Market Shift) label to identify full reversals after internal shifts + BOS
• Demand/Supply zones mark areas of previous strength and will update or mitigate automatically
• Alerts notify you of every BOS, MS, HH, LL, and LS event — no need to monitor manually
Customization Features:
• Toggle visibility of market shift markers, internal shifts, and zones
• Choose how internal shifts are calculated (High/Low or Open)
• Customize line style, width, and colors for BOS and zigzag lines
• Control zone duration and how mitigated zones behave (fade or delete)
• Built-in safety for Pine Script’s history limits using smart offset caps
Best Use Tips:
• Combine with price action patterns or volume for confirmation
• MS + BOS + zone tap often marks a high-probability reversal setup
• Use it to align lower timeframe entries with higher timeframe structure
For traders who want structure clarity without clutter, this tool is built to keep your chart actionable and adaptive.

Simple Risk-to-Reward (R) Indicator (TP1–TP2)What this indicator does:
This tool helps traders clearly visualize their risk and reward on any trade by plotting their entry, stop loss, and take-profit (TP) levels directly on the chart. It’s designed to make manual trade planning more visual and systematic.
How it works:
You set your planned entry price, whether you want to plot a Long or Short setup, and your stop-loss distance (in ticks).
The indicator calculates your stop-loss level and automatically plots it on the chart.
It then draws take-profit levels at 1R and 2R (where “R” is your risk, the distance between entry and stop).
You can toggle the TP1 and TP2 lines on or off to suit your preference.
How to use it:
Open the settings and enter your intended entry price.
Select “Long Setup” for a buy trade, or turn it off for a sell/short trade.
Enter your desired stop loss in ticks.
Choose which take-profit levels to display by toggling TP1 and TP2.
The indicator will show entry, stop, and take-profit levels right on your chart so you can easily see your planned risk/reward.
What makes it unique and useful:
This indicator is designed for manual trade planning, giving you full control over your inputs and letting you instantly see your risk/reward on any instrument or timeframe. Unlike some built-in tools, it supports both long and short trades, lets you set all levels manually, and keeps your charts clean and easy to interpret.
