5MA+TrendMagic + Disparity + Volume Spikes5MA + TrendMagic + Disparity Scalping + Volume Spikes is an all-in-one trend and momentum indicator designed for fast entries, trend confirmation, and volatility detection.
Main Features
Multiple EMAs (9/21/50/100/200) for trend structure
TrendMagic for dynamic trend direction and stop levels
Ultra Fast Disparity Scalper (EMA disparity + RSI + RVI momentum)
Volume Spike Detection with smart filters (valid highs/lows, candle types, color match, session filter)
Gold Volatility Signals using ATR, Bollinger Bands, HV/RV spread
Clear BUY/SELL markers, overheat filters, and full alert support
This tool helps identify early reversals, confirm major trends, and highlight strong volume-driven turning points.
Indicadores e estratégias

BB latif Multi MAThis is a version of the Bollinger Band with the addition of the "but" averaging method. It gives good results in different timeframes and I think it's better than simple or exponential averaging. I use the values 20-2.4-40.

Punjis Dynamic Daily EMA/SMA 5,9,21,50,100 LevelsPunjis Dynamic Daily EMA/SMA 5,9,21,50,100 Levels
Overview:
This indicator displays daily timeframe moving averages as horizontal lines extending to the right of your chart, regardless of what timeframe you're currently viewing. It includes six key moving averages: EMA 5, EMA 9, EMA 21, SMA 50, SMA 100, and SMA 200.
Key Features:
Clean Chart Design: Unlike traditional moving average lines that clutter your chart with curves across all candles, this indicator uses horizontal lines that extend only from the current price level to the right edge of your screen
Multi-Timeframe Analysis: View daily moving averages on any intraday timeframe (1min, 5min, 15min, etc.) without switching charts
Fully Customizable:
Toggle each moving average on/off independently
Adjust the period length for each MA
Customize colors for each line
Master toggle to show/hide all lines at once
Reduced Visual Noise: Horizontal lines keep your price action clean and easy to read while still providing critical support/resistance levels
Professional Layout: Perfect for traders who need to monitor multiple key levels without obscuring candlestick patterns and chart analysis
Benefits of Horizontal Lines:
Cleaner Charts: Traditional MAs draw lines through every candle, creating visual clutter. Horizontal lines only show current values, keeping your chart clean
Focus on Current Levels: What matters most is where the MAs are NOW relative to price - horizontal lines highlight this instantly
Better Price Action Visibility: See candlestick patterns, volume, and support/resistance levels clearly without MA lines crossing through them
Quick Reference: Instantly identify if price is above or below key moving averages without following curved lines across the chart
Professional Appearance: Clean, minimalist design preferred by institutional traders and technical analysts
Use Cases:
Day traders monitoring higher timeframe levels on intraday charts
Swing traders tracking daily moving averages as dynamic support/resistance
Multi-timeframe analysis without chart switching
Identifying trend direction and potential reversal zones
Clean workspace for pattern recognition and price action trading


TedAlpha – Structure / FVG / OB Sessions:
Only looks for trades when price is inside your defined London or NY time blocks.
CHOCH:
Uses pivots to track swing highs/lows, then flags a bullish CHOCH when structure flips from LL/LH to HH/HL, and vice versa for bearish.
FVG:
Detects 3-candle imbalance and keeps the zone “active” for fvgLookback bars, then checks if price trades back into it.
Order Blocks:
On a CHOCH, grabs the last opposite candle (bearish before bull CHOCH = bullish OB, bullish before bear CHOCH = bearish OB) and marks its body as the OB zone.
Signal:
A valid long = bull CHOCH + in session + (price inside bullish FVG and/or bullish OB, depending on toggles).
Short is the mirror image.
RR 1:3:
SL uses the last swing low (for longs) or last swing high (for shorts), TP is auto-set at 3× that distance and plotted as lines.

RS Rating Viet Nam by Admin AlphaStockSo sanh vs VNMIDCAP
Bạn có thể thay đổi BenchMark trong Code thành VNINDEX hay bất kỳ chỉ số nào

TDI Fibonacci Volatility Bands Candle Coloring [cryptalent]"This is an advanced Traders Dynamic Index (TDI) candle coloring system, designed for traders seeking precise dynamic analysis. Unlike traditional TDI, which typically relies on a 50 midline with a single standard deviation band (±1 SD), this indicator innovatively incorporates Fibonacci golden ratio multiples (1.618, 2.618, 3.618 times standard deviation) to create multi-layered dynamic bands. It precisely divides the RSI fast line (green line) position into five distinct strength zones, instantly reflecting them on the candle colors, allowing you to grasp market sentiment in real-time without switching to a sub-chart.
Core Calculation Logic:
RSI Period (default 20), Band Length (default 50), and Fast MA Smoothing Period (default 1) are all adjustable.
The midline is the Simple Moving Average (SMA) of RSI, with upper and lower bands calculated by multiplying Fibonacci multiples with Standard Deviation (STDEV), generating three dynamic band sets: 1.618, 2.618, and 3.618.
Traders can quickly identify the following scenarios:
Extreme Overbought Zone (Strong Bullish, Red): Fast line exceeds custom threshold (default 82) and breaks above the specified band (default 2.618). This often signals overheating, potentially a profit-taking point or reversal short entry, especially at trend tops.
Extreme Oversold Zone (Strong Bearish, Green): Fast line drops below custom threshold (default 28) and breaks below the specified band (default 2.618). This is a potential strong rebound starting point, ideal for bottom-fishing or long entries.
Medium Bullish Zone (Yellow): Fast line surpasses medium threshold (default 66) and stands above the specified band (default 1.618), indicating bullish dominance in trend continuation.
Medium Bearish Zone (Orange): Fast line falls below medium threshold (default 33) and breaks below the specified band (default 1.618), signaling bearish control in segment transitions.
Neutral Zone (No Color Change): Fast line within custom upper and lower limits (default 34~65), retaining original candle colors to avoid noise interference during consolidation.
Color priority logic flows from strong to weak (Extreme > Medium > Neutral), ensuring no conflicts. All parameters are highly customizable, including thresholds, band selections (1.618/2.618/3.618/Midline/None), color schemes, and even optional semi-transparent background coloring (default off, transparency 90%) for enhanced visual layering.
Applicable Scenarios:
Intraday Trading: Capture extreme color shifts as entry/exit signals.
Swing Trading: Use medium colors to confirm trend extensions.
Long-Term Trend Following: Filter noise in neutral zones to focus on major trends.
Supports various markets like forex, stocks, and cryptocurrencies. After installation, adjust parameters in settings to match your strategy, and combine with other indicators like moving averages or support/resistance for improved accuracy.
If you're a TDI enthusiast, this will make your trading more intuitive and efficient!


MorphWave Bands [JOAT]MorphWave Bands - Adaptive Volatility Envelope System
MorphWave Bands create a dynamic price envelope that automatically adjusts its width based on current market conditions. Unlike static Bollinger Bands, this indicator blends ATR and standard deviation with an efficiency ratio to expand during trending conditions and contract during consolidation.
What This Indicator Does
Plots adaptive upper and lower bands around a customizable moving average basis
Automatically adjusts band width using a blend of ATR and standard deviation
Detects volatility squeezes when bands contract to historical lows
Highlights breakouts when price moves beyond the bands
Provides squeeze alerts for anticipating volatility expansion
Adaptive Mechanism
The bands adapt through a multi-step process:
// Blend ATR and Standard Deviation
blendedVol = useAtrBlend ? (atrVal * 0.6 + stdVal * 0.4) : stdVal
// Normalize volatility to its historical range
volNorm = (blendedVol - volLow) / (volHigh - volLow)
// Create adaptive multiplier
adaptMult = baseMult * (0.5 + volNorm * adaptSens)
This creates bands that respond to market regime changes while maintaining stability.
Squeeze Detection
A squeeze is identified when band width drops below a specified percentile of its historical range:
Background highlighting indicates active squeeze conditions
Low percentile readings suggest compressed volatility
Squeeze exits often precede directional moves
Inputs Overview
Band Length — Period for basis calculation (default: 20)
Base Multiplier — Starting band width multiplier (default: 2.0)
MA Type — Choose from SMA, EMA, WMA, VWMA, or HMA
Adaptation Lookback — Historical period for normalization (default: 50)
Adaptation Sensitivity — How much bands respond to volatility changes
Squeeze Threshold — Percentile below which squeeze is detected
Dashboard Information
Current trend direction relative to basis and bands
Band width percentage
Squeeze status (Active or None)
Efficiency ratio
Current adaptive multiplier value
How to Use It
Look for squeeze conditions as potential precursors to breakouts
Use band touches as dynamic support/resistance references
Monitor breakout signals when price closes beyond bands
Combine with momentum indicators for directional confirmation
Alerts
Upper/Lower Breakout — Price exceeds band boundaries
Squeeze Entry/Exit — Volatility compression begins or ends
Basis Crosses — Price crosses the center line
This indicator is provided for educational purposes. It does not constitute financial advice.
— Made with passion by officialjackofalltrades

Open Interest Z-Score [BackQuant]Open Interest Z-Score
A standardized pressure gauge for futures positioning that turns multi venue open interest into a Z score, so you can see how extreme current positioning is relative to its own history and where leverage is stretched, decompressing, or quietly re loading.
What this is
This indicator builds a single synthetic open interest series by aggregating futures OI across major derivatives venues, then standardises that aggregated OI into a rolling Z score. Instead of looking at raw OI or a simple change, you get a normalized signal that says "how many standard deviations away from normal is positioning right now", with optional smoothing, reference bands, and divergence detection against price.
You can render the Z score in several plotting modes:
Line for a clean, classic oscillator.
Colored line that encodes both sign and momentum of OI Z.
Oscillator histogram that makes impulses and compressions obvious.
The script also includes:
Aggregated open interest across Binance, Bybit, OKX, Bitget, Kraken, HTX, and Deribit, using multiple contract suffixes where applicable.
Choice of OI units, either coin based or converted to USD notional.
Standard deviation reference lines and adaptive extreme bands.
A flexible smoothing layer with multiple moving average types.
Automatic detection of regular and hidden divergences between price and OI Z.
Alerts for zero line and ±2 sigma crosses.
Aggregated open interest source
At the core is the same multi venue OI aggregation engine as in the OI RSI tool, adapted from NoveltyTrade's work and extended for this use case. The indicator:
Anchors on the current chart symbol and its base currency.
Loops over a set of exchanges, gated by user toggles:
Binance.
Bybit.
OKX.
Bitget.
Kraken.
HTX.
Deribit.
For each exchange, loops over several contract suffixes such as USDT.P, USD.P, USDC.P, USD.PM to cover the common perp and margin styles.
Requests OI candles for each exchange plus suffix pair into a small custom OI type that carries open, high, low and close of open interest.
Converts each OI stream into a common unit via the sw method:
In COIN mode, OI is normalized relative to the coin.
In USD mode, OI is scaled by price to approximate notional.
Exchange specific scaling factors are applied where needed to match contract multipliers.
Accumulates all valid OI candles into a single combined OI "candle" by summing open, high, low and close across venues.
The result is oiClose , a synthetic close for aggregated OI that represents cross venue positioning. If there is no valid OI data for the symbol after this process, the script throws a clear runtime error so you know the market is unsupported rather than quietly plotting nonsense.
How the Z score is computed
Once the aggregated OI close is available, the indicator computes a rolling Z score over a configurable lookback:
Define subject as the aggregated OI close.
Compute a rolling mean of this subject with EMA over Z Score Lookback Period .
Compute a rolling standard deviation over the same length.
Subtract the mean from the current OI and divide by the standard deviation.
This gives a raw Z score:
oi_z_raw = (subject − mean) ÷ stdDev .
Instead of plotting this raw value directly, the script passes it through a smoothing layer:
You pick a Smoothing Type and Smoothing Period .
Choices include SMA, HMA, EMA, WMA, DEMA, RMA, linear regression, ALMA, TEMA, and T3.
The helper ma function applies the chosen smoother to the raw Z score.
The result is oi_z , a smoothed Z score of aggregated open interest. A separate EMA with EMA Period is then applied on oi_z to create a signal line ma that can be used for crossovers and trend reads.
Plotting modes
The Plotting Type input controls how this Z score is rendered:
1) Line
In line mode:
The smoothed OI Z score is plotted as a single line using Base Line Color .
The EMA overlay is optionally plotted if Show EMA is enabled.
This is the cleanest view when you want to treat OI Z like a standard oscillator, watching for zero line crosses, swings, and divergences.
2) Colored Line
Colored line mode adds conditional color logic to the Z score:
If the Z score is above zero and rising, it is bright green, representing positive and strengthening positioning pressure.
If the Z score is above zero and falling, it shifts to a cooler cyan, representing positive but weakening pressure.
If the Z score is below zero and falling, it is bright red, representing negative and strengthening pressure (growing net de risking or shorting).
If the Z score is below zero and rising, it is dark red, representing negative but recovering pressure.
This mapping makes it easy to see not only whether OI is above or below its historical mean, but also whether that deviation is intensifying or fading.
3) Oscillator
Oscillator mode turns the Z score into a histogram:
The smoothed Z score is plotted as vertical columns around zero.
Column colors use the same conditional palette as colored line mode, based on sign and change direction.
The histogram base is zero, so bars extend up into positive Z and down into negative Z.
Oscillator mode is useful when you care about impulses in positioning, for example sharp jumps into positive Z that coincide with fast builds in leverage, or deep spikes into negative Z that show aggressive flushes.
4) None
If you only want reference lines, extreme bands, divergences, or alerts without the base oscillator, you can set plotting to None and keep the rest of the tooling active.
The EMA overlay respects plotting mode and only appears when a visible Z score line or histogram is present.
Reference lines and standard deviation levels
The Select Reference Lines input offers two styles:
Standard Deviation Levels
Plots small markers at zero.
Draws thin horizontal lines at +1, +2, −1 and −2 Z.
Acts like a classic Z score ladder, zero as mean, ±1 as normal band, ±2 as outer band.
This mode is ideal if you want a textbook statistical framing, using ±1 and ±2 sigma as standard levels for "normal" versus "extended" positioning.
Extreme Bands
Extreme bands build on the same ±1 and ±2 lines, then add:
Upper outer band between +3 and +4 Z.
Lower outer band between −3 and −4 Z.
Dynamic fill colors inside these bands:
If the Z score is positive, the upper band fill turns red with an alpha that scales with the magnitude of |Z|, capped at a chosen max strength. Stronger deviations towards +4 produce more opaque red fills.
If the Z score is negative, the lower band fill turns green with the same adaptive alpha logic, highlighting deep negative deviations.
Opposite side bands remain a faint neutral white when not in use, so they still provide structural context without shouting.
This creates a visual "danger zone" for position crowding. When the Z score enters these outer bands, open interest is many standard deviations away from its mean and you are dealing with rare but highly loaded positioning states.
Z score as a positioning pressure gauge
Because this is a Z score of aggregated open interest, it measures how unusual current positioning is relative to its own recent history, not just whether OI is rising or falling:
Z near zero means total OI is roughly in line with normal conditions for your lookback window.
Positive Z means OI is above its recent mean. The further above zero, the more "crowded" or extended positioning is.
Negative Z means OI is below its recent mean. Deep negatives often mark post flush environments where leverage has been cleared and the market is under positioned.
The smoothing options help control how much noise you want in the signal:
Short Z score lookback and short smoothing will react quickly, suited for short term traders watching intraday positioning shocks.
Longer Z score lookback with smoother MA types (EMA, RMA, T3) give a slower, more structural view of where the crowd sits over days to weeks.
Divergences between price and OI Z
The indicator includes automatic divergence detection on the Z score versus price, using pivot highs and lows:
You configure Pivot Lookback Left and Pivot Lookback Right to control swing sensitivity.
Pivots are detected on the OI Z series.
For each eligible pivot, the script compares OI Z and price at the last two pivots.
It looks for four patterns:
Regular Bullish – price makes a lower low, OI Z makes a higher low. This can indicate selling exhaustion in positioning even as price washes out. These are marked with a line and a label "ℝ" below the oscillator, in the bullish color.
Hidden Bullish – price makes a higher low, OI Z makes a lower low. This suggests continuation potential where price holds up while positioning resets. Marked with "ℍ" in the bullish color.
Regular Bearish – price makes a higher high, OI Z makes a lower high. This is a classic warning sign of trend exhaustion, where price pushes higher while OI Z fails to confirm. Marked with "ℝ" in the bearish color.
Hidden Bearish – price makes a lower high, OI Z makes a higher high. This is often seen in pullbacks within downtrends, where price retraces but positioning stretches again in the direction of the prevailing move. Marked with "ℍ" in the bearish color.
Each divergence type can be toggled globally via Show Detected Divergences . Internally, the script restricts how far back it will connect pivots, so you do not get stray signals linking very old structures to current bars.
Trading applications
Crowding and squeeze risk
Z scores are a natural way to talk about crowding:
High positive Z in aggregated OI means the market is running high leverage compared to its own norm. If price is also extended, the risk of a squeeze or sharp unwind rises.
Deep negative Z means leverage has been cleaned out. While it can be painful to sit through, this environment often sets up cleaner new trends, since there is less one sided positioning to unwind.
The extreme bands at ±3 to ±4 highlight the rare states where crowding is most intense. You can treat these events as regime markers rather than day to day noise.
Trend confirmation and fade selection
Combine Z score with price and trend:
Bull trends with positive and rising Z are supported by fresh leverage, usually more persistent.
Bull trends with flat or falling Z while price keeps grinding up can be more fragile. Divergences and extreme bands can help identify which edges you do not want to fade and which you might.
In downtrends, deep negative Z that stays pinned can mean persistent de risking. Once the Z score starts to mean revert back toward zero, it can mark the early stages of stabilization.
Event and liquidation context
Around major events, you often see:
Rapid spikes in Z as traders rush to position.
Reversal and overshoot as liquidations and forced de risking clear the book.
A move from positive extremes through zero into negative extremes as the market transitions from crowded to under exposed.
The Z score makes that path obvious, especially in oscillator mode, where you see a block of high positive bars before the crash, then a slab of deep negative bars after the flush.
Settings overview
Z Score group
Plotting Type – None, Line, Colored Line, Oscillator.
Z Score Lookback Period – window used for mean and standard deviation on aggregated OI.
Smoothing Type – SMA, HMA, EMA, WMA, DEMA, RMA, linear regression, ALMA, TEMA or T3.
Smoothing Period – length for the selected moving average on the raw Z score.
Moving Average group
Show EMA – toggle EMA overlay on Z score.
EMA Period – EMA length for the signal line.
EMA Color – color of the EMA line.
Thresholds and Reference Lines group
Select Reference Lines – None, Standard Deviation Levels, Extreme Bands.
Standard deviation lines at 0, ±1, ±2 appear in both modes.
Extreme bands add filled zones at ±3 to ±4 with adaptive opacity tied to |Z|.
Extra Plotting and UI
Base Line Color – default color for the simple line mode.
Line Width – thickness of the oscillator line.
Positive Color – positive or bullish condition color.
Negative Color – negative or bearish condition color.
Divergences group
Show Detected Divergences – master toggle for divergence plotting.
Pivot Lookback Left and Pivot Lookback Right – how many bars left and right to define a pivot, controlling divergence sensitivity.
Open Interest Source group
OI Units – COIN or USD.
Exchange toggles for Binance, Bybit, OKX, Bitget, Kraken, HTX, Deribit.
Internally, all enabled exchanges and contract suffixes are aggregated into one synthetic OI series.
Alerts included
The indicator defines alert conditions for several key events:
OI Z Score Positive – Z crosses above zero, aggregated OI moves from below mean to above mean.
OI Z Score Negative – Z crosses below zero, aggregated OI moves from above mean to below mean.
OI Z Score Enters +2σ – Z enters the +2 band and above, marking extended positive positioning.
OI Z Score Enters −2σ – Z enters the −2 band and below, marking extended negative positioning.
Tie these into your strategy to be notified when leverage moves from normal to extended states.
Notes
This indicator does not rely on price based oscillators. It is a statistical lens on cross venue open interest, which makes it a complementary tool rather than a replacement for your existing price or volume signals. Use it to:
Quantify how unusual current futures positioning is compared to recent history.
Identify crowded leverage phases that can fuel squeezes.
Spot structural divergences between price and positioning.
Frame risk and opportunity around events and regime shifts.
It is not a complete trading system. Combine it with your own entries, exits and risk rules to get the most out of what the Z score is telling you about positioning pressure under the hood of the market.

9/39 EMA Crossover + ADX + RSI Filter (No builtin ADX)
9/39 EMA Crossover + ADX + RSI Filter
This indicator combines classic trend‑following EMAs with momentum and trend‑strength filters to generate high‑quality Buy/Sell signals. It is designed for traders who want cleaner entries, reduced noise, and confirmation‑based signals.
✅ How It Works
1. EMA Trend Logic
• Buy Signal:
9 EMA crosses above 39 EMA
• Sell Signal:
9 EMA crosses below 39 EMA
This captures short‑term momentum shifts within the broader trend.
✅ 2. ADX Trend Strength Filter
To avoid weak or sideways markets, signals only trigger when:
• ADX > 20
This ensures the market has enough directional strength before taking trades.
✅ 3. RSI Momentum Filter
Momentum must align with the direction of the crossover:
• Buy: RSI > 50
• Sell: RSI < 50
This prevents counter‑trend entries and improves signal reliability.
✅ Final Signal Conditions
✅ BUY
• 9 EMA crosses above 39 EMA
• ADX > 20
• RSI > 50
✅ SELL
• 9 EMA crosses below 39 EMA
• ADX > 20
• RSI < 50
✅ Features
• Clean BUY/SELL labels on chart
• ADX calculated manually (compatible with all Pine environments)
• Alerts included for automation
• Works on all timeframes and instruments
✅ Best Use‑Cases
• Trend‑following strategies
• Swing trading
• Intraday momentum confirmation
• Filtering out sideways/noisy markets

MTF Switch Level (Single TF)Multi-timeframe Switch Level (Single TF)
This indicator marks the most recent “switch level” created by breakout / breakdown behaviour on the current timeframe.
How it works
– After a bullish breakout (close above the previous bar’s high), the script sets a bearish switch level at that previous high.
– After a bearish breakdown (close below the previous bar’s low), it sets a bullish switch level at that previous low.
– A single horizontal line extends from the latest switch level.
– The line and “S” label turn bullish when price is above the level and bearish when price is below it.
– Optional alerts fire when price crosses the active switch level.
Use-cases
– Visualise where breakout traders are likely trapped.
– Define a simple “above = bullish / below = bearish” bias line.
– Combine with higher-timeframe analysis or other tools for context.
Inputs
– Enable/disable bullish and bearish switch conditions.
– Line length, colour, style, thickness.
– Label position and offsets.
– Alert conditions for crosses.
Disclaimer
This tool is for charting and educational purposes only and is not financial advice or a signal service. Always do your own research and risk management.

ADR% / ATR / Dynamic LoD–HoD TableThis indicator displays a clean data table showing ADR%, ATR, and a dynamic LoD/HoD distance value based on daily trend conditions.
When price is above the 21-day or 50-day moving average, the indicator shows the distance from the Low of Day.
When price is below BOTH daily moving averages, it automatically switches to showing distance from the High of Day.
The table updates in real-time and gives a fast, volatility-based view of where price sits inside the day’s range.
Features
• ADR% (Average Daily Range Percentage)
• ATR (Average True Range)
• Automatic LoD → HoD switching based on daily trend
• Customizable colors and layout
• Clean, space-efficient table format
• Designed for intraday and volatility-focused traders

VCAI Volume & Liquidity Map LiteVCAI Volume & Liquidity Map Lite visualises recent market participation using a horizontal liquidity/volume histogram plotted beside current price.
It shows where trading activity has clustered, where the chart is thin, and how much of that activity came from buying vs selling pressure.
This Lite edition keeps the tool simple and fast:
Yellow = buy-side volume (aggressive buyers / upward pressure)
Purple = sell-side volume (aggressive sellers / downward pressure)
Thicker sections = higher traded volume at that price
POC line (purple) marks the price with the highest volume concentration
Value Area lines (yellow dashed) mark where ~70% of volume has traded
Bars extend outward to the right of price for a clean, unobstructed chart
Lookback setting controls how many candles the map is built from
Use it to quickly identify:
high-interest price zones
low-liquidity areas where price can move fast
likely reaction levels
where momentum may slow, reverse, or break through
Designed as a lightweight, open-source tool for anyone wanting a clean liquidity/volume map without complex settings.
Part of the VCAI Lite Series.

VCAI Volume LiteVCAI Volume Lite is a clean, modern take on volume analysis designed for traders who want a clearer read on participation without loading multiple indicators.
This Lite edition focuses on the essentials:
real activity vs dead sessions
expansion vs contraction
momentum shifts around breakouts and pullbacks
No hype, no filters, no hidden logic — just a straightforward volume tool rebuilt with the VCAI visual framework.
Use it to quickly spot:
stronger moves backed by genuine participation
weak pushes running on low volume
areas where momentum may stall or accelerate
Part of the VCAI Lite Series.

(5+15+60min+1D)EMA20+Y'SH/L+count简介: 这是一个专为 5分钟图表 (5min Chart) 日内交易者设计的综合辅助工具。它结合了多周期趋势均线、美股核心交易时段的时间周期计数以及关键流动性位置(前一日高低点)的智能突破监测。该脚本针对美股个股及 24/7 交易的 BTC/ETH 进行了优化,强制锁定纽约时间进行运算。
核心功能:
1. 多周期 EMA 监控系统 (MTF EMAs)
5min EMA20 (蓝色):日内短期趋势核心线(默认开启)。
60min EMA20 (绿色):小时级别趋势参考(默认开启)。
15min EMA20 (红色) & 1D EMA20 (橙色):可选开启,用于捕捉更大周期的支撑阻力。
特点:所有均线采用最细线宽,平滑显示,右上角表格实时展示当前价格。
2. 美股时段 Bar Count 计数器
时间锚定:以纽约时间 (New York Time) 09:30 开盘为起点(Bar 0)。
显示规则:仅在 K 线底部显示 偶数 序号 (0, 2, 4, 6 ...),直至第 82 根 K 线停止。
关键时间窗 (Time Pivots):
Bar 18 (约 NY 10:55) 和 Bar 40 (约 NY 12:45) 会被自动高亮。
字体变为 蓝色粗体,且对应 K 线实体变为蓝色,提示潜在的变盘或宏观流动性注入时刻。
3. 智能 PDH/PDL 射线 (Smart Rays)
精确锚点:前一日高点 (PDH) 和低点 (PDL) 的射线不是从开盘画起,而是从昨日形成高低点的具体时间点射出,精确还原价格行为。
自动阻断 (Breakout Logic):一旦当前价格触碰或突破该射线,射线将自动停止延伸,直观展示“阻力/支撑已失效”。
自动清理:每日自动清除旧线,仅保留当天的参考线,保持图表整洁。
4. 视觉优化
每日分割线:自动绘制灰色虚线分隔交易日。
图表限制:脚本仅在 5分钟图表上可见,切换周期自动隐藏,避免干扰大周期分析。
设置说明:
可在设置面板中自由开关各周期 EMA 的显示。
可开关底部的计数数字显示。
English Version (for TradingView Publishing)
Title: 5min Intraday Precision Toolkit: MTF EMAs + NY Session Count + Smart Rays
Introduction: This is a comprehensive auxiliary tool designed specifically for 5-minute chart intraday traders. It combines multi-timeframe trend EMAs, time cycle counting based on the US Session, and smart breakout monitoring for key liquidity levels (Previous Day High/Low). Optimized for US Equities and Crypto (BTC/ETH) using New York Time.
Key Features:
1. Multi-Timeframe EMA System
5min EMA20 (Blue): Core short-term intraday trend (On by default).
60min EMA20 (Green): Hourly trend reference (On by default).
15min EMA20 (Red) & 1D EMA20 (Orange): Optional overlays for higher timeframe support/resistance.
Visuals: All EMAs are rendered with fine lines for a clean look, accompanied by a top-right dashboard table.
2. NY Session Bar Count
Time Anchor: Starts counting from 09:30 New York Time (Bar 0).
Display Logic: Displays only EVEN numbers (0, 2, 4...) at the bottom of the bars, stopping at count 82.
Time Pivots:
Bar 18 (~10:55 NY) and Bar 40 (~12:45 NY) are highlighted.
Labels turn Bold Blue, and the specific candles are colored Blue to indicate potential reversal or liquidity injection times.
3. Smart PDH/PDL Rays
Precise Origin: Rays for Previous Day High (PDH) and Previous Day Low (PDL) originate from the exact timestamp they were created yesterday, not just the daily open.
Breakout Stop Logic: Rays automatically stop extending once price touches or breaks them, clearly indicating that the level has been tested.
Auto-Clean: Automatically removes old rays from previous days to keep the chart clean.
4. Visual Optimization
Daily Separators: Automatic vertical dotted lines marking new days.
Visibility: All elements are hidden on non-5m charts to prevent clutter.
Settings:
Toggle visibility for individual EMAs.
Toggle visibility for the bottom bar counter.

Continuation Model by XausThis report summarizes the historical performance of the Institutional Daily Bias Probability Model on
EURUSD daily data for the 2025 calendar year. The model combines three components: 1.
Continuation bias around the previous day's high/low (PDH/PDL). 2. Reversal bias based on failed
continuation, failed breakouts, and exhaustion. 3. Neutral bias to identify liquidity-building days when no
directional trades should be taken. A fixed 25-pip stop loss (0.0025) is assumed for R-multiple
calculations. Trades are only taken when Neutral score < 50 and either Continuation or Reversal score
is at least 70, with Neutral overriding, then Reversal, then Continuation.

Breakout Scanner (Screener)Breakout Scanner (Screener style — single indicator to drop in Screener tab)

Emmanuel Optuma Bar Colors v2This script colours TradingView’s Bar Chart to follow a simple, powerful bar-type logic used in Optuma-style analysis.
It makes the chart easier to read by showing the relationship between:
Up bars
Down bars
Outside bars
Inside bars
🔍 Bar Type Detection
Up Bar
Close > Previous close
→ Indicates upward strength
→ Coloured Green
Down Bar
Close < Previous close
→ Indicates downward pressure
→ Coloured Red
Outside Bar
High > Previous high and Low < Previous low
→ Market expands its range
→ Coloured Blue
Inside Bar
High < Previous high and Low > Previous low
→ Market contracts inside the previous bar
→ Follows previous bar’s colour
🎨 Colour Rules Summary
Bar Type Colour Meaning
Up Bar 🟩 Green Bullish pressure
Down Bar 🟥 Red Bearish pressure
Outside Bar 🔵 Blue Range expansion, bar resets structure
Inside Bar Same as previous bar Market indecision, continuation
🧠 Inside Bar Logic (Very Important)
Inside bars always copy the colour of the previous bar, which means:
If the previous bar was Green → inside bar becomes Green
If the previous bar was Red → inside bar becomes Red
If the previous bar was Blue → inside bar becomes Blue
This keeps the structure visually consistent and easy to read.
📈 Why This Helps Traders
This approach makes it easier to see:
✔ Trend continuation
Inside bars keep the trend colour, making swings clearer.
✔ Trend weakness
Inside bars after outside bars show contraction.
✔ Breakouts
Blue outside bars stand out as moments of range expansion.
✔ Market rhythm
The chart becomes easier to follow for beginners and advanced traders.
🧩 How to Use It
Set chart type to Bars
Add the script
Hide default colours (barcolor replaces them)
This instantly transforms TradingView into a teaching-friendly chart like Optuma.

FOMC Federal Fund Rate Tracker [MHA Finverse]The FOMC Rate Tracker is a comprehensive indicator that visualizes Federal Reserve interest rate decisions and tracks market behavior during FOMC meeting periods. This tool helps traders analyze historical rate changes and anticipate market movements around Federal Open Market Committee announcements.
Key Features:
• Visual FOMC Periods - Automatically highlights each FOMC meeting period with colored boxes spanning from announcement to the next meeting
• Complete Rate Data - Displays actual rates, forecasts, previous rates, and rate differences for every meeting from 2021-2026
• Multiple Color Modes - Choose between cycle colors for visual distinction or rate difference colors (green for hikes, red for cuts, gray for holds)
• Smart Filtering - Filter periods by rate hikes only, cuts only, no change, or surprise moves to focus on specific market conditions
• Performance Metrics - Track average returns during rate hikes, cuts, and holds to identify historical patterns
• Volatility Analysis - Measure and compare price volatility across different FOMC periods
• Statistical Dashboard - View total hikes, cuts, holds, surprises, and longest hold streaks at a glance
• Built-in Alerts - Get notified 1 day before FOMC meetings, on meeting day, or when rates change
How It Works:
The indicator divides your chart into distinct periods between FOMC meetings, with each period showing a labeled box containing the meeting date, actual rate, forecast, previous rate, and rate difference. Future meetings are marked as "UPCOMING" to help you prepare for scheduled announcements.
Use Cases:
- Analyze how markets typically react to rate hikes vs. cuts
- Identify volatility patterns around FOMC announcements
- Backtest strategies based on monetary policy cycles
- Plan trades around upcoming Federal Reserve meetings
- Study the impact of surprise rate decisions on price action
Customization Options:
- Adjustable box transparency and outlines
- Customizable label sizes and colors
- Toggle individual dashboards on/off
- Filter specific types of rate decisions
- Configure alert preferences
This indicator is ideal for traders who incorporate fundamental analysis and monetary policy into their trading decisions. The historical data provides context for understanding market reactions to Federal Reserve actions.

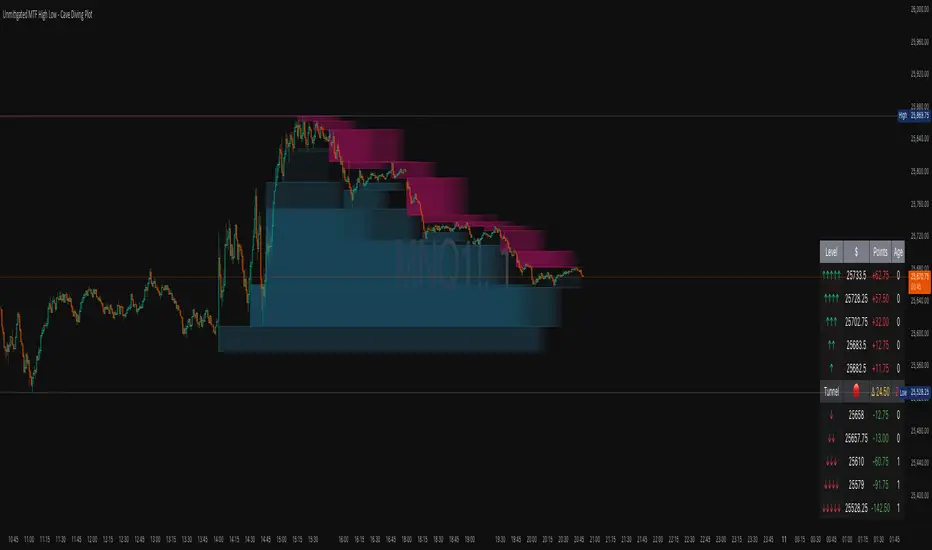
Unmitigated MTF High Low - Cave Diving Plot
IntroductionThe Unmitigated MTF High Low -
Cave Diving Plot is a multi-timeframe (MTF) indicator designed for NQ and ES futures traders who want to identify high-probability entry and exit zones based on unmitigated price levels. The "Cave Diving" visualization helps you navigate between support (floor) and resistance (ceiling) zones, while the integrated Strat analysis provides directional context.
Who Is This For?
Futures traders (NQ, ES) trading during ETH and RTH sessions
Scalpers and day traders looking for precise entry/exit levels
Traders using The Strat methodology for directional analysis
Anyone seeking confluence between price action and key levels
Core Concepts
1. Unmitigated Level:
An unmitigated level is a price high or low that has been created but not yet tested (touched) by price. These levels act as magnets - price often returns to test them.Key Properties:
Resistance (Highs): Price has created a high but hasn't revisited it
Support (Lows): Price has created a low but hasn't revisited it
Mitigation: When price touches a level, it becomes "mitigated" and loses strength
2. The Cave Diving MetaphorThink of trading as cave diving between two zones:
┌─────────────────────────────────┐
│ CEILING (Upper Band) │ ← 1st & 2nd Unmitigated Highs
│ 🟥 Resistance Zone │
├─────────────────────────────────┤
│ │
│ THE TUNNEL │ ← Price navigates here
│ (Trading Channel) │
│ │
├─────────────────────────────────┤
│ 🟢 Support Zone │
│ FLOOR (Lower Band) │ ← 1st & 2nd Unmitigated Lows
└─────────────────────────────────┘
Trading Concept:
Ceiling: Formed by the 1st and 2nd most recent unmitigated highs
Floor: Formed by the 1st and 2nd most recent unmitigated lows
Tunnel: The space between ceiling and floor where price operates
Cave Diving: Navigating between these zones for entries and exits
3. Session-Based Age TrackingLevels are tracked by session age:
Session: 6:00 PM to 5:00 PM NY time (23-hour window)
Age 0: Created in the current session (today)
Age 1: Created 1 session ago (yesterday)
Age 2+: Older levels (more significant)
Why Age Matters:
Older unmitigated levels are typically stronger magnets
Fresh levels (Age 0) may be weaker and easier to break
Age 2+ levels often provide high-probability reversal zones
Indicator Components
Visual Elements
1. Colored Bands (Cave Zones)Upper Band (Pink/Maroon - 95% transparency)
Space between 1st and 2nd unmitigated highs
Acts as resistance zone
Price often hesitates or reverses here
Lower Band (Teal - 95% transparency)
Space between 1st and 2nd unmitigated lows
Acts as support zone
Price often finds buyers here
2. Information Table Located in your chosen corner (default: Bottom Right), the table displays:
5 most recent unmitigated highs (top section)
Tunnel row (middle separator)
5 most recent unmitigated lows (bottom section)
Reading the TableTable Structure
┌────────┬──────────┬────────┬───────┐
│ Level │ $ │ Points │ Age │
├────────┼──────────┼────────┼───────┤
│ ↑↑↑↑↑ │ 21,450.25│ +45.30 │ 3 │ ← 5th High (oldest)
│ ↑↑↑↑ │ 21,425.50│ +32.75 │ 2 │ ← 4th High
│ ↑↑↑ │ 21,410.00│ +25.00 │ 1 │ ← 3rd High
│ ↑↑ │ 21,400.75│ +18.50 │ 1 │ ← 2nd High
│ ↑ │ 21,395.25│ +12.00 │ 0 │ ← 1st High (newest)
├────────┼──────────┼────────┼───────┤
│ Tunnel │ 🟢 │ Δ 85.50│ 2U │ ← Current State
├────────┼──────────┼────────┼───────┤
│ ↓ │ 21,310.00│ -15.25 │ 0 │ ← 1st Low (newest)
│ ↓↓ │ 21,295.50│ -22.75 │ 1 │ ← 2nd Low
│ ↓↓↓ │ 21,280.25│ -30.00 │ 1 │ ← 3rd Low
│ ↓↓↓↓ │ 21,265.75│ -38.50 │ 2 │ ← 4th Low
│ ↓↓↓↓↓ │ 21,250.00│ -45.00 │ 3 │ ← 5th Low (oldest)
└────────┴──────────┴────────┴───────┘Column
Breakdown
Column 1: Level (Arrows)
Green arrows (↑): Resistance levels above current price
Red arrows (↓): Support levels below current price
Arrow count: Indicates recency (1 arrow = newest, 5 arrows = oldest)
Why This Matters:
More arrows = older level = stronger magnet for price
Column 2: $ (Price)
Exact price of the unmitigated level
Use this for limit orders and stop placement
Column 3: Points (Distance)
Positive (+) for highs: Points above current price
Negative (-) for lows: Points below current price
Helps gauge proximity to key levels
Trading Application:
If you're +2.50 points from resistance, a reversal may be imminent
If you're -45.00 points from support, you're far from the floor
Column 4: Age (Sessions)
Number of full 6pm-5pm sessions the level has survived
Age 0: Created today (current session)
Age 1+: Created in previous sessions
Significance Ladder:
Age 0: Weak, may break easily
Age 1-2: Medium strength
Age 3+: Strong, high-probability reaction zone
Tunnel Row (Critical Information)│ Tunnel │ 🟢 │ Δ 85.50│ 2U │
└─┬─┘ └─┬─┘ └──┬──┘ └─┬─┘
│ │ │ │
Label Direction Range Strat
1. Tunnel Label: Identifies the separator row
2. Direction Indicator (🟢/🔴)
🟢 Green Circle: Current 15m bar closed bullish (above previous close)
🔴 Red Circle: Current 15m bar closed bearish (below previous close)
3. Δ (Delta/Range)
Distance in points between 1st High and 1st Low
Shows the tunnel width (trading range)
Example: Δ 85.50 = 85.50 points between ceiling and floor
Trading Use:
Wide tunnel (>100 points): More room to trade, consider range strategies
Narrow tunnel (<50 points): Tight range, expect breakout
4. Strat Pattern
1: Inside bar (consolidation)
2U: 2 Up (bullish directional bar)
2D: 2 Down (bearish directional bar)
3: Outside bar (expansion/volatility)
Color Coding:
Green: 2U (bullish)
Red: 2D (bearish)
Yellow: 3 (expansion)
Gray: 1 (inside/neutral)
Bollinger Bands + VWAP + 4-State MACD BackgroundBollinger Bands + VWAP + 4-State MACD Background
An all-in-one technical analysis indicator combining three proven tools with an intelligent momentum-based background visualization system.
📊 FEATURES
Bollinger Bands
Standard Bollinger Bands implementation with full customization options:
Adjustable period length (default: 20)
Multiple moving average types: SMA, EMA, SMMA (RMA), WMA, VWMA
Configurable standard deviation multiplier (default: 2.0)
Visual fill between bands to highlight volatility zones
Offset capability for forward/backward display
Session VWAP (Volume Weighted Average Price)
Automatically resets at the start of each trading session:
Calculates true volume-weighted average price
Resets daily to provide fresh reference levels
Customizable source input (default: HLC3)
Adjustable line appearance (color and width)
Can be toggled on/off as needed
4-State MACD Background System
This is the unique feature of this indicator. The chart background dynamically changes based on MACD momentum analysis, providing instant visual feedback on trend strength and direction:
🟢 Strong Bullish (Bright Green)
MACD line is above signal line
Histogram is growing (momentum accelerating upward)
Indicates strong upward momentum
🟢 Weak Bullish (Pale Green)
MACD line is above signal line
Histogram is shrinking (momentum decelerating)
Early warning signal that uptrend may be weakening
🔴 Strong Bearish (Bright Red)
MACD line is below signal line
Histogram is falling (momentum accelerating downward)
Indicates strong downward momentum
🔴 Weak Bearish (Pale Red)
MACD line is below signal line
Histogram is rising (momentum decelerating)
Early warning signal that downtrend may be weakening
🎯 HOW TO USE
For Trend Trading:
Strong colored backgrounds indicate confirmed momentum in that direction - consider staying with the trend
Weak colored backgrounds signal potential momentum exhaustion - watch for possible reversals
Use VWAP as a dynamic support/resistance level
Bollinger Band breakouts combined with strong MACD backgrounds can confirm trend strength
Price above VWAP + strong bullish background = bullish bias
Price below VWAP + strong bearish background = bearish bias
For Mean Reversion:
Price touching upper/lower Bollinger Bands with weak MACD background may suggest potential reversal
VWAP acts as a mean reversion anchor during range-bound sessions
Background color shifts from strong to weak often precede price direction changes
Look for price return to VWAP when extended beyond bands with weakening momentum
Signal Confirmation:
Strongest signals occur when multiple indicators align:
BB breakout + MACD strong color + price above/below VWAP
Price rejection at BB bands + MACD color weakening
VWAP support/resistance hold + MACD color change
⚙️ SETTINGS
All components are fully customizable through organized input groups:
Bollinger Bands Group:
Period length
Moving average type (SMA/EMA/SMMA/WMA/VWMA)
Source (close/open/high/low/etc.)
Standard deviation multiplier
Offset
VWAP Group:
Toggle show/hide
Source calculation method
Line color
Line width
MACD Group:
Toggle background on/off
Fast length (default: 12)
Slow length (default: 26)
Signal length (default: 9)
Source
Four separate color settings for each momentum state
All colors include transparency controls
💡 EDUCATIONAL VALUE
This indicator teaches important concepts:
How volatility (Bollinger Bands) relates to price movement
The importance of volume-weighted pricing (VWAP)
Momentum analysis through MACD
How combining multiple timeframes and indicators can provide confluence
The difference between trend strength and trend direction
⚠️ IMPORTANT NOTES
This indicator is for educational and informational purposes only
No indicator is perfect - always use proper risk management
Past performance does not guarantee future results
Combine with your own analysis and risk tolerance
Test thoroughly on historical data before live trading
This is not financial advice - use at your own risk
🔧 TECHNICAL DETAILS
Pine Script Version 6
Overlay indicator (displays on price chart)
All calculations use standard, well-documented formulas
Minimal lag due to efficient coding
Compatible with all timeframes and instruments
No repainting - all signals are confirmed on bar close
📝 CHANGELOG
Version 1.0
Initial release
Bollinger Bands with multiple MA types
Session VWAP with daily reset
4-state MACD background system
Full customization options
Developed for traders who want multiple confirmation signals in a clean, organized format without cluttering their charts with separate indicator panels.

Exhaustion IndicatorThe ScalpSQZ indicator is designed to identify four critical market states using volatility structure, momentum behavior, and exhaustion conditions. It enhances scalping precision by visually marking transitions between consolidation, squeeze conditions, and momentum reversals through color-coded candles.
1. Squeeze Conditions (Orange Candles)
Orange candles highlight volatility compression, detected when Bollinger Bands contract inside the Keltner Channels. This structure signals that market volatility is tightening and a significant expansion move is likely to follow. The squeeze represents a pre-breakout environment and serves as the earliest warning of a potential directional shift.
2. Consolidation Conditions (Yellow Candles)
Yellow candles identify phases of low directional momentum. These conditions occur when RSI remains near neutral values, MACD histogram activity is minimal, and the Rate of Change stays muted. This combination indicates that the market is balanced and non-trending, often preceding a volatility spike or a new trend. Consolidation helps traders avoid low-probability entries during indecisive price action.
3. Momentum Exhaustion — Overbought Fade (White Candles)
White candles signal potential top-side exhaustion. This occurs when RSI enters overbought territory while the MACD histogram begins to weaken compared to the previous bar. This condition does not necessarily call a reversal but warns that bullish momentum is deteriorating and upside continuation may be limited. It is particularly useful for identifying trend fatigue and tightening stop-loss placement.
4. Momentum Exhaustion — Oversold Fade (Purple Candles)
Purple candles identify bottom-side exhaustion and appear when RSI reaches oversold levels, MACD momentum begins improving, and the current close shows buyer defense relative to the previous low. This condition suggests selling pressure is diminishing and a potential reversal or relief bounce may be forming. Purple candles serve as an early indication of bearish trend exhaustion.
Color Priority System
The indicator follows a fixed hierarchy to ensure clarity:
Squeeze (orange) has the highest priority, followed by consolidation (yellow). Exhaustion signals (white for tops, purple for bottoms) apply only when no squeeze or consolidation conditions are active. This structure ensures that the most critical market states are always highlighted first.
Purpose and Application
ScalpSQZ helps traders identify optimal environments for breakouts, anticipate trend exhaustion, and avoid low-quality trades during choppy or low-momentum conditions. It is suitable for scalping, day trading, and swing trading across any asset class or timeframe.
