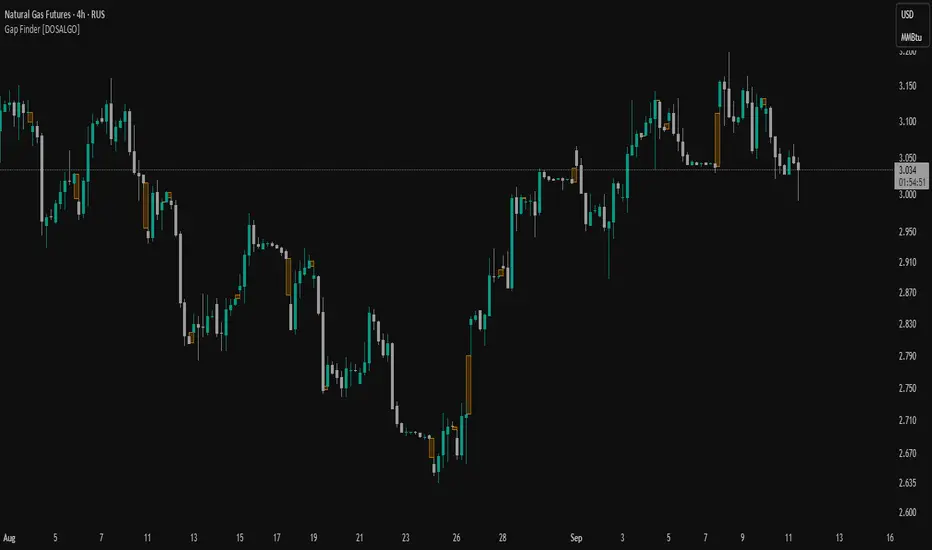
Gap Finder with Box FillSetup and Inputs
The indicator checks the current and previous candles to find gaps, using a color input for filling the gap area on the chart.
Gap Detection:
If the current candle opens higher than the previous close and doesn’t overlap with the previous candle’s range, it marks this as a gap-up.
If the current candle opens lower than the previous close without overlap, it’s marked as a gap-down.
Drawing the Gap:
When a gap-up or gap-down is found, the script draws a box from the previous close to the current candle’s low or high, filling it with the chosen color.
Benefits
Visual Aid: The filled box highlights gaps, making them easy to spot on the chart.
Trade Signals: Gaps can show strong market moves, helping traders spot potential entries or watch for reversals.
Customizable: You can adjust the color to fit your chart style, making the gaps stand out clearly.
This simple tool gives traders a quick view of gaps, which are often key points of interest in technical analysis.
Indicadores e estratégias
MMRI Chart (Primary)The **Mannarino Market Risk Indicator (MMRI)** is a financial risk measurement tool created by financial strategist Gregory Mannarino. It’s designed to assess the risk level in the stock market and economy based on current bond market conditions and the strength of the U.S. dollar. The MMRI considers factors like the U.S. 10-Year Treasury Yield and the Dollar Index (DXY), which indicate investor confidence in government debt and the dollar's purchasing power, respectively.
The formula for MMRI uses the 10-Year Treasury Yield multiplied by the Dollar Index, divided by a constant (1.61) to normalize the risk measure. A higher MMRI score suggests increased market risk, while a lower score indicates more stability. Mannarino has set certain thresholds to interpret the MMRI score:
- **Below 100**: Low risk.
- **100–200**: Moderate risk.
- **200–300**: High risk.
- **Above 300**: Extreme risk, indicating market instability and potential downturns.
This tool aims to provide insight into economic conditions that may affect asset classes like stocks, bonds, and precious metals. Mannarino often updates MMRI scores and risk analyses in his public market updates.

Colored Moving Averages With RSI SignalsMoving Average (MA):
Helps to determine the overall market trend. If the price is above the MA, it may indicate an uptrend, and if below, a downtrend.
In this case, a Simple Moving Average (SMA) is used, but other types can be applied as well.
Relative Strength Index (RSI):
This is an oscillator that measures the speed and changes of price movements.
Values above 70 indicate overbought conditions (possible sell signal), while values below 30 indicate oversold conditions (possible buy signal).
Purpose of This Indicator:
Trading Signals: The indicator generates "Buy" and "Sell" signals based on the intersection of the price line and the moving average, as well as RSI values. This helps traders make more informed decisions.
Signal Filtering: Using RSI in combination with MA allows for filtering false signals since it considers not only the current trend but also the state of overbought or oversold conditions.
How to Use:
For Short-Term Trading: Traders can use buy and sell signals to enter trades based on short-term market fluctuations.
In Combination with Other Indicators: It can be combined with other indicators for a more comprehensive analysis (e.g., adding support and resistance levels).
Overall, this indicator helps traders respond more quickly and accurately to changes in market conditions, enhancing the chances of successful trades.

Linear Regression Channel UltimateKey Features and Benefits
Logarithmic scale option for improved analysis of long-term trends and volatile markets
Activity-based profiling using either touch count or volume data
Customizable channel width and number of profile fills
Adjustable number of most active levels displayed
Highly configurable visual settings for optimal chart readability
Why Logarithmic Scale Matters
The logarithmic scale option is a game-changer for analyzing assets with exponential growth or high volatility. Unlike linear scales, log scales represent percentage changes consistently across the price range. This allows for:
Better visualization of long-term trends
More accurate comparison of price movements across different price levels
Improved analysis of volatile assets or markets experiencing rapid growth
How It Works
The indicator calculates a linear regression line based on the specified period
Upper and lower channel lines are drawn at a customizable distance from the regression line
The space between the channel lines is divided into a user-defined number of levels
For each level, the indicator tracks either:
- The number of times price touches the level (touch count method)
- The total volume traded when price is at the level (volume method)
The most active levels are highlighted based on this activity data
Understanding Touch Count vs Volume
Touch count method: Useful for identifying key support/resistance levels based on price action alone
Volume method: Provides insight into levels where the most trading activity occurs, potentially indicating stronger support/resistance
Practical Applications
Trend identification and strength assessment
Support and resistance level discovery
Entry and exit point optimization
Volume profile analysis for improved market structure understanding
This Linear Regression Channel indicator combines powerful statistical analysis with flexible visualization options, making it an invaluable tool for traders and analysts across various timeframes and markets. Its unique features, especially the logarithmic scale and activity profiling, provide deeper insights into market behavior and potential turning points.

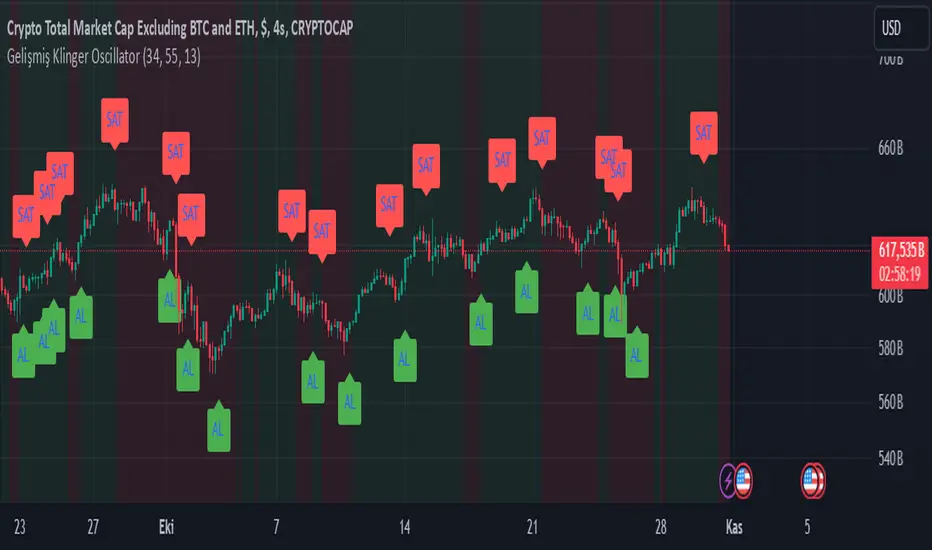
Advanced Klinger OscillatorAdvanced Klinger Oscillator
The Advanced Klinger Oscillator is an enhanced version of the traditional Klinger Oscillator, which measures the difference between two exponential moving averages (EMAs) of volume flow. This tool helps traders identify momentum shifts and potential trading opportunities.
Key Features:
Dual EMA Calculation: The oscillator calculates the difference between a short-term and a long-term EMA of volume flow, smoothing out price fluctuations for clearer trend analysis.
Signal Line: A signal line, which is an EMA of the Klinger Oscillator, generates buy and sell signals. A crossover above the signal line indicates a potential buy, while a crossover below suggests a sell.
Volume Confirmation: Signals are only generated when trading volume exceeds a specified threshold, ensuring that price movements are supported by sufficient market activity.
Trend Lines: Upper and lower trend lines are plotted above the oscillator, helping traders visualize momentum strength and identify bullish or bearish trends.
Background Color Coding: The indicator uses color changes in the background to indicate positive (green) and negative (red) momentum, allowing for quick assessment of market conditions.
Usage:
Traders can utilize the Advanced Klinger Oscillator to:
Identify entry and exit points based on oscillator and signal line crossovers.
Confirm trends by observing the relationship between the oscillator and its trend lines.
Make informed trading decisions by considering volume alongside price movements.
The Advanced Klinger Oscillator is a valuable addition to any trader's toolkit, combining price momentum, volume analysis, and visual cues for effective trading strategies.
Inside Bar with Swing PointsSwing Points with Inside Bar
This script combines swing point analysis with an inside bar pattern visualization, merging essential concepts to identify and visualize key price levels and potential trend reversals. This is especially useful for traders looking to understand price action through swing levels and reactions within inside bar boundaries, making it effective for short-term trend analysis and reversal zone identification.
Script Features:
Swing Point Analysis:
The script identifies swing points based on fractals with a configurable number of bars, allowing for a choice between three and five bars, helping traders fine-tune sensitivity to price movements.
Swing points are visualized as labels, highlighting potential reversal or continuation zones in the price chart.
Inside Bar Visualization:
Inside bars are defined as bars where both the high and low are contained within the previous bar. These often signal consolidation before a potential breakout.
The script displays boundaries of the mother bar (the initial bar encompassing inside bars) and colors candles accordingly, highlighting those within these boundaries.
This feature helps traders focus on price areas where a breakout or trend shift may occur.
Utility and Application:
The script enables traders to visualize inside bars and swing points, which is particularly useful for short-term traders focused on reversal or trend continuation strategies.
Combining swing point analysis with inside bar identification offers a unique approach, helping traders locate key consolidation zones that may precede significant price moves.
This provides not only strong support and resistance levels but also insights into probable breakout points.
How to Use the Script:
Set the number of bars for swing point analysis (3 or 5) to adjust fractal sensitivity.
Enable mother bar boundary visualization and color indication for inside bars to easily spot consolidation patterns.
Pay attention to areas with multiple swing points and inside bars, as these often signal potential reversal or breakout zones.
This script offers flexible tools for analyzing price movements through both swing analysis and consolidation zone identification, aiding decision-making under uncertainty and enhancing market structure understanding.

The Pattern-Synced Moving Average System (PSMA)Description:
The Pattern-Synced Moving Average System (PSMA) is a comprehensive trading indicator that combines the reliability of moving averages with automated candlestick pattern detection, real-time alerts, and dynamic risk management to enhance both trend-following and reversal strategies. The PSMA system integrates key elements of trend analysis and pattern recognition to provide users with configurable entry, stop-loss, and take-profit levels. It is designed for all levels of traders who seek to trade in alignment with market context, using signals from trend direction and established candlestick patterns.
Key Functional Components:
Multi-Type Moving Average:
Provides flexibility with multiple moving average options: SMA, EMA, WMA, and SMMA.
The selected moving average helps users determine market trend direction, with price positions relative to the MA acting as a trend confirmation.
Automatic Candlestick Pattern Detection:
Identifies pivotal patterns, including bullish/bearish engulfing and reversal signals.
Helps traders spot potential market turning points and adjust their strategies accordingly.
Configurable Entry, Stop-Loss, and Take-Profit:
Risk management is customizable through risk/reward ratios and risk tolerance settings.
Entry, stop-loss, and take-profit levels are automatically plotted when patterns appear, facilitating rapid trade decision-making with predefined exit points.
Higher Timeframe Trend Confirmation:
Optional feature to verify trend alignment on a higher timeframe (e.g., checking a daily trend on an intraday chart).
This added filter improves signal reliability by focusing on patterns aligned with the broader market trend.
Real-Time Alerts:
Alerts can be set for key pattern detections, allowing traders to respond promptly without constant chart monitoring.
How to Use PSMA:
Set Moving Average Preferences:
Choose the preferred moving average type and length based on your trading strategy. The MA acts as a foundational trend indicator, with price positions indicating potential uptrends (price above MA) or downtrends (price below MA).
Adjust Risk Management Settings:
Set a Risk/Reward Ratio for defining take-profit levels relative to the entry and stop-loss levels.
Modify the Risk Tolerance Percentage to adjust stop-loss placement, adding flexibility in managing trades based on market volatility.
Activate Higher Timeframe Confirmation (Optional):
Enable higher timeframe trend confirmation to filter out counter-trend trades, ensuring that detected patterns are in sync with the larger market trend.
Review Alerts and Trade Levels:
With PSMA’s real-time alerts, traders receive notifications for detected patterns without having to continuously monitor charts.
Visualized entry, stop-loss, and take-profit lines simplify trade execution by highlighting levels directly on the chart.
Execute Based on Entry and Exit Levels:
The entry line suggests the potential entry price once a bullish or bearish pattern is detected.
The stop-loss line is based on your set risk tolerance, establishing a predefined risk level.
The take-profit line is calculated according to your preferred risk/reward ratio, providing a clear profit target.
Example Strategy:
Ensure price is above or below the selected moving average to confirm trend direction.
Await a PSMA signal for a bullish or bearish pattern.
Review the plotted entry, stop-loss, and take-profit lines, and enter the trade if the setup aligns with your risk/reward criteria.
Activate alerts for continuous monitoring, allowing PSMA to notify you of emerging trade opportunities.
Release Notes:
Line Color and Style Customization: Customizable colors and line styles for entry, stop-loss, and take-profit levels.
Dynamic Trade Tracking: Tracks trade statistics, including total trades, win rate, and average P/L, displayed in the data window for comprehensive trade performance analysis.
Summary: The PSMA indicator is a powerful, user-friendly tool that combines trend detection, pattern recognition, and risk management into a cohesive system for improved trade decision-making. Suitable for stocks, forex, and futures, PSMA offers a unique blend of adaptability and precision, making it valuable for day traders and long-term investors alike. Enjoy this tool as it enhances your ability to execute timely, well-informed trades on TradingView.

SMC Order Block & Liquidity EntryThe SMC Order Block and Liquidity Trap Entry Strategy script uses Smart Money Concepts (SMC), which analyze institutional actions in the market, to assist traders in identifying high-probability trades. In order to help traders match their entry with institutional activity, this script highlights important regions of interest, including order blocks, liquidity zones, and indications for Break of Structure (BOS) or Change of Character (CHoCH).
The fundamental ideas of this approach, which focuses on regions where institutions frequently make sizable orders or sweep liquidity, are based on SMC principles. Order blocks, which are frequently important support or resistance zones when institutions are involved, are the final bullish or bearish candle before a significant price move in the other direction. There are liquidity zones that show where retail stop-loss orders build up (above recent highs or below recent lows), such as Buy-Side Liquidity (BSL) and Sell-Side Liquidity (SSL). Before changing the direction of the price, institutions could target these zones, giving traders possible chances.
The script depicts liquidity levels above or below recent highs and lows, automatically finds order blocks within a specified lookback time, and looks for BOS (a continuation signal) or CHoCH (a reversal signal). When liquidity retests inside an order block coincide with BOS or CHoCH circumstances, entry signals are produced. While short entries are triggered when the price breaks below the order block and SSL, long entry alerts are triggered when the price breaks above the order block and BSL.

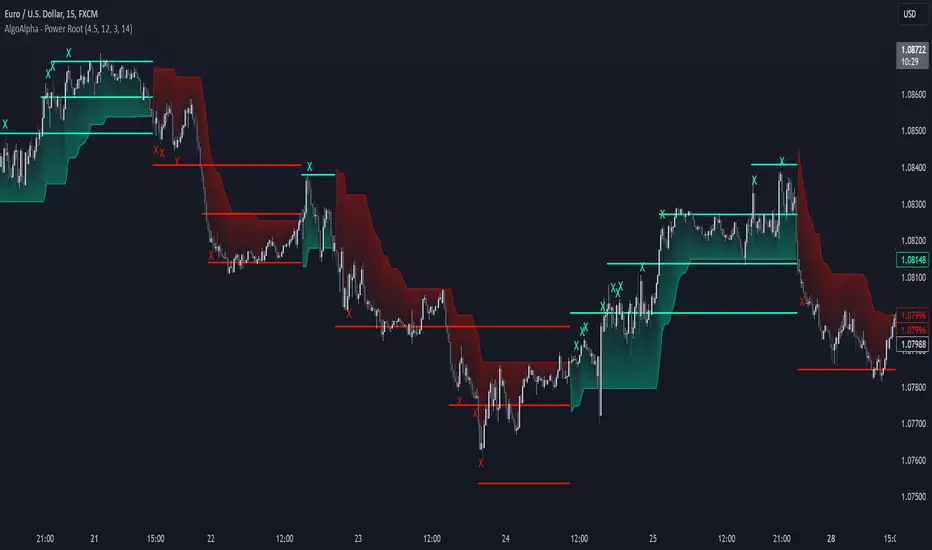
Power Root SuperTrend [AlgoAlpha]📈🚀 Power Root SuperTrend by AlgoAlpha - Elevate Your Trading Strategy! 🌟
Introducing the Power Root SuperTrend by AlgoAlpha, an advanced trading indicator that enhances the traditional SuperTrend by incorporating Root-Mean-Square (RMS) calculations for a more responsive and adaptive trend detection. This innovative tool is designed to help traders identify trend directions, potential take-profit levels, and optimize entry and exit points with greater accuracy, making it an excellent addition to your trading arsenal.
Key Features:
🔹 Root-Mean-Square SuperTrend Calculation : Utilizes the RMS of closing prices to create a smoother and more sensitive SuperTrend line that adapts quickly to market changes.
🔸 Multiple Take-Profit Levels : Automatically calculates and plots up to seven take-profit levels (TP1 to TP7) based on market volatility and the change in SuperTrend values.
🟢 Dynamic Trend Coloring : Visually distinguish between bullish and bearish trends with customizable colors for clearer market visualization.
📊 RSI-Based Take-Profit Signals : Incorporates the Relative Strength Index (RSI) of the distance between the price and the SuperTrend line to generate additional take-profit signals.
🔔 Customizable Alerts : Set alerts for trend direction changes, achievement of take-profit levels, and RSI-based take-profit conditions to stay informed without constant chart monitoring.
How to Use:
Add the Indicator : Add the indicator to favorites by pressing the ⭐ icon or search for "Power Root SuperTrend " in the TradingView indicators library and add it to your chart. Adjust parameters such as the ATR multiplier, ATR length, RMS length, and RSI take-profit length to suit your trading style and the specific asset you are analyzing.
Analyze the Chart : Observe the SuperTrend line and the plotted take-profit levels. The color changes indicate trend directions—green for bullish and red for bearish trends.
Set Alerts : Utilize the built-in alert conditions to receive notifications when the trend direction changes, when each TP level is drawn, or when RSI-based take-profit conditions are met.
How It Works:
The Power Root SuperTrend indicator enhances traditional SuperTrend calculations by applying a Root-Mean-Square (RMS) function to the closing prices, resulting in a more responsive trend line that better reflects recent price movements. It calculates the Average True Range (ATR) to determine the volatility and sets the upper and lower SuperTrend bands accordingly. When a trend direction change is detected—signified by the SuperTrend line switching from above to below the price or vice versa—the indicator calculates the change in the SuperTrend value. This change is then used to establish multiple take-profit levels (TP1 to TP7), each representing incremental targets based on market volatility. Additionally, the indicator computes the RSI of the distance between the current price and the SuperTrend line to generate extra take-profit signals when the RSI crosses under a specific threshold. The combination of RMS calculations, multiple TP levels, dynamic coloring, and RSI signals provides traders with a comprehensive tool for identifying trends and optimizing trade exits. Customizable alerts ensure that traders can stay updated on important market developments without needing to constantly watch the charts.
Elevate your trading strategy with the Power Root SuperTrend indicator and gain a smarter edge in the markets! 🚀✨
Basic RSI Strategy with MFI Description: This Pine Script is a custom trading strategy that combines the power of the RSI (Relative Strength Index) and MFI (Money Flow Index) indicators with additional signal filters and a user-friendly dashboard. The strategy is designed to identify potential entry and exit points based on dynamic conditions, providing an advanced approach to technical analysis and decision-making in trading.
Key Features:
RSI-Based Signals:
Generates buy signals when the RSI-based moving average crosses above specific thresholds (29 and 50).
Generates sell signals when the RSI-based moving average crosses below specific thresholds (50 and 69).
MFI Filtering:
Signals are validated only if the MFI value is within the specified range of 20 to 80, ensuring that signals are generated only when market conditions are favorable.
Dynamic Signal Thresholds:
The script includes adjustable thresholds for the percentage difference between consecutive bars, as well as the range between high and low prices, to refine signal accuracy.
Dashboard:
Displays real-time statistics in the top right corner of the chart, including the total number of signals, the count of buy and sell signals, and the time duration over which these signals were generated.
How to Use:
Settings: Customize the RSI and MFI lengths, along with thresholds for price movement and MFI range. This flexibility allows the strategy to be tailored to different market conditions and timeframes.
Dashboard Insight: Track the strategy's performance in real-time, with an intuitive overview of generated signals and their time distribution on the chart.
Ideal For:
This script is suitable for traders seeking a robust, customizable, and real-time signal generation strategy that combines momentum and volume indicators. The strategy’s unique filtering mechanism provides a higher level of precision, making it an excellent tool for those who prioritize signal accuracy and clarity.

SMA- Ashish SinghSMA
This script implements a Simple Moving Average (SMA) crossover strategy using three SMAs: 200-day, 50-day, and 20-day, with buy and sell signals triggered based on specific conditions involving these moving averages. The indicator is overlaid on the price chart, providing visual cues for potential buy and sell opportunities based on moving average crossovers.
Key Features:
Moving Averages:
The 200-day, 50-day, and 20-day SMAs are calculated and plotted on the price chart. These are key levels that traders use to assess trends.
The 200-day SMA represents the long-term trend, the 50-day SMA is used for medium-term trends, and the 20-day SMA is for short-term analysis.
Buy Signal:
A buy signal is triggered when the price is below all three moving averages (200 SMA, 50 SMA, 20 SMA) and the SMAs are in a specific downward trend (200 SMA > 50 SMA > 20 SMA). This is an indication of a potential upward reversal.
The buy signal is marked with a green triangle below the price bar.
Sell Signal:
A sell signal is triggered when the price is above all three moving averages and the SMAs are in a specific upward trend (200 SMA < 50 SMA < 20 SMA). This signals a potential downward reversal.
The sell signal is marked with a red triangle above the price bar.
Trade Information:
After a buy signal, the buy price, bar index, and timestamp are recorded. When a sell signal occurs, the percentage gain or loss is calculated along with the number of days between the buy and sell signals.
The script automatically displays a label on the chart showing the gain or loss percentage along with the number of days the trade lasted. Green labels represent gains, and red labels represent losses.
User-friendly Visuals:
The buy and sell signals are plotted as small triangles directly on the chart for easy identification.
Detailed trade information is provided with well-formatted labels to highlight the profit or loss after each trade.
How It Works:
This strategy helps traders to identify trend reversals by leveraging long-term and short-term moving averages.
A single buy or sell signal is triggered based on price movement relative to the SMAs and their order.
The tool is designed to help traders quickly spot buying and selling opportunities with clear visual indicators and gain/loss metrics.
This indicator is ideal for traders looking to implement a systematic SMA-based strategy with well-defined buy/sell points and automatic performance tracking for each trade.
Disclaimer: The information provided here is for educational and informational purposes only. It is not intended as financial advice or as a recommendation to buy or sell any stocks. Please conduct your own research or consult a financial advisor before making any investment decisions. ProfitLens does not guarantee the accuracy, completeness, or reliability of any information presented.

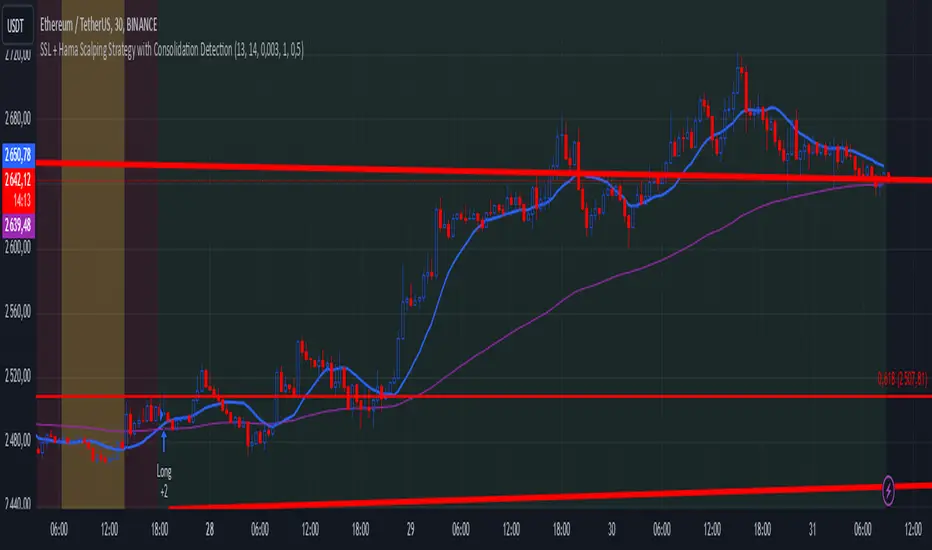
TrendGuard Scalper: SSL + Hama Candle with Consolidation ZonesThis TradingView script brings a powerful scalping strategy that combines the SSL Channel and Hama Candles indicators with a special twist—consolidation detection. Designed for traders looking for consistency in various markets like crypto, forex, and stocks, this strategy highlights clear trend signals, risk management, and helps filter out risky trades during consolidation periods.
Why Use This Strategy?
Clear Trend Detection:
With the SSL Channel, you’ll know exactly when the market is in an uptrend (green) or downtrend (red), giving you straightforward entry points.
Short-Term Trend Precision with Hama Candles:
By calculating unique EMAs for open, high, low, and close, the Hama Candles show the strength and direction of short-term trends. Combined with the Hama Line, it gives you a solid confirmation on whether the trend is strong or about to reverse, allowing for precise entries and exits.
Avoiding Choppy Markets:
Thanks to ATR-based consolidation detection, this strategy identifies low-volatility periods where the market is “choppy” and less predictable. During these times, a yellow background appears on the chart, warning you to hold off on trades, reducing the likelihood of entering losing trades.
Built-In Risk Management:
With adjustable Take Profit and Stop Loss levels based on price movements, you can set and forget your trades, with a safety net if the market turns against you. The strategy automatically closes positions if the price returns to the Hama Candle, keeping your risk low.
How It Works:
Long Position: When both the SSL and Hama indicators show a green trend, and the price is above the Hama Candles, the strategy opens a long position. Take Profit triggers at your chosen risk-to-reward ratio, while Stop Loss protects you just below the Hama Line.
Short Position: When both indicators align in red and the price is below the Hama Candles, the strategy opens a short. Similar to longs, Stop Loss is set just above the Hama Line, and Take Profit is at your defined level.
Start Trading Confidently
Test this strategy with different settings and discover how it can perform across various assets. Whether you're trading Bitcoin, forex pairs, or stocks, this system has the flexibility and robustness to help you spot profitable trends and avoid risky zones. Try it today on a 30-minute timeframe to see how it aligns with your trading goals, and let the consolidation detection guide you away from false signals.
Happy trading, and may the trends be with you! 📈
IQ Zones [TradingIQ]Hey Traders!
Introducing "IQ Zones".
"IQ Zones" is an indicator that combines support and resistance identification with volume, the "value area" of a candlestick to be exact. IQ Zones identifies turning points in the market; however, the candlestick high or low that formed the key turning point is not necessarily distinguished as the support/resistance area. Instead, the script looks into the bar at lower timeframes and calculates the value area of the candlestick that formed the support or resistance level. Therefore, any lines protruding from a candlestick reflect the value area of that candlestick. These levels (value area high and value area low) are marked on the candlestick as a support/resistance level. If the level formed on high volume it's marked as an "IQ Zone".
Additionally, IQ Zones presents a heat map to show volume intensity at nearby price areas. The heatmap is a product of the Volume Profile (IQ Profile) located on the right of the chart.
The IQ Profile is a segmented volume profile. Recent price is split into fifths (customizable), and individual volume profiles are calculated for all segmented price areas. Price is split into more than one segment to avoid a situation where volume in a ranging price zone far surpasses all other recent price areas - creating an "unusable" volume profile that doesn't offer helpful insights. If desired, you can set the segmenting option to "1" to calculate one unified volume profile for the entire price range.
The image above shows IQ Zones in action!
Core Features of IQ Zones
Value Area Support and Resistance Levels
Segmented volume profile for the recent trading period
Volume intensity heatmap
Support and resistance levels in high volume intensity may be more significant as price stoppers
The image above explains the labels marked along the y-axis of the IQ Profile.
The "more green" a price area/label is, the higher the volume intensity at the marked support/resistance area.
The image above further explains line lines protruding from the IQ Profile.
For this example, the value area of the candlestick (where most trading action occurred) is quite far from the high price of the candlestick that formed a resistance level! Using the value area of a candlestick that marks a key turning point to draw support/resistance offers insight into where the majority of trading action took place when the support/resistance level was forming!
Additionally, you can hover your mouse over the IQ Zone labels (triangles pointing up or down) to see the prices of the value area for the support/resistance level, including the total buying volume and total selling volume at the price area!
The image above further explains the IQ Profile!
You can segment the recent price area anywhere from 1 - 15 times.
The image above further explains IQ Zones and the IQ Profile!
That will be all for this indicator - a fun project to share with the community.
Thank you!

Monthly EMA Touches CounterKey Features of This Script:
Touch Threshold: The script checks if the price is within a specified percentage of each EMA.
Monthly Touch Counters: Separate counters (touchCountEMA12, touchCountEMA26, touchCountEMA50) are used to count touches for each EMA.
Reset Logic: All counters reset at the start of a new month using if ta.change(time("M")).
Increment Logic: Each counter increments whenever the corresponding EMA is touched during a bar.
Label Management: Labels are created to display each count above the bars at the end of each month.
Alert Conditions: Alerts are set up for when the price touches any of the EMAs.
Usage:
Copy and paste this script into TradingView's Pine Script editor.
Add it to your chart to see how many times the price has touched each of the EMAs (12, 26, and 50) on a monthly basis.
Adjust the Touch Threshold (%) input as needed for sensitivity.
This implementation will allow you to effectively track and visualize how often price touches each of these EMAs on a monthly basis. If you have further modifications or additional features you'd like to explore, feel free to ask

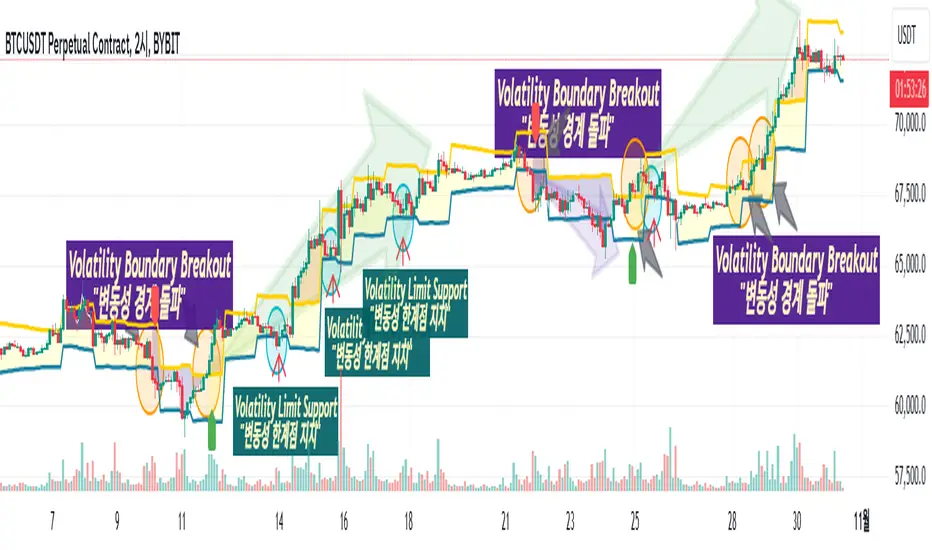
Daily Volatility Limit Channel
Hello, this is the simplest yet most powerful tool I have discovered regarding volatility. Using the ATR17 value based on a 4-hour timeframe, this tool displays the most significant volatility thresholds for the day, clearly showing when strong trends occur as these boundaries are breached. Once a boundary is crossed, the price of Bitcoin (as well as other actively traded asset classes like stocks and futures) tends to continue moving in the direction of the breakout. If the price reaches a boundary but fails to break through, this point often becomes the lowest point of pullback or correction, effectively serving as a pivot point and the optimal entry for buying.
The indicator features color and arrow options, enhancing your trading experience. The arrows appear below the candles when the trend changes to an upward impulse and above the candles when it shifts to a downward impulse. This visual aid allows traders to quickly identify trend reversals and make informed decisions.
In summary, this tool effectively highlights volatility limits and trend reversals, making it a valuable asset for any trader looking to navigate the market efficiently.
This indicator is recommended for use on 2-hour or 4-hour candlestick charts. These timeframes allow for clearer visualization of volatility and help effectively identify strong trends and volatility boundaries.
안녕하세요. 이것은 변동성에 관해 제가 발견한 것 중 가장 심플하고도 강력한 툴입니다. 4시간 기준의 ATR17값을 사용한 이 툴은 당일의 가장 강력한 변동성 한계점을 보여주며, 이 변동성 경계가 돌파될 때 강한 추세가 일어나는 것을 명확히 보여줍니다. 한 번 경계가 돌파되면 비트코인 가격(그리고 주식, 선물 등 다른 대부분의 모든 가격을 가지고 활발하게 거래되는 자산군)은 해당 돌파 쪽의 트렌드로 계속 움직이는 경향이 있습니다. 만약 가격이 경계에 도달한 채로 이 경계를 돌파하지 못할 때는 이 자리가 눌림과 조정의 최저점, 즉 피봇 포인트가 되어 매수의 최적 지점이 되는 것을 보실 수 있습니다.
지표에는 컬러 옵션과 화살표 옵션이 있어 거래 경험을 향상시킵니다. 트렌드가 상승 임펄스로 변경될 때 화살표가 캔들 아래에 나타나고, 하락 임펄스로 변경될 때는 캔들 위에 나타납니다. 이 시각적 도구는 트렌드 반전을 빠르게 식별할 수 있도록 도와주어, 거래자들이 정보에 기반한 결정을 내리는 데 유용합니다.
요약하자면, 이 툴은 변동성 한계와 트렌드 반전을 효과적으로 강조하여, 시장을 효율적으로 탐색하려는 모든 거래자에게 가치 있는 자산이 될 것입니다.
이 지표는 2시간 또는 4시간 캔들 차트에서 사용하는 것이 권장됩니다. 이러한 시간대는 지표의 변동성을 보다 명확하게 시각화하며, 강한 추세와 변동성 한계점을 효과적으로 식별하는 데 도움을 줍니다.
Z-Score RSI StrategyOverview
The Z-Score RSI Indicator is an experimental take on momentum analysis. By applying the Relative Strength Index (RSI) to a Z-score of price data, it measures how far prices deviate from their mean, scaled by standard deviation. This isn’t your traditional use of RSI, which is typically based on price data alone. Nevertheless, this unconventional approach can yield unique insights into market trends and potential reversals.
Theory and Interpretation
The RSI calculates the balance between average gains and losses over a set period, outputting values from 0 to 100. Typically, people look at the overbought or oversold levels to identify momentum extremes that might be likely to lead to a reversal. However, I’ve often found that RSI can be effective for trend-following when observing the crossover of its moving average with the midline or the crossover of the RSI with its own moving average. These crossovers can provide useful trend signals in various market conditions.
By combining RSI with a Z-score of price, this indicator estimates the relative strength of the price’s distance from its mean. Positive Z-score trends may signal a potential for higher-than-average prices in the near future (scaled by the standard deviation), while negative trends suggest the opposite. Essentially, when the Z-Score RSI indicates a trend, it reflects that the Z-score (the distance between the average and current price) is likely to continue moving in the trend’s direction. Generally, this signals a potential price movement, though it’s important to note that this could also occur if there’s a shift in the mean or standard deviation, rather than a meaningful change in price itself.
While the Z-Score RSI could be an insightful addition to a comprehensive trading system, it should be interpreted carefully. Mean shifts may validate the indicator’s predictions without necessarily indicating any notable price change, meaning it’s best used in tandem with other indicators or strategies.
Recommendations
Before putting this indicator to use, conduct thorough backtesting and avoid overfitting. The added parameters allow fine-tuning to fit various assets, but be careful not to optimize purely for the highest historical returns. Doing so may create an overly tailored strategy that performs well in backtests but fails in live markets. Keep it balanced and look for robust performance across multiple scenarios, as overfitting is likely to lead to disappointing real-world results.

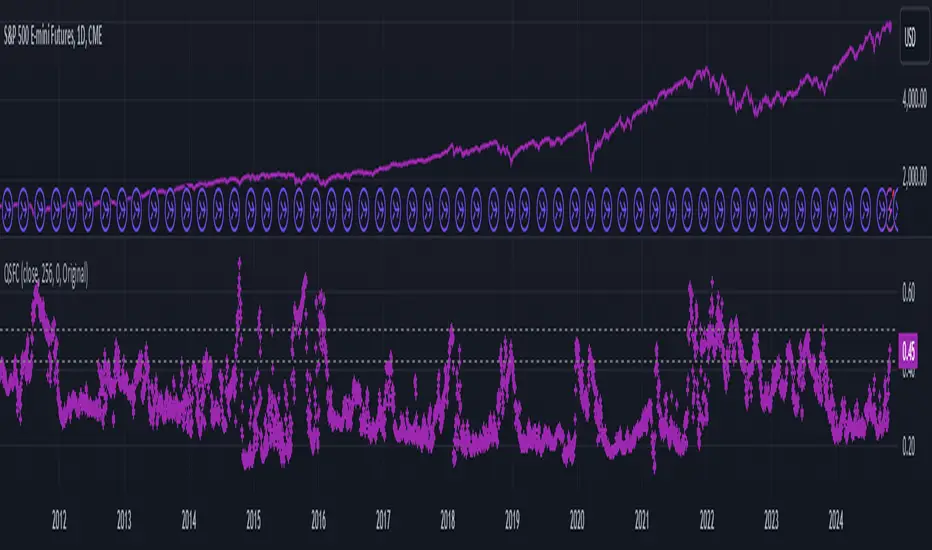
Quick scan for cycles🙏🏻
The followup for
As I told before, ML based algorading is all about detecting any kind of non-randomness & exploiting it (cuz allegedly u cant trade randomness), and cycles are legit patterns that can be leveraged
But bro would u really apply Fourier / Wavelets / 'whatever else heavy' on every update of thousands of datasets, esp in real time on HFT / nearly HFT data? That's why this metric. It works much faster & eats hell of a less electicity, will do initial rough filtering of time series that might contain any kind of cyclic behaviour. And then, only on these filtered datasets u gonna put Periodograms / Autocorrelograms and see what's going there for real. Better to do it 10x times less a day on 10x less datasets, right?
I ended up with 2 methods / formulas, I called em 'type 0' and 'type 1':
- type 0: takes sum of abs deviations from drift line, scales it by max abs deviation from the same drift line;
- type 1: takes sum of abs deviations from drift line, scales it by range of non-abs deviations from the same drift line.
Finnaly I've chosen type 0 , both logically (sum of abs dev divided by max abs dev makes more sense) and experimentally. About that actually, here are both formulas put on sine waves with uniform noise:
^^ generated sine wave with uniform noise
^^ both formulas on that wave
^^ both formulas on real data
As you can see type 0 is less affected by noise and shows higher values on synthetic data, but I decided to put type 1 inside as well, in case my analysis was not complete and on real data type 1 can actually be better since it has a lil higher info gain / info content (still not sure). But I can assure u that out of all other ways I've designed & tested for quite a time I tell you, these 2 are really the only ones who got there.
Now about dem thresholds and how to use it.
Both type 0 and type 1 can be modelled with Beta distribution, and based on it and on some obvious & tho non mainstream statistical modelling techniques, I got these thresholds, so these are not optimized overfitted values, but natural ones. Each type has 3 thresholds (from lowest to highest):
- typical value (turned off by default). aka basis ;
- typical deviation from typical value, aka deviation ;
- maximum modelled deviation from typical value (idk whow to call it properly for now, this is my own R&D), aka extension .
So when the metric is above one of these thresholds (which one is up to you, you'll read about it in a sec), it means that there might be a strong enough periodic signal inside the data, and the data got to be put through proper spectral analysis tools to confirm / deny it.
If you look at the pictures above again, you'll see gray signal, that's uniform noise. Take a look at it and see where does it sit comparing to the thresholds. Now you just undertand that picking up a threshold is all about the amount of false positives you care to withstand.
If you take basis as threshold, you'll get tons of false positives (that's why it's even turned off by default), but you'll almost never miss a true positive. If you take deviation as threshold, it's gonna be kinda balanced approach. If you take extension as threshold, you gonna miss some cycles, and gonna get only the strongest ones.
More true positives -> more false positives, less false positives -> less true positives, can't go around that mane
Just to be clear again, I am not completely sure yet, but I def lean towards type 0 as metric, and deviation as threshold.
Live Long and Prosper
P.S.: That was actually the main R&D of the last month, that script I've released earlier came out as derivative.
P.S.: These 2 are the first R&Ds made completely in " art-space", St. Petersburg. Come and see me, say wassup🤘🏻
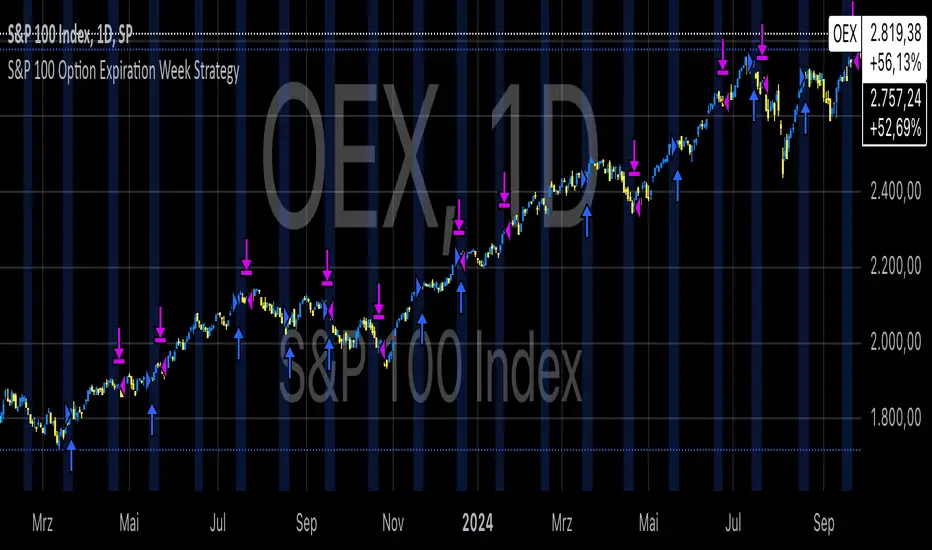
S&P 100 Option Expiration Week StrategyThe Option Expiration Week Strategy aims to capitalize on increased volatility and trading volume that often occur during the week leading up to the expiration of options on stocks in the S&P 100 index. This period, known as the option expiration week, culminates on the third Friday of each month when stock options typically expire in the U.S. During this week, investors in this strategy take a long position in S&P 100 stocks or an equivalent ETF from the Monday preceding the third Friday, holding until Friday. The strategy capitalizes on potential upward price pressures caused by increased option-related trading activity, rebalancing, and hedging practices.
The phenomenon leveraged by this strategy is well-documented in finance literature. Studies demonstrate that options expiration dates have a significant impact on stock returns, trading volume, and volatility. This effect is driven by various market dynamics, including portfolio rebalancing, delta hedging by option market makers, and the unwinding of positions by institutional investors (Stoll & Whaley, 1987; Ni, Pearson, & Poteshman, 2005). These market activities intensify near option expiration, causing price adjustments that may create short-term profitable opportunities for those aware of these patterns (Roll, Schwartz, & Subrahmanyam, 2009).
The paper by Johnson and So (2013), Returns and Option Activity over the Option-Expiration Week for S&P 100 Stocks, provides empirical evidence supporting this strategy. The study analyzes the impact of option expiration on S&P 100 stocks, showing that these stocks tend to exhibit abnormal returns and increased volume during the expiration week. The authors attribute these patterns to intensified option trading activity, where demand for hedging and arbitrage around options expiration causes temporary price adjustments.
Scientific Explanation
Research has found that option expiration weeks are marked by predictable increases in stock returns and volatility, largely due to the role of options market makers and institutional investors. Option market makers often use delta hedging to manage exposure, which requires frequent buying or selling of the underlying stock to maintain a hedged position. As expiration approaches, their activity can amplify price fluctuations. Additionally, institutional investors often roll over or unwind positions during expiration weeks, creating further demand for underlying stocks (Stoll & Whaley, 1987). This increased demand around expiration week typically leads to temporary stock price increases, offering profitable opportunities for short-term strategies.
Key Research and Bibliography
Johnson, T. C., & So, E. C. (2013). Returns and Option Activity over the Option-Expiration Week for S&P 100 Stocks. Journal of Banking and Finance, 37(11), 4226-4240.
This study specifically examines the S&P 100 stocks and demonstrates that option expiration weeks are associated with abnormal returns and trading volume due to increased activity in the options market.
Stoll, H. R., & Whaley, R. E. (1987). Program Trading and Expiration-Day Effects. Financial Analysts Journal, 43(2), 16-28.
Stoll and Whaley analyze how program trading and portfolio insurance strategies around expiration days impact stock prices, leading to temporary volatility and increased trading volume.
Ni, S. X., Pearson, N. D., & Poteshman, A. M. (2005). Stock Price Clustering on Option Expiration Dates. Journal of Financial Economics, 78(1), 49-87.
This paper investigates how option expiration dates affect stock price clustering and volume, driven by delta hedging and other option-related trading activities.
Roll, R., Schwartz, E., & Subrahmanyam, A. (2009). Options Trading Activity and Firm Valuation. Journal of Financial Markets, 12(3), 519-534.
The authors explore how options trading activity influences firm valuation, finding that higher options volume around expiration dates can lead to temporary price movements in underlying stocks.
Cao, C., & Wei, J. (2010). Option Market Liquidity and Stock Return Volatility. Journal of Financial and Quantitative Analysis, 45(2), 481-507.
This study examines the relationship between options market liquidity and stock return volatility, finding that increased liquidity needs during expiration weeks can heighten volatility, impacting stock returns.
Summary
The Option Expiration Week Strategy utilizes well-researched financial market phenomena related to option expiration. By positioning long in S&P 100 stocks or ETFs during this period, traders can potentially capture abnormal returns driven by option market dynamics. The literature suggests that options-related activities—such as delta hedging, position rollovers, and portfolio adjustments—intensify demand for underlying assets, creating short-term profit opportunities around these key dates.
Payday Anomaly StrategyThe "Payday Effect" refers to a predictable anomaly in financial markets where stock returns exhibit significant fluctuations around specific pay periods. Typically, these are associated with the beginning, middle, or end of the month when many investors receive wages and salaries. This influx of funds, often directed automatically into retirement accounts or investment portfolios (such as 401(k) plans in the United States), temporarily increases the demand for equities. This phenomenon has been linked to a cycle where stock prices rise disproportionately on and around payday periods due to increased buy-side liquidity.
Academic research on the payday effect suggests that this pattern is tied to systematic cash flows into financial markets, primarily driven by employee retirement and savings plans. The regularity of these cash infusions creates a calendar-based pattern that can be exploited in trading strategies. Studies show that returns on days around typical payroll dates tend to be above average, and this pattern remains observable across various time periods and regions.
The rationale behind the payday effect is rooted in the behavioral tendencies of investors, specifically the automatic reinvestment mechanisms used in retirement funds, which align with monthly or semi-monthly salary payments. This regular injection of funds can cause market microstructure effects where stock prices temporarily increase, only to stabilize or reverse after the funds have been invested. Consequently, the payday effect provides traders with a potentially profitable opportunity by predicting these inflows.
Scientific Bibliography on the Payday Effect
Ma, A., & Pratt, W. R. (2017). Payday Anomaly: The Market Impact of Semi-Monthly Pay Periods. Social Science Research Network (SSRN).
This study provides a comprehensive analysis of the payday effect, exploring how returns tend to peak around payroll periods due to semi-monthly cash flows. The paper discusses how systematic inflows impact returns, leading to predictable stock performance patterns on specific days of the month.
Lakonishok, J., & Smidt, S. (1988). Are Seasonal Anomalies Real? A Ninety-Year Perspective. The Review of Financial Studies, 1(4), 403-425.
This foundational study explores calendar anomalies, including the payday effect. By examining data over nearly a century, the authors establish a framework for understanding seasonal and monthly patterns in stock returns, which provides historical support for the payday effect.
Owen, S., & Rabinovitch, R. (1983). On the Predictability of Common Stock Returns: A Step Beyond the Random Walk Hypothesis. Journal of Business Finance & Accounting, 10(3), 379-396.
This paper investigates predictability in stock returns beyond random fluctuations. It considers payday effects among various calendar anomalies, arguing that certain dates yield predictable returns due to regular cash inflows.
Loughran, T., & Schultz, P. (2005). Liquidity: Urban versus Rural Firms. Journal of Financial Economics, 78(2), 341-374.
While primarily focused on liquidity, this study provides insight into how cash flows, such as those from semi-monthly paychecks, influence liquidity levels and consequently impact stock prices around predictable pay dates.
Ariel, R. A. (1990). High Stock Returns Before Holidays: Existence and Evidence on Possible Causes. The Journal of Finance, 45(5), 1611-1626.
Ariel’s work highlights stock return patterns tied to certain dates, including paydays. Although the study focuses on pre-holiday returns, it suggests broader implications of predictable investment timing, reinforcing the calendar-based effects seen with payday anomalies.
Summary
Research on the payday effect highlights a repeating pattern in stock market returns driven by scheduled payroll investments. This cyclical increase in stock demand aligns with behavioral finance insights and market microstructure theories, offering a valuable basis for trading strategies focused on the beginning, middle, and end of each month.

XAUUSD 10-Minute StrategyThis XAUUSD 10-Minute Strategy is designed for trading Gold vs. USD on a 10-minute timeframe. By combining multiple technical indicators (MACD, RSI, Bollinger Bands, and ATR), the strategy effectively captures both trend-following and reversal opportunities, with adaptive risk management for varying market volatility. This approach balances high-probability entries with robust volatility management, making it suitable for traders seeking to optimise entries during significant price movements and reversals.
Key Components and Logic:
MACD (12, 26, 9):
Generates buy signals on MACD Line crossovers above the Signal Line and sell signals on crossovers below the Signal Line, helping to capture momentum shifts.
RSI (14):
Utilizes oversold (below 35) and overbought (above 65) levels as a secondary filter to validate entries and avoid overextended price zones.
Bollinger Bands (20, 2):
Uses upper and lower Bollinger Bands to identify potential overbought and oversold conditions, aiming to enter long trades near the lower band and short trades near the upper band.
ATR-Based Stop Loss and Take Profit:
Stop Loss and Take Profit levels are dynamically set as multiples of ATR (3x for stop loss, 5x for take profit), ensuring flexibility with market volatility to optimise exit points.
Entry & Exit Conditions:
Buy Entry: T riggered when any of the following conditions are met:
MACD Line crosses above the Signal Line
RSI is oversold
Price drops below the lower Bollinger Band
Sell Entry: Triggered when any of the following conditions are met:
MACD Line crosses below the Signal Line
RSI is overbought
Price moves above the upper Bollinger Band
Exit Strategy: Trades are closed based on opposing entry signals, with adaptive spread adjustments for realistic exit points.
Backtesting Configuration & Results:
Backtesting Period: July 21, 2024, to October 30, 2024
Symbol Info: XAUUSD, 10-minute timeframe, OANDA data source
Backtesting Capital: Initial capital of $700, with each trade set to 10 contracts (equivalent to approximately 0.1 lots based on the broker’s contract size for gold).
Users should confirm their broker's contract size for gold, as this may differ. This script uses 10 contracts for backtesting purposes, aligned with 0.1 lots on brokers offering a 100-contract specification.
Key Backtesting Performance Metrics:
Net Profit: $4,733.90 USD (676.27% increase)
Total Closed Trades: 526
Win Rate: 53.99%
Profit Factor: 1.44 (1.96 for Long trades, 1.14 for Short trades)
Max Drawdown: $819.75 USD (56.33% of equity)
Sharpe Ratio: 1.726
Average Trade: $9.00 USD (0.04% of equity per trade)
This backtest reflects realistic conditions, with a spread adjustment of 38 points and no slippage or commission applied. The settings aim to simulate typical retail trading conditions. However, please adjust the initial capital, contract size, and other settings based on your account specifics for best results.
Usage:
This strategy is tuned specifically for XAUUSD on a 10-minute timeframe, ideal for both trend-following and reversal trades. The ATR-based stop loss and take profit levels adapt dynamically to market volatility, optimising entries and exits in varied conditions. To backtest this script accurately, ensure your broker’s contract specifications for gold align with the parameters used in this strategy.

Asian Session ShadingDescription
The "Asian Session Shading" indicator is designed to highlight the trading hours of the Asian market session on TradingView charts. This script shades the background of the chart in a pale blue color to visually distinguish the time period of the Asian trading session. By using this indicator, traders can easily identify when the Asian session is active, helping them to analyze and make informed trading decisions based on time-specific market behavior.
Features
Customizable Timing: The session start and end times can be adjusted to fit different Asian market hours.
Visual Clarity: The pale blue shading helps to visually separate the Asian session from other trading sessions.
Easy to Use: Simple implementation with clear visual cues on the chart.
Best Use Cases
Market Analysis: Traders can use this indicator to analyze market movements and trends specific to the Asian trading session.
Trading Strategies: This tool can assist in developing and implementing trading strategies that take into account the unique characteristics of the Asian market.
Time Management: Helps traders to manage their trading schedule by clearly marking the start and end of the Asian session.
How to Use
Apply to Chart: Save and apply the indicator to your chart to see the shaded Asian session.
This indicator is particularly useful for forex traders, stock traders, and anyone looking to incorporate the Asian market's influence into their trading strategy.

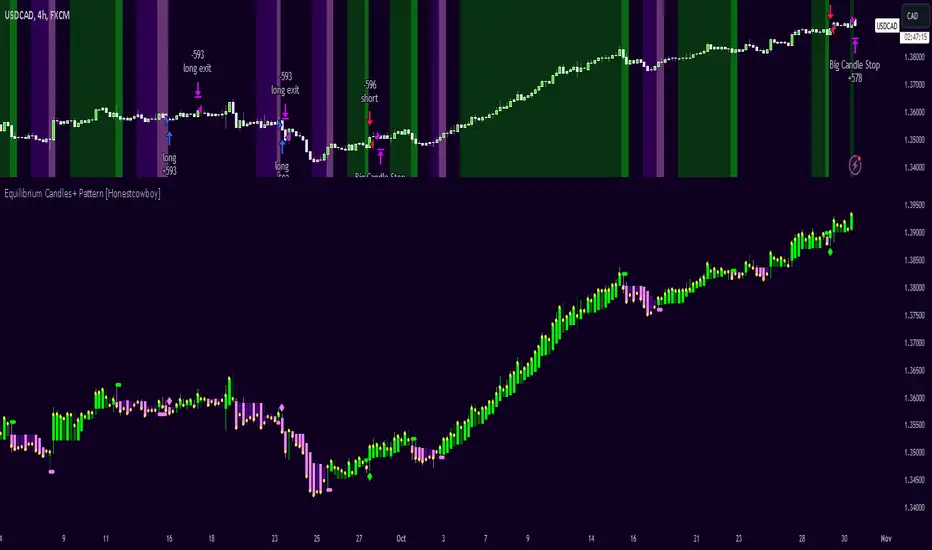
Equilibrium Candles + Pattern [Honestcowboy]The Equilibrium Candles is a very simple trend continuation or reversal strategy depending on your settings.
How an Equilibrium Candle is created:
We calculate the equilibrium by measuring the mid point between highest and lowest point over X amount of bars back.
This now is the opening price for each bar and will be considered a green bar if price closes above equilibrium.
Bars get shaded by checking if regular candle close is higher than open etc. So you still see what the normal candles are doing.
Why are they useful?
The equilibrium is calculated the same as Baseline in Ichimoku Cloud. Which provides a point where price is very likely to retrace to. This script visualises the distance between close and equilibrium using candles. To provide a clear visual of how price relates to this equilibrium point.
This also makes it more straightforward to develop strategies based on this simple concept and makes the trader purely focus on this relationship and not think of any Ichimoku Cloud theories.
Script uses a very simple pattern to enter trades:
It will count how many candles have been one directional (above or below equilibrium)
Based on user input after X candles (7 by default) script shows we are in a trend (bg colors)
On the first pullback (candle closes on other side of equilibrium) it will look to enter a trade.
Places a stop order at the high of the candle if bullish trend or reverse if bearish trend.
If based on user input after X opposite candles (2 by default) order is not filled will cancel it and look for a new trend.
Use Reverse Logic:
There is a use reverse logic in the settings which on default is turned on. It will turn long orders into short orders making the stop orders become limit orders. It will use the normal long SL as target for the short. And TP as stop for the short. This to provide a means to reverse equity curve in case your pair is mean reverting by nature instead of trending.
ATR Calculation:
Averaged ATR, which is using ta.percentile_nearest_rank of 60% of a normal ATR (14 period) over the last 200 bars. This in simple words finds a value slightly above the mean ATR value over that period.
Big Candle Exit Logic:
Using Averaged ATR the script will check if a candle closes X times that ATR from the equilibrium point. This is then considered an overextension and all trades are closed.
This is also based on user input.
Simple trade management logic:
Checks if the user has selected to use TP and SL, or/and big candle exit.
Places a TP and SL based on averaged ATR at a multiplier based on user Input.
Closes trade if there is a Big Candle Exit or an opposite direction signal from indicator.
Script can be fully automated to MT5
There are risk settings in % and symbol settings provided at the bottom of the indicator. The script will send alert to MT5 broker trying to mimic the execution that happens on tradingview. There are always delays when using a bridge to MT5 broker and there could be errors so be mindful of that. This script sends alerts in format so they can be read by tradingview.to which is a bridge between the platforms.
Use the all alert function calls feature when setting up alerts and make sure you provide the right webhook if you want to use this approach.
There is also a simple buy and sell alert feature if you don't want to fully automate but still get alerts. These are available in the dropdown when creating an alert.
Almost every setting in this indicator has a tooltip added to it. So if any setting is not clear hover over the (?) icon on the right of the setting.
The backtest uses a 4% exposure per trade and a 10 point slippage. I did not include a commission cause I'm not personaly aware what the commissions are on most forex brokers. I'm only aware of minimal slippage to use in a backtest. Trading conditions vary per broker you use so always pay close attention to trading costs on your own broker. Use a full automation at your own risk and discretion and do proper backtesting.
Economic Profit (YavuzAkbay)The Economic Profit Indicator is a Pine Script™ tool for assessing a company’s economic profit based on key financial metrics like Return on Invested Capital (ROIC) and Weighted Average Cost of Capital (WACC). This indicator is designed to give traders a more accurate understanding of risk-adjusted returns.
Features
Customizable inputs for Risk-Free Rate and Corporate Tax Rate assets for people who are trading in other countries.
Calculates Economic Profit based on ROIC and WACC, with values shown as both plots and in an on-screen table.
Provides detailed breakdowns of all key calculations, enabling deeper insights into financial performance.
How to Use
Open the stock to be analyzed. In the settings, enter the risk-free asset (usually a 10-year bond) of the country where the company to be analyzed is located. Then enter the corporate tax of the country (USCTR for the USA, DECTR for Germany). Then enter the average return of the index the stock is in. I prefer 10% (0.10) for the SP500, different rates can be entered for different indices. Finally, the beta of the stock is entered. In future versions I will automatically pull beta and index returns, but in order to publish the indicator a bit earlier, I have left it entirely up to the investor.
How to Interpret
We see 3 pieces of data on the indicator. The dark blue one is ROIC, the dark orange one is WACC and the light blue line represents the difference between WACC and ROIC.
In a scenario where both ROIC and WACC are negative, if ROIC is lower than WACC, the share is at a complete economic loss.
In a scenario where both ROIC and WACC are negative, if ROIC has started to rise above WACC and is moving towards positive, the share is still in an economic loss but tending towards profit.
A scenario where ROIC is positive and WACC is negative is the most natural scenario for a company. In this scenario, we know that the company is doing well by a gradually increasing ROIC and a stable WACC.
In addition, if the ROIC and WACC difference line goes above 0, the company is now economically in net profit. This is the best scenario for a company.
My own investment strategy as a developer of the code is to look for the moment when ROIC is greater than WACC when ROIC and WACC are negative. At that point the stock is the best time to invest.
Trading is risky, and most traders lose money. The indicators Yavuz Akbay offers are for informational and educational purposes only. All content should be considered hypothetical, selected after the facts to demonstrate my product, and not constructed as financial advice. Decisions to buy, sell, hold, or trade in securities, commodities, and other investments involve risk and are best made based on the advice of qualified financial professionals. Past performance does not guarantee future results.
This indicator is experimental and will always remain experimental. The indicator will be updated by Yavuz Akbay according to market conditions.
