Stocksgeeks MBIThis indicator displays the Stocksgeeks market breadth dashboard for NSE (India) stocks.
Market breadth provides insights into the participation of stocks in a market's movement & the conviction in the overall mood of the underlying index. Various interpretations of market breadth exist, including gauging the quantity of new highs and new lows, or the number of advancing & declining stocks, or the percentage of stocks above or below certain moving averages.
This dashboard includes the following metrics:
4R
A count or ratio of advancing & declining stocks objectively depicts their participation in an index or stock universe. A positive market breadth is said to happen when more stocks are advancing than are declining.
The 4R column is based on 4% advances & declines.
The advances are calculated as the number of stocks having a daily percentage change ≥ 4% divided by the total number of stocks having a daily percentage change < -4%.
4R is the ratio between NSE (India) stocks advancing or declining by 4% daily.
4 chg is the % change from yesterday’s 4R value to today’s 4R value.
20R
When most of the stocks are trading above a specific moving average, the market breadth is termed strong. This dashboard uses 20-day EMA for short-term timeframes.
20R is the ratio between the % of NSE (India) stocks above & below the 20-day moving average.
20 chg is the % change from yesterday’s 20R value to today’s 20R value.
50R
For medium to long-term timeframes, this dashboard uses 50-day EMA.
50R is the ratio between the % of NSE (India) stocks above & below the 50-day moving average.
50 chg is the % change from yesterday’s 50R value to today’s 50R value.
52WH &52WL
These 2 columns display the net number of stocks on NSE (India) making new 52-week highs or new 52-week lows. A market is considered strong (bullish) when new highs exceed new lows.
Interpretation
The 52 week highs must be greater than 52 weeks lows for a bullish bias.
This is how the individual columns are coded:
4R: above 200 is green, below 50 is red
20R: above 75 is green, below 50 is red
50R: above 85 is green, below 60 is red
For all the changes (4 chg, 20 chg, 50 chg): above 20 is green and below -20 is red
To decide the overall color for the day, we subtract the number of red boxes from the number of green boxes for the day. If the output is greater than equal to 3, then the day color is green, and if this is less than equal to -3 then the day color is red. In case of no consensus, the overall day color is neutral.
The color of the 20R & 50R indicates the trend (green is uptrend, & red is downtend). The color of the 4R column & the chg columns (4 chg, 20 chg, 50 chg) indicates the strength of the trend.
Features
⦿ Expanded mode : This is the default state & displays the market breadth for the past 10 days.
⦿ Mini mode : This displays only the overall color for the day.
⦿ One-day mode : Turning off both the expanded & the mini mode displays the one-day mode, which displays the market breadth columns for the current day only.
⦿ Dark mode : One-click dark mode, as usual.
Dependency
The script uses the Pine Seeds service to import custom data hosted in a GitHub repository and accesses it via TradingView as the frontend. So, the number of bars appearing on charts is fully dependent on the amount of historical data available. Any error or omission, if there, is a reflection of the hosted data, & not that of Tradingview.
Limitations
Such data has some limitations, like it can only be updated at EOD (End-of-Day), & only daily-based timeframes can be applied to such data. Irrespective of the intraday changes, only the last saved value on the chart is seen. So, it's best to use this script as EOD, rather than intraday. At the time of publication of this script, 375 days of historical data was available.
Credits
The Stocksgeeks interpretation of the market breadth is from Umang , who has graciously allowed his concepts to be coded into a script for TradingView. This script uses the NSE Market Breadth data from Chhirag_Kedia via a pine seed from EquityCraze . Hats off to these amazing individuals, without whose efforts, such scripts wouldn't have seen the light of this day!
Newhighnewlow

Breadth - New Highs & New Lows [bluesky509]Breadth - Highs & Lows Indicator
█ Description: View market highs and lows across various timeframes and exchanges.
█ Key Features:
Moving Averages: Choose from a range of MA types.
Flexible Market/Periods: Analyze different markets and different periods of NH-NL
Hi-Low Mode: Analyze high-low differences or individually
Repaint Control: Toggle between repainting and non-repainting modes to suit your strategy.
Visual Enhancements: Color-coded data visualization for easy interpretation.
█ Usage & Compliance:
Designed for educational and informational purposes, complementing your trading strategy with enhanced market insights.
█ Note:
This indicator is not intended as direct investment advice. It serves as a tool to aid in market analysis and decision-making.
█ CODE
The script is published as a protected code due to the usage of a certain style/formula. While the idea of knowledge sharing is encouraged, certain aspects of the script remain confidential.

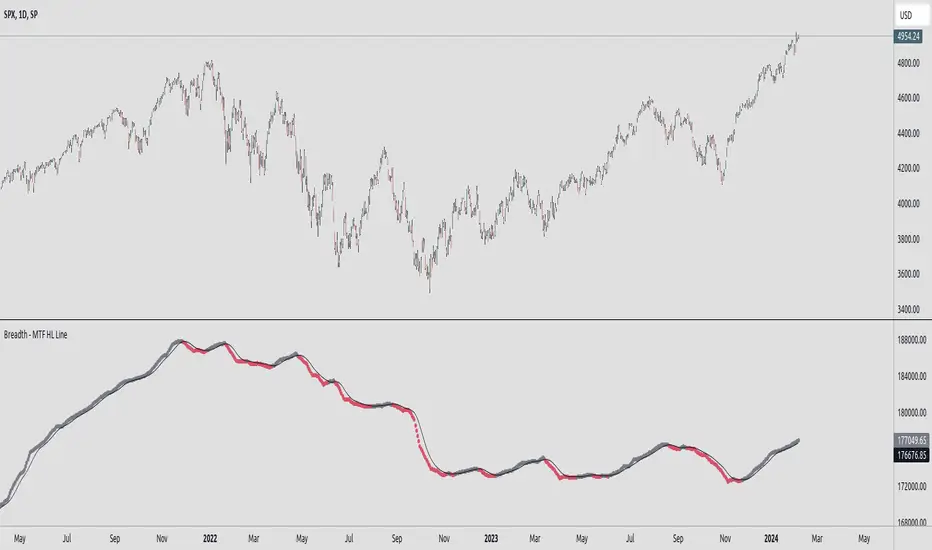
Breadth - MTF Cumulative New Highs - New LowsBreadth - MTF Cumulative New Highs - New Lows
📈 Plots cumulative 52W New Highs - New Lows with various timeframes/exchanges.
There are already similar scripts available. This just adds more exchanges and timeframe options.
Key Features :
🔄 Repaint Control: Toggle between repainting and non-repainting modes to align with your trading approach.
📊 Adjustable Timeframes: Fine-tune the timeframe multiplier to fit your analytical needs.
📉 MA Integration: Leverage a Moving Average to identify and follow trends.
🔄 Exchange Selection: Choose from a range of markets for targeted analysis.
Trading with Awareness:
This tool is designed to augment your trading strategy by offering additional insights. It's not a crystal ball for market behavior but a lens to view market dynamics more clearly.
Usage:
Primarily intended for educational and informational purposes. Not to be taken as direct investment advice.
New Highs-New-Lows on US Stock Market - Main Chart Edition#### ENGLISH ####
This script visualizes divergences between the price and new highs and new lows in the US stock market. The indicator should be used exclusively on the US stock indices (timeframe >= D).
This is the indicator for the main chart. It should be used together with the subchart indicator of the same name. In order to get the same results between the main and subchart editions, the indicator settings must be manually adjusted equally in both charts.
The approach:
Let's take a bull market as an example. A bull market is characterized by rising highs and rising lows. We can therefore assume that with the rising prices, the number of stocks that form new highs also rises or at least remains constant. This confirms the upward trend and thus expresses that it is supported by the broad stock market. If the market forms new highs and the number of stocks forming new highs decreases at the same moment, these new index highs are no longer supported by the broad stock market but exclusively by a few highly capitalized stocks. This creates a bearish divergence between the index and the NHNL indicator. This means that the uptrend tends to be overheated and a correction becomes more likely. Stops should be drawn closer.
The approach applies conversely, of course, to downtrends as well.
The indicator itself:
The number of new highs and lows (NHNL) are determined using the data sources included in Tradingview, such as "INDEX:HIGN" for NYSE highs. This data is provided on a daily basis. For higher time units (week, month) the daily numbers are shown summed up and not only the Friday value like most other NHNL indicators.
The signal strength is determined on the basis of two factors. The stronger the signal, the clearer (less transparent) the line/arrow. The two factors are on the one hand the strength of the divergence in and of itself, and on the other hand the strength of the overriding trend. The trend strength is determined using a 50 EMA on the NHNL indicator.
To avoid displaying every small divergence and to reduce false signals, the threshold for the signal strength can be set in the indicator settings.
#### GERMAN #####
Dieses script visualisiert Divergenzen zwischen dem Preis und neuer Hochs sowie neuer Tiefs im US Aktienmarkt. Der Indikator sollte ausschließlich auf den US Aktienindizes verwendet werden (Timeframe >= D).
Dies ist der Indikator für den Hauptchart. Er sollte zusammen mit dem gleichnamigen Subchart Indikator verwendet werden. Um gleiche Ergebnisse zwischen Haupt- und Subchart Edition zu erhalten, müssen die Indikatoreistellung manuell in beiden Charts gleichermaßen eigestellt werden.
Der Ansatz:
Nehmen wir uns als Beispiel einen Bullenmarkt. Ein Bullenmarkt zeichnet sich durch steigende Hochs und steigende Tiefs aus. Man kann also annehmen, dass mit den steigenden Preisen auch die Anzahl der Aktien die neuen Hochs ausbilden steigt oder zumindest konstant bleibt. Dies bestätigt den Aufwärtstrend und drückt somit aus, dass dieser vom breiten Aktienmarkt mitgetragen wird. Wenn der Markt neue Hochs bildet und die Anzahl der Aktien, die neue Hochs bilden im selben Moment sinkt, so werden diese neuen Indexhochs vom breiten Aktienmarkt nicht mehr getragen sonder ausschließlich von wenigen hochkapitalisierten Aktien. Es entsteht eine bärische Divergenz zwischen Index und dem NHNL Indikator. Das bedeutet, dass der Aufwärtstrend tendenziell überhitzt ist und ein Korrektur wahrscheinlicher wird. Die Stops sollten näher herangezogen werden.
Der Ansatz gilt umgekehrt natürlich auch bei Abwärtstrends.
Der Indikator an sich:
Die Anzahl der neuen Hochs und Tiefs (NHNL) werden anhand der in Tradingview enthaltenen Datenquellen wie z.B. "INDEX:HIGN" für die NYSE Hochs ermittelt. Diese Daten werden auf Tagesbasis bereitgestellt. Für höher Zeiteinheiten (Woche, Monat) werden die Tageszahlen aufsummiert dargestellt und nicht wie bei den meisten anderen NHNL Indikatoren nur der Freitagswert.
Die Signalstärke wird Anhand zweier Faktoren ermittelt. Je stärker das Signal um so deutlicher (weniger transparent) die Linie/der Pfeil. Die zwei Faktoren sind zum einen die stärke der Divergenz an und für sich, sowie zum anderen die Stärke des übergeordneten Trends. Die Trendstärke wird anhand eines 50er-EMA auf den NHNL-Indikator ermittelt.
Um nicht jede kleine Divergenz anzuzeigen und um Fehlsignale zu reduzieren, kann die Schwelle für die Signalstärke in den Indikatoreinstellungen festgelegt werden.
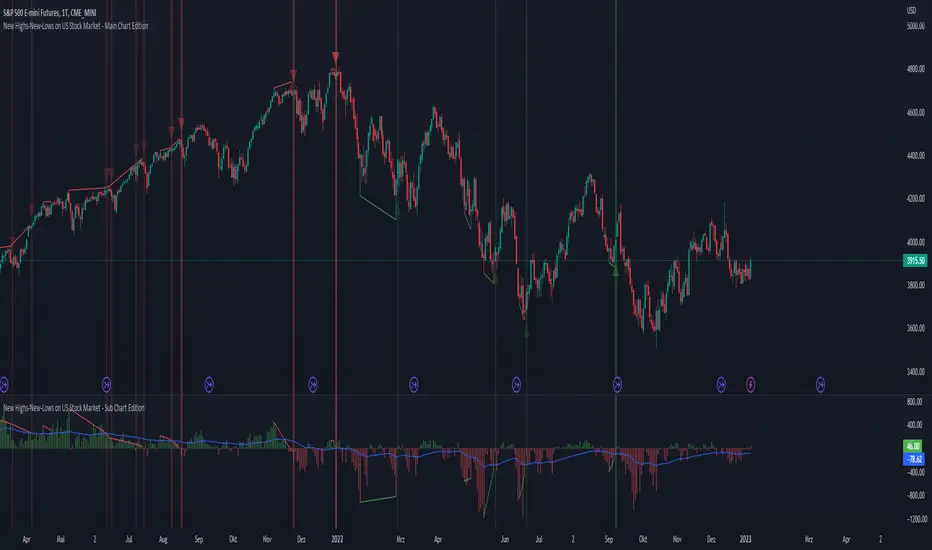
New Highs-New-Lows on US Stock Market - Sub Chart Edition#### ENGLISH ####
This script visualizes divergences between the price and new highs and new lows in the US stock market. The indicator should be used exclusively on the US stock indices (timeframe >= D).
This is the indicator for the sub chart. It should be used together with the main chart indicator of the same name. In order to get the same results between the main and subchart editions, the indicator settings must be manually adjusted equally in both charts.
The approach:
Let's take a bull market as an example. A bull market is characterized by rising highs and rising lows. We can therefore assume that with the rising prices, the number of stocks that form new highs also rises or at least remains constant. This confirms the upward trend and thus expresses that it is supported by the broad stock market. If the market forms new highs and the number of stocks forming new highs decreases at the same moment, these new index highs are no longer supported by the broad stock market but exclusively by a few highly capitalized stocks. This creates a bearish divergence between the index and the NHNL indicator. This means that the uptrend tends to be overheated and a correction becomes more likely. Stops should be drawn closer.
The approach applies conversely, of course, to downtrends as well.
The indicator itself:
The number of new highs and lows (NHNL) are determined using the data sources included in Tradingview, such as "INDEX:HIGN" for NYSE highs. This data is provided on a daily basis. For higher time units (week, month) the daily numbers are shown summed up and not only the Friday value like most other NHNL indicators.
The signal strength is determined on the basis of two factors. The stronger the signal, the clearer (less transparent) the line/arrow. The two factors are on the one hand the strength of the divergence in and of itself, and on the other hand the strength of the overriding trend. The trend strength is determined using a 50 EMA on the NHNL indicator.
To avoid displaying every small divergence and to reduce false signals, the threshold for the signal strength can be set in the indicator settings.
#### GERMAN #####
Dieses script visualisiert Divergenzen zwischen dem Preis und neuer Hochs sowie neuer Tiefs im US Aktienmarkt. Der Indikator sollte ausschließlich auf den US Aktienindizes verwendet werden (Timeframe >= D).
Dies ist der Indikator für den Subchart. Er sollte zusammen mit dem gleichnamigen Hauptchart Indikator verwendet werden. Um gleiche Ergebnisse zwischen Haupt- und Subchart Edition zu erhalten, müssen die Indikatoreistellung manuell in beiden Charts gleichermaßen eigestellt werden.
Der Ansatz:
Nehmen wir uns als Beispiel einen Bullenmarkt. Ein Bullenmarkt zeichnet sich durch steigende Hochs und steigende Tiefs aus. Man kann also annehmen, dass mit den steigenden Preisen auch die Anzahl der Aktien die neuen Hochs ausbilden steigt oder zumindest konstant bleibt. Dies bestätigt den Aufwärtstrend und drückt somit aus, dass dieser vom breiten Aktienmarkt mitgetragen wird. Wenn der Markt neue Hochs bildet und die Anzahl der Aktien, die neue Hochs bilden im selben Moment sinkt, so werden diese neuen Indexhochs vom breiten Aktienmarkt nicht mehr getragen sonder ausschließlich von wenigen hochkapitalisierten Aktien. Es entsteht eine bärische Divergenz zwischen Index und dem NHNL Indikator. Das bedeutet, dass der Aufwärtstrend tendenziell überhitzt ist und ein Korrektur wahrscheinlicher wird. Die Stops sollten näher herangezogen werden.
Der Ansatz gilt umgekehrt natürlich auch bei Abwärtstrends.
Der Indikator an sich:
Die Anzahl der neuen Hochs und Tiefs (NHNL) werden anhand der in Tradingview enthaltenen Datenquellen wie z.B. "INDEX:HIGN" für die NYSE Hochs ermittelt. Diese Daten werden auf Tagesbasis bereitgestellt. Für höher Zeiteinheiten (Woche, Monat) werden die Tageszahlen aufsummiert dargestellt und nicht wie bei den meisten anderen NHNL Indikatoren nur der Freitagswert.
Die Signalstärke wird Anhand zweier Faktoren ermittelt. Je stärker das Signal um so deutlicher (weniger transparent) die Linie/der Pfeil. Die zwei Faktoren sind zum einen die stärke der Divergenz an und für sich, sowie zum anderen die Stärke des übergeordneten Trends. Die Trendstärke wird anhand eines 50er-EMA auf den NHNL-Indikator ermittelt.
Um nicht jede kleine Divergenz anzuzeigen und um Fehlsignale zu reduzieren, kann die Schwelle für die Signalstärke in den Indikatoreinstellungen festgelegt werden.
