U.T.M.S v2🇷🇺 ОПИСАНИЕ (РУССКИЙ)
U.T.M.S v2 — Чистый EMA-кроссовер с фильтрами
Стратегия для 15м (в первую очередь) и 1ч таймфреймов.
Генерирует сигналы при пересечении EMA(8) и EMA(19) только при подтверждении тренда, объёма, волатильности и времени суток.
Каждая сделка закрывается по фиксированному Take Profit и Stop Loss.
✅ Минимум ложных входов
✅ Работает только в ликвидные часы
✅ Полная фильтрация шума и флэта
🔧 Настройки:
Fast EMA / Slow EMA — периоды скользящих (по умолчанию 8 / 19)
Take Profit % — уровень фиксации прибыли (рек. 2.5%)
Stop Loss % — уровень стоп-лосса (рек. 2.0%)
Фильтры (все включены по умолчанию):
Use 1H Trend Filter — вход разрешён только по направлению тренда на 1H (EMA50 > EMA200 для лонга)
Use Volume Filter — объём должен быть ≥ 1.5× среднего за 20 баров
Min Volume Multiplier — нижний порог объёма (рек. 1.5)
Max Volume Multiplier — верхний порог (рек. 3.0–4.0), отсекает аномальные пампы
Use ATR Volatility Filter — минимальная волатильность (рек. 0.3%)
Use Time Filter (UTC) — торговля только в часы высокой ликвидности: 12:00–18:00 и 20:00–02:00 UTC
💡 Идеальна для ручной торговли или подключения сигнальных ботов.
🇬🇧 DESCRIPTION (ENGLISH)
U.T.M.S v2 — Clean EMA Crossover with Filters
Strategy for 15m (primarily) and 1h timeframes.
Generates signals when the EMA(8) and EMA(19) cross, only if trend, volume, volatility, and time of day are confirmed.
Each trade is closed with a fixed Take Profit and Stop Loss.
✅ Low noise, high-quality signals
✅ Active only during high-liquidity hours
✅ Fully protected against flat and fakeouts
🔧 Inputs:
Fast EMA / Slow EMA — moving average periods (default: 8 / 19)
Take Profit % — profit target (suggested: 2.5%)
Stop Loss % — stop loss level (suggested: 2.0%)
Filters (all enabled by default):
Use 1H Trend Filter — trades only in 1H trend direction (EMA50 > EMA200 for long)
Use Volume Filter — volume must be ≥ 1.5× 20-bar average
Min Volume Multiplier — minimum volume threshold (suggested: 1.5)
Max Volume Multiplier — maximum volume cap (suggested: 3.0–4.0), filters out pumps/dumps
Use ATR Volatility Filter — minimum volatility (suggested: 0.3%)
Use Time Filter (UTC) — active only during high-liquidity sessions: 12:00–18:00 & 20:00–02:00 UTC
💡 Perfect for manual trading or webhook-based signal bots.
Médias Móveis

多指标量化交易DIY- The indicator includes a very large menu of leading tools, each with its own logic to determine uptrend or downtrend impulses. Highlights include:
- Range Filter: Uses a dynamic centerline and bands computed via conditional EMA/SMA and range sizing to define directional movement. It can operate in a default mode or an alternative “DW” mode.
- Rational Quadratic Kernel (RQK): Applies a kernel smoothing model (Nadaraya Watson) to detect uptrends and downtrends with a focus on noise reduction.
- Supertrend, Half Trend, SSL Channel: Classic trend-following tools that derive direction from ATR-based bands or moving average channels.
- Ichimoku Cloud and SuperIchi: Multi-component systems validating trend via cloud position, conversion/base line relationships, projected cloud, and lagging span.
- TSI (True Strength Index), DPO (Detrended Price Oscillator), AO (Awesome Oscillator), MACD, STC (Schaff Trend Cycle), QQE Mod: Momentum and cycle tools that parse direction from crossovers, zero-line behavior, and momentum shifts.
- Donchian Trend Ribbon, Chandelier Exit: Trend and exit tools that can validate breakouts or sustained trend strength.
- ADX/DMI: Measures trend strength and directional movement via +DI/-DI relationships and minimum ADX thresholds.
- RSI and Stochastic: Use crossovers, level exits, or threshold filters to gate entries based on overbought/oversold dynamics or relative strength trends.
- Vortex, Chaikin Money Flow, VWAP, Bull Bear Power, ROC, Wolfpack Id, Hull Suite: A diverse set of directional, momentum, and volume-based indicators to suit different markets and styles.
- Trendline Breakout and Range Detector: Price-behavior filters that confirm signals during breakouts or within defined ranges.
Confirmation Filters
- Each filter is optional. When enabled, it must validate the leading condition for a signal to pass. Examples:
- EMA Filter: Requires price to be above a specified EMA for longs and below for shorts, filtering signals that contradict broader trend or baseline levels.
- 2 EMA Cross and 3 EMA Cross: Enforce moving average cross conditions (fast above slow for long, the reverse for short) or a three-line stacking logic for more stringent trend alignment.
- RQK, Supertrend, Half Trend, Donchian, QQE, Hull, MACD (crossover vs. zero-line), AO (zero line or AC momentum variants), SSL: Each adds its characteristic validation pattern.
- RSI family (MA cross, exits OB/OS zones, threshold levels) plus RSI MA direction and RSI/RSI MA limits: Multiple ways to constrain signals via relative strength behavior and trajectories.
- Choppiness Index and Damiani Volatility: Prevent entries during ranging conditions or insufficient volatility; choppiness thresholds and volatility states gate the trade.
- VWAP, Volume modes (above MA, simple up/down, delta), Chaikin Money Flow: Volume and flow conditions that ensure signals happen in supportive liquidity or accumulation/distribution contexts.
- ADX/DMI thresholds: Demand a minimum trend strength and directional DI alignment to reduce whipsaw trades.
- Trendline Breakout and Range Detector: Confirm that the price is breaking structure or remains within active range consistent with the leading setup.
- By combining several filters you can create strict, conservative entries or looser setups depending on your goals.
Range Filter Engine
- A core building block, the Range Filter uses conditional EMA and SMA functions to compute adaptive bands around a dynamic centerline. It supports two types:
- Type 1: The centerline updates when price exceeds the band thresholds; bands define acceptable drift ranges.
- Type 2: Uses quantized steps (via floor operations) relative to the previous centerline to handle larger moves in discrete increments.
- The engine offers smoothing for range values using a secondary EMA and can switch between raw and averaged outputs. Its hi/lo bands and centerline compose a corridor that defines directional movement and potential breakout confirmation.
Signal Construction
- The script computes:
- leadinglongcond and leadingshortcond : The primary directional signals from the chosen leading indicator.
- longCond and shortCond : Final signals formed by combining the leading conditions with all enabled confirmations. Each confirmation contributes a boolean gate. If a filter is disabled, it contributes a neutral pass-through, keeping the logic intact without enforcing that condition.
- Expiry Logic: The code counts consecutive bars where the leading condition remains true. If confirmations do not line up within the user-defined “Signal Expiry Candle Count,” the setup is abandoned and the signal does not trigger.
- Alternation: An optional state ensures that long and short signals alternate. This can reduce repeated entries in the same direction without a clear reset.
- Finally, longCondition and shortCondition represent the actionable signals after expiry and alternation logic. These drive the label plotting and alert conditions.
Visualization
- Buy and Sell Labels: When longCondition or shortCondition confirm, the script plots annotated labels directly on the chart, making entries easy to see at a glance. The labels use color coding and clear text tags (“long” vs. “short”).
- Dashboard: A table summarizes the status of the leading indicator and all confirmations. Each row shows the indicator label and whether it passed (✔️) or failed (❌) on the current bar. This intensely practical UI helps you diagnose why a signal did or did not trigger, empowering faster strategy iteration and parameter tuning.
- Failed Confirmation Markers: If a setup expires (count exceeds the limit) and confirmations failed to align, the script can mark the chart with a small label and provide a tooltip listing which confirmations did not pass. It’s a helpful audit trail to understand missed trades or prevent “chasing” invalid signals.
- Data Window Values: The script outputs signal states to the data window, which can be useful for debugging or building composite conditions in multi-indicator templates.
Inputs and Parameters
- You control the indicator from a comprehensive input panel:
- Setup: Signal expiry count, whether to enforce alternating signals, and whether to display labels and the dashboard (including position and size).
- Leading Indicator: Choose the primary signal generator from the large list.
- Per-Filter Toggles: For each confirmation, a respect... toggle enables or disables it. Many include sub-options (like MACD type, Stochastic mode, RSI mode, ADX variants, thresholds for choppiness/volatility, etc.) to fine-tune behavior.
- Range Filter Settings: Choose type and behavior; select default vs. DW mode and smoothing. The underlying functions adjust band sizes using ATR, average change, standard deviation, or user-defined scales.
- Because everything is customizable, you can adapt the indicator to different assets, volatility regimes, and timeframes.
Alerts and Automation
- The script defines alert conditions tied to longCondition and shortCondition . You can set these alerts in your chart to trigger notifications or webhook calls for automated execution in external bots. The alert text is simple, and you can configure your own message template when creating alerts in the chart, including JSON payloads for algorithmic integration.
Typical Workflow
- Select a Leading Indicator aligned with your style. For trend following, Supertrend or SSL may be appropriate; for momentum, MACD or TSI; for range/trend-change detection, Range Filter, RQK, or Donchian.
- Add a few key Confirmation Filters that complement the leading signal. For example:
- Pair Supertrend with EMA Filter and RSI MA Direction to ensure trend alignment and positive momentum.
- Combine MACD Crossover with ADX/DMI and Volume Above MA to avoid signals in low-trend or low-liquidity conditions.
- Use RQK with Choppiness Index and Damiani Volatility to only act when the market is trending and volatile enough.
- Set a sensible Signal Expiry Candle Count. Shorter expiry keeps entries timely and reduces lag; longer expiry captures setups that mature slowly.
- Observe the Dashboard during live markets to see which filters pass or fail, then iterate. Tighten or loosen thresholds and filter combinations as needed.
- For automation, turn on alerts for the final conditions and use webhook payloads to notify your trading robot.
Strengths and Practical Notes
- Flexibility: The indicator is a toolkit rather than a single rigid model. It lets you test different combinations rapidly and visualize outcomes immediately.
- Clarity: Labels, dashboard, and failed-confirmation markers make it easy to audit behavior and refine settings without digging into code.
- Robustness: The expiry and alternation options add discipline, avoiding the temptation to enter late or repeatedly in one direction without a reset.
- Modular Design: The logical gates (“respect…”) make the behavior transparent: if a filter is on, it must pass; if it’s off, the signal ignores it. This keeps reasoning clean.
- Avoiding Overfitting: Because you can stack many filters, it’s tempting to over-constrain signals. Start simple (one leading indicator and one or two confirmations). Add complexity only if it demonstrably improves your edge across varied market regimes.
Limitations and Recommendations
- No single configuration is universally optimal. Markets change; tune filters for the instrument and timeframe you trade and revisit settings periodically.
- Trend filters can underperform in choppy markets; likewise, momentum filters can false-trigger in quiet periods. Consider using Choppiness Index or Damiani to gate signals by regime.
- Use expiry wisely. Too short may miss good setups that need a few bars to confirm; too long may cause late entries. Balance responsiveness and accuracy.
- Always consider risk management externally (position sizing, stops, profit targets). The indicator focuses on signal quality; combining it with robust trade management methods will improve results.
Example Configurations
- Trend-Following Setup:
- Leading: Supertrend uptrend for longs and downtrend for shorts.
- Confirmations: EMA Filter (price above 200 EMA for long, below for short), ADX/DMI (trend strength above threshold with +DI/-DI alignment), Volume Above MA.
- Expiry: 3–4 bars to keep entries timely.
- Result: Strong bias toward sustained moves while avoiding weak trends and thin liquidity.
- Mean-Reversion to Momentum Crossover:
- Leading: RSI exits from OB/OS zones (e.g., RSI leaves oversold for long and leaves overbought for short).
- Confirmations: 2 EMA Cross (fast crossing slow in the same direction), MACD zero-line behavior for added momentum validation.
- Expiry: 2–3 bars for responsive re-entry.
- Result: Captures momentum transitions after short-term extremes, with extra confirmation to reduce head-fakes.
- Range Breakout Focus:
- Leading: Range Filter Type 2 or Donchian Trend Ribbon to detect breakouts.
- Confirmations: Damiani Volatility (avoid low-volatility false breaks), Choppiness Index (prefer trend-ready states), ROC positive/negative threshold.
- Expiry: 1–3 bars to act on breakout windows.
- Result: Better alignment to breakout dynamics, gating trades by volatility and regime.
Conclusion
- This indicator is a comprehensive, configurable framework that merges a chosen leading signal with an array of corroborating filters, disciplined expiry handling, and intuitive visualization. It’s designed to help you build high-quality entry signals tailored to your approach, whether that’s trend-following, breakout trading, momentum capturing, or a hybrid. By surfacing pass/fail states in a dashboard and allowing alert-based automation, it bridges the gap between discretionary analysis and systematic execution. With sensible parameter tuning and thoughtful filter selection, it can serve as a robust backbone for signal generation across diverse instruments and timeframes.

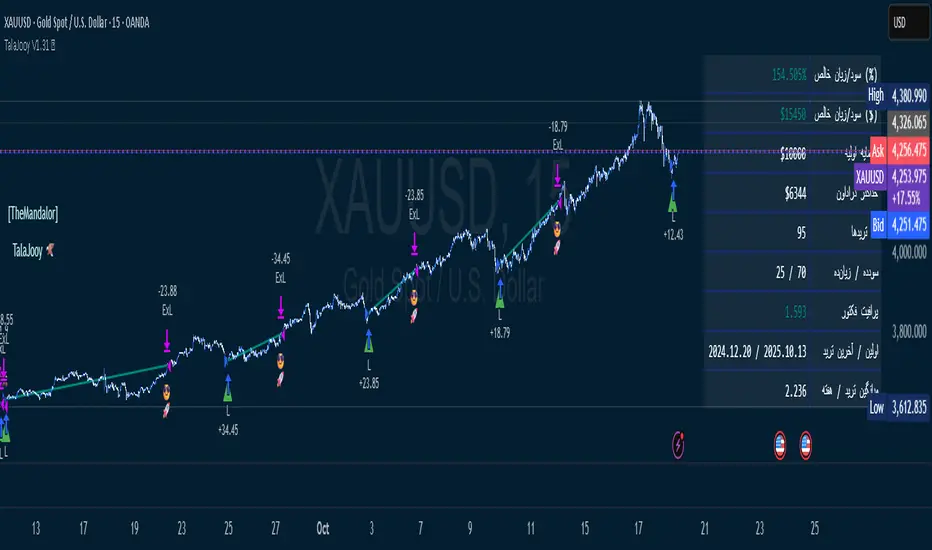
TalaJooy V1.31 𓅂💎 استراتژی معاملاتی TalaJooy V1.31 𓅂
TalaJooy (طلاجوی) یک چارچوب معاملاتی حرفهای و کامل برای TradingView است که برای حذف حدس و گمان، احساسات و تصمیمگیریهای هیجانی از فرآیند معاملات طراحی شده است.
این محصول یک «اندیکاتور سیگنالدهی» ساده نیست؛ بلکه یک استراتژی (Strategy) کامل است که چهار وظیفه کلیدی را به صورت خودکار انجام میدهد:
تحلیل بازار (بر اساس یک موتور امتیازدهی کمی)
صدور سیگنال (ورود و خروج شفاف)
مدیریت ریسک پویا (محاسبه خودکار حد ضرر)
مدیریت حجم پوزیشن (محاسبه خودکار حجم بر اساس ریسک)
هدف «طلاجوی» تبدیل معاملهگری شهودی به یک فرآیند مکانیکی، مبتنی بر داده و مدیریت ریسک است.
⚙️ قابلیتهای کلیدی (آنچه دریافت میکنید)
این استراتژی مجهز به مجموعهای از ابزارهای حرفهای است که مستقیماً روی چارت شما اجرا میشوند:
🎯 ۱. سیگنالهای ورود و خروج شفاف
فلشهای واضح خرید (▲) و فروش (▼) که نقاط دقیق ورود بر اساس منطق استراتژی را مشخص میکنند. این سیستم تنها زمانی سیگنال صادر میکند که فیلترهای روند، همسویی لازم را تایید کنند.
🛡️ ۲. مدیریت ریسک پویای ATR
بزرگترین چالش معاملهگران، تعیین حد ضرر (SL) مناسب است. این استراتژی حد ضرر را به صورت خودکار و پویا بر اساس نوسانات واقعی بازار (با استفاده از ATR) محاسبه میکند.
نتیجه: در بازارهای پرنوسان، استاپ شما برای جلوگیری از استاپهانت شدن، فاصله ایمنتری میگیرد و در بازارهای آرام، بهینهتر و نزدیکتر تنظیم میشود.
💰 ۳. محاسبه خودکار حجم پوزیشن
دیگر نیازی به «ماشین حساب پوزیشن» ندارید. استراتژی به صورت اتوماتیک، حجم دقیق هر معامله را بر اساس درصد ریسک ثابتی که شما از کل سرمایهتان تعیین میکنید، محاسبه مینماید. این ویژگی، مدیریت سرمایه حرفهای را در تمام معاملات شما تضمین میکند.
🎨 ۴. نواحی بصری سود و زیان (TP/SL)
هنگامی که یک معامله باز است، این ابزار به صورت زنده، نواحی حد سود (سبز) و حد ضرر (قرمز) را مشابه ابزار پوزیشن خود تریدینگ ویو، مستقیماً روی چارت برای شما رسم میکند.
📈 ۵. پنل آمار عملکرد پیشرفته
یک جدول آماری جامع که تمام معیارهای کلیدی عملکرد شما را به صورت زنده نمایش میدهد:
سود و زیان خالص (دلاری و درصدی)
ضریب سود (Profit Factor)
نرخ موفقیت (Win Rate)
تعداد معاملات سودده / زیانده
حداکثر افت سرمایه (Max Drawdown)
و موارد دیگر...
🚦 ۶. آیکونهای بازخورد معامله
با آیکونهای هوشمند، فوراً کیفیت معاملات بسته شده خود را ارزیابی کنید:
😎🚀 (سود ویژه و قابل توجه)
💰 (سود عادی)
🙈 (زیان)
📈 چگونه از این ابزار استفاده کنید؟
«طلاجوی» یک 'ماشین چاپ پول' جادویی نیست، بلکه یک ابزار تست و اجرای حرفهای است.
۱. بکتست و بهینهسازی (Backtesting)
مهمترین قدرت این اسکریپت، قابلیت Strategy بودن آن است. شما میتوانید این استراتژی را روی هر جفتارز و تایم فریمی که معامله میکنید (طلا، کریپتو، جفتارزها و...) بکتست بگیرید تا آمار عملکرد آن را مشاهده کنید.
۲. تنظیم پارامترها
از طریق منوی تنظیمات، پارامترهای کلیدی مانند درصد ریسک، نسبت ریسک به ریوارد (R:R)، و فیلترهای زمانی را مطابق با سبک معاملاتی و دارایی مورد نظر خود بهینهسازی کنید.
۳. اجرای سیستماتیک
پس از یافتن تنظیمات بهینه در بکتست، در معاملات زنده به سیگنالها پایبند بمانید و اجازه دهید منطق مکانیکی، معاملات شما را مدیریت کند.
⚠️ سلب مسئولیت مهم (مطابق با قوانین TradingView)
این اسکریپت صرفاً یک ابزار تحلیلی و معاملاتی است و نباید به عنوان سیگنال مالی یا توصیهای برای خرید و فروش تلقی شود. تمام معاملات دارای ریسک هستند و نتایج گذشته تضمینکننده عملکرد آینده نمیباشد.
لطفاً قبل از استفاده از این استراتژی در حساب واقعی، آن را به طور کامل در حالت دمو یا بکتست ارزیابی کنید. مسئولیت تمامی سودها و زیانها بر عهده خود معاملهگر است.
💎 TalaJooy V1.31 𓅂 Trading Strategy
TalaJooy (meaning "Gold Seeker") is a complete, professional trading framework for TradingView, designed to remove guesswork, emotion, and impulsive decisions from your trading process.
This is not a simple signal indicator; it is a complete Strategy script that automates four key tasks:
Market Analysis (Based on a quantitative scoring engine)
Signal Generation (Clear entries and exits)
Dynamic Risk Management (Automated Stop Loss calculation)
Position Sizing (Automated trade sizing based on risk)
The goal of "TalaJooy" is to transform intuitive trading into a mechanical, data-driven, and risk-managed process.
⚙️ Key Features (What You Get)
This strategy comes equipped with a suite of professional tools that run directly on your chart:
🎯 1. Clear Entry & Exit Signals
Receive unambiguous Buy (▲) and Sell (▼) arrows identifying precise entry points based on the strategy's logic. The system only generates signals when its trend-confirmation filters are aligned.
🛡️ 2. Dynamic ATR Risk Management
A trader's biggest challenge is setting a proper Stop Loss (SL). This strategy calculates your SL automatically and dynamically based on real-time market volatility (using ATR).
The Benefit: In volatile markets, your stop is placed at a safer distance to avoid being "stopped out" by noise. In calm markets, it's set tighter and more efficiently.
💰 3. Automated Position Sizing
Stop using external "position size calculators." The strategy automatically calculates the exact trade size for every position based on a fixed risk percentage of your total equity (which you define). This enforces professional money management on every trade.
🎨 4. Visual Profit & Loss (TP/SL) Zones
While a trade is active, this tool plots live, visual zones for your Take Profit (green) and Stop Loss (red) targets, similar to TradingView's native "Long/Short Position" tool.
📈 5. Advanced Performance Stats Panel
A comprehensive statistics table displays all your key performance metrics in real-time:
Net Profit (% and $)
Profit Factor
Win Rate
Win / Loss Trade Count
Max Drawdown
And more...
🚦 6. Smart Trade Feedback Icons
Instantly review the quality of your closed trades with intelligent emoji feedback:
😎🚀 (Exceptional Profit)
💰 (Standard Profit)
🙈 (Loss)
📈 How to Use This Tool
"TalaJooy" is not a "magic money machine"; it is a professional-grade tool for testing and execution.
1. Backtesting & Optimization
The most powerful feature of this script is its Strategy component. You can backtest it on any asset or timeframe you trade (Gold, Crypto, Forex, etc.) to see its historical performance data.
2. Parameter Tuning
Use the settings menu to optimize key parameters—such as Risk Percentage, Risk:Reward Ratio, and core filter settings—to match your personal trading style and preferred assets.
3. Systematic Execution
After identifying optimal settings via backtesting, adhere to the signals in your live trading and let the mechanical logic manage your trades.
⚠️ Important Disclaimer (TradingView Compliant)
This script is provided for educational and analytical purposes only. It is not financial advice or a recommendation to buy or sell any asset. All trading involves substantial risk. Past performance is not indicative of future results.
Please thoroughly evaluate this strategy via backtesting or paper trading before deploying it with real funds. The user assumes full responsibility for all profits and losses incurred.
USDJPY MA Zone Entry Strategy USD/JPY tested only.A consistent strategy that gives me alerts each time my conditions are met. I am a funded prop firm trader. this strategy gives 45-70% annual returns. the sequence for this strategy is: After 4 stop loss hits, place a trade on the NEXT ENTRY ALERT ONCE: (-.188) pips draw back towards the stop loss. (this turns the Strat from 1-3 RISK/REWARD to 1-7+ RISK/REWARD). keep the Stop Loss the same (-.300) away from your entry. Take Profit placed at (+1.488) from entry. if 3 losses in a row happens AFTER you've followed these instructions, don't trade again UNTIL the strategy has a TAKE PROFIT gain, then the sequence starts over again. that is this strategies losing streak. after that streak is over. the strategy will be back to give you profits.

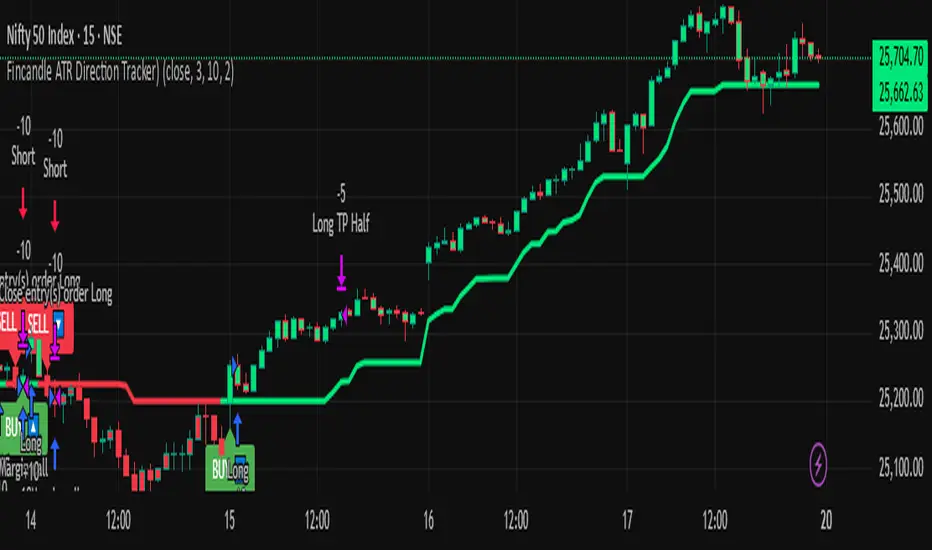
Fincandle ATR Direction TrackerOverview
The Fincandle ATR Direction Tracker is a strategy designed to capture momentum moves in the market using a dynamic ATR-based trailing stop. It identifies strong momentum candles and filters signals using trend alignment with moving averages.
Partial exits allow users to take a portion of profit at a predefined ATR multiple while keeping the remaining position open until the opposite signal occurs.
How It Works
Momentum Detection:
Measures candle body size relative to the Average True Range (ATR).
A candle is considered momentum if its body size exceeds ATR × Multiplier.
Trend Filter:
Uses two moving averages (Fast MA and Slow MA) to determine the market trend.
Bullish trend: Fast MA > Slow MA → long trades allowed
Bearish trend: Fast MA < Slow MA → short trades allowed
Trend filter can be toggled on or off.
ATR Trailing Stop:
A dynamic trailing stop adapts to price volatility.
Crossing above the trail triggers a buy signal, crossing below triggers a sell signal.
Partial Exit / Take Profit:
Step 1: Exit 50% of the position when price moves a configurable multiple of ATR in your favor.
Step 2: Close the remaining position when the opposite signal occurs (e.g., price crosses below/above the ATR trail).
How to Use
Add the strategy to any chart (stocks, indices, forex, crypto).
Configure ATR period, sensitivity, take profit multiple, and moving average lengths to suit the timeframe and asset.
Monitor buy/sell markers and dynamic ATR trail on the chart.
Optional: Set alerts for real-time notifications when signals trigger.
Adjust partial exit multiplier to control risk/reward.
Example Settings
ATR Period: 10
ATR Sensitivity: 3 × ATR
Take Profit: 2 × ATR
Fast MA: 50
Slow MA: 200
Partial Exit: 50% of position at take profit, remaining exits on opposite signal
Key Features
Adaptive ATR trailing stop for volatility-based entries/exits.
Trend alignment filter with Fast/Slow MA.
Partial exit logic for better risk management.
Visual BUY/SELL markers and alerts.
Fully Pine Script v6 compatible.
Disclaimer
This strategy is for educational and analytical purposes only.
It does not guarantee profits. Traders should always use proper risk management.

Turtle Strategy - Triple EMA Trend with ADX and ATRDescription
The Triple EMA Trend strategy is a directional momentum system built on the alignment of three exponential moving averages and a strong ADX confirmation filter. It is designed to capture established trends while maintaining disciplined risk management through ATR-based stops and targets.
Core Logic
The system activates only under high-trend conditions, defined by the Average Directional Index (ADX) exceeding a configurable threshold (default: 43).
A bullish setup occurs when the short-term EMA is above the mid-term EMA, which in turn is above the long-term EMA, and price trades above the fastest EMA.
A bearish setup is the mirror condition.
Execution Rules
Entry:
• Long when ADX confirms trend strength and EMA alignment is bullish.
• Short when ADX confirms trend strength and EMA alignment is bearish.
Exit:
• Stop Loss: 1.8 × ATR below (for longs) or above (for shorts) the entry price.
• Take Profit: 3.3 × ATR in the direction of the trade.
Both parameters are configurable.
Additional Features
• Start/end date inputs for controlled backtesting.
• Selective activation of long or short trades.
• Built-in commission and position sizing (percent of equity).
• Full visual representation of EMAs, ADX, stop-loss, and target levels.
This strategy emphasizes clean trend participation, strict entry qualification, and consistent reward-to-risk structure. Ideal for swing or medium-term testing across trending assets.

SPY200SMA (+4%/-3%) TQQQ/QQQ STRATEGYSummary of the Improved Strategy: When the price of AMEX:SPY is +4% above the 200SMA BUY NASDAQ:TQQQ and when the price of SPY drops to -3% under the SPY 200SMA SELL everything and slowly DCA into NASDAQ:QQQ over the next 6-12 months or until price returns to +4% above the SPY 200SMA at which point you will go back into 100% TQQQ.
Note: (if the price of QQQ goes 30% above the 200SMA of QQQ deleverage to QQQ or Sell to protect yourself from dot com level event)
More info and stats -https://www.reddit.com/r/LETFs/comments/1nhye66/spy_200sma_43_tqqqqqq_long_term_investment/

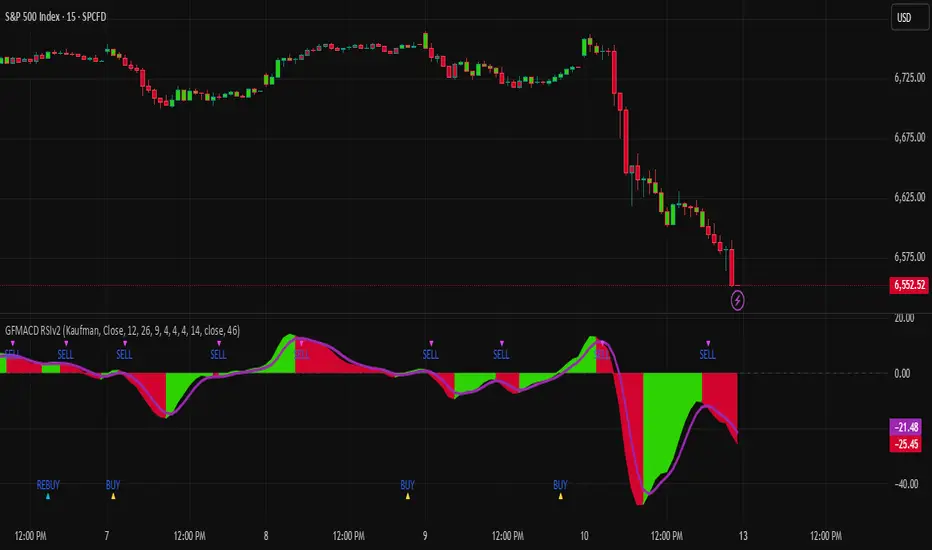
Gaussian MACD RSI v2Gaussian Filter MACD Strategy (Zero Cross + RSI Gate)
What it does
This strategy evaluates momentum using a Gaussian-smoothed MACD and requires a MACD zero-line cross to confirm trend initiation. A configurable RSI threshold filters weak signals, aiming to reduce whipsaws around the zero line. Entries occur only when momentum and baseline strength agree; exits are triggered by MACD crossing below its signal to capture the meat of the move while avoiding discretionary overrides.
How it works (concepts, not code)
Gaussian MACD: The fast/slow components are smoothed with a Gaussian-style filter to reduce noise relative to standard EMA MACD.
Zero-line confirmation: Longs require MACD to cross above zero, aligning entries with positive momentum regimes.
RSI gate: A threshold (default 50) further filters entries so that only setups with baseline strength qualify.
Exit logic: Positions close when MACD crosses below its signal line, providing an objective exit without trailing logic.
Sources: The script supports standard and Heikin-Ashi-derived sources for traders who prefer alternate preprocessing.
How to use it
Add the strategy to a clean chart.
Keep default settings for initial testing; then adjust the RSI threshold and symbol/timeframe for your market.
Favor liquid instruments where slippage and fills are reliable.
Forward-test and walk-forward before any live use.
Default Properties (used for this publication)
Initial Capital: $25,000
Order Size: 100% of equity per trade (no leverage).
Commission: 0.02% per side.
Slippage: 2 ticks (or 0.02% on percent-based markets).
Timeframe used for the published chart: 15-minute (example)
Dataset: SPY/QQQ/large-cap equities (2+ years) producing 100+ trades in sample.
Note: This strategy does not use hard stops by default. If you prefer risk caps ≤ 5–10% per trade, add a stop in the Inputs and re-publish; otherwise, this description explains the deviation per House Rules.
Disclosures
Backtest results are estimates; real-world fills, slippage, and availability may differ. No guarantee of performance. Use prudent position sizing and independent verification.
Ekoparaloji Cyrpto StrategyEkoparaloji Crypto Strategy - User Information Document
📊 Strategy Overview
This strategy provides long-term position management in cryptocurrency markets using the averaging down (pyramiding) technique. The basic logic is to controllably grow positions as prices decline and exit when specific profit targets are reached.
🎯 Key Features
✅ Automatic Entry System
Market direction is determined using a proprietary trend identification algorithm
Trades are only opened in uptrends
Initial position opens automatically when specific conditions are met
📈 Pyramiding Mechanism
New positions are automatically added as price decreases
Up to 10 positions can be added maximum
Each addition occurs at predetermined decline levels
Risk management through dynamic position sizing
💰 Profit and Loss Management
Take Profit: All positions close when the specified percentage above average cost is reached
Stop Loss (Optional): Protects a specified percentage of total capital
A certain ratio of available capital is used in each trade
📊 Visual Tracking System
The following information is displayed in real-time on the chart:
✅ Average cost level
✅ Profit target level
✅ Stop loss level (if active)
✅ Next pyramiding level
✅ Liquidation (capital reset) level
✅ Trend indicator
🛡️ Risk Management Features
1. Dynamic Capital Protection
Automatic exit when losses exceed a specified percentage of total capital
Complete loss scenario can be previewed through liquidation level calculation
2. Position Control System
Protection preventing multiple trades on the same bar
Double trigger prevention mechanism
Maximum position limit
3. Time Filter
Optional trading within a date range
Ideal for testing on historical data
📱 Information Panel
Information table always visible in the upper right corner of the strategy:
When Position is Open:
Number of active positions
Average cost
Current price
Total capital status
Capital loss percentage
Profit target
Stop loss level and distance
Next entry level
Liquidation level and distance
When No Position:
Market trend (Uptrend/Downtrend)
Ready to trade?
Reason for waiting
Initial position size
Target profit percentage
⚙️ Adjustable Parameters
Customizable by user:
💵 Capital Amount: Base amount to be used for each position
📊 Profit Target: Profit percentage at which to exit
🛑 Stop Loss: Usage status and maximum loss percentage
📅 Time Filter: Start and end dates for testing
💬 Trade Comments: Custom labels for each trade
📘 Understanding Leverage Effect
1. What is the Leverage Effect?
Although there's no real leverage in the spot market, when Capital Amount is increased, capital usage works like leverage:
Capital Amount 5% (1.0x): 100% capital usage with full pyramiding = All your money in trades
Capital Amount 10% (2.0x): 200% capital usage with full pyramiding = Attempting to open trades worth 2x your capital
Capital Amount 15% (3.0x): 300% capital usage with full pyramiding = Attempting to open trades worth 3x your capital
⚠️ IMPORTANT: If your capital runs out in the spot market, you cannot open new positions, therefore it's recommended to keep Capital Amount at 5% or below!
⚠️ Important Warnings
Pyramiding Risk: If price continues to decline, position grows and risk increases
Capital Requirements: Up to 10 positions can be added, requiring sufficient capital
Trend Dependency: Only works in uptrends
Backtest Results: Past performance is not a guarantee of future results
Real Trading Risks: Slippage, commissions, and market conditions can affect results
🎓 How to Use
Add the strategy to your chart
Adjust parameters according to your risk appetite
Examine past performance by backtesting
Optionally set up alerts to activate notifications
Test with paper trading first
This strategy is for educational purposes. Do your own research and only trade with capital you can afford to lose.
Disclaimer: This strategy is not financial advice. All investment decisions are the user's responsibility.
Happy trading! 📊

Ekoparaloji Strategy Crypto Ekoparaloji Crypto Strategy - User Information Document
📊 Strategy Overview
This strategy provides long-term position management in cryptocurrency markets using the averaging down (pyramiding) technique. The basic logic is to controllably grow positions as prices decline and exit when specific profit targets are reached.
🎯 Key Features
✅ Automatic Entry System
Market direction is determined using a proprietary trend identification algorithm
Trades are only opened in uptrends
Initial position opens automatically when specific conditions are met
📈 Pyramiding Mechanism
New positions are automatically added as price decreases
Up to 10 positions can be added maximum
Each addition occurs at predetermined decline levels
Risk management through dynamic position sizing
💰 Profit and Loss Management
Take Profit: All positions close when the specified percentage above average cost is reached
Stop Loss (Optional): Protects a specified percentage of total capital
A certain ratio of available capital is used in each trade
📊 Visual Tracking System
The following information is displayed in real-time on the chart:
✅ Average cost level
✅ Profit target level
✅ Stop loss level (if active)
✅ Next pyramiding level
✅ Liquidation (capital reset) level
✅ Trend indicator
🛡️ Risk Management Features
1. Dynamic Capital Protection
Automatic exit when losses exceed a specified percentage of total capital
Complete loss scenario can be previewed through liquidation level calculation
2. Position Control System
Protection preventing multiple trades on the same bar
Double trigger prevention mechanism
Maximum position limit
3. Time Filter
Optional trading within a date range
Ideal for testing on historical data
📱 Information Panel
Information table always visible in the upper right corner of the strategy:
When Position is Open:
Number of active positions
Average cost
Current price
Total capital status
Capital loss percentage
Profit target
Stop loss level and distance
Next entry level
Liquidation level and distance
When No Position:
Market trend (Uptrend/Downtrend)
Ready to trade?
Reason for waiting
Initial position size
Target profit percentage
⚙️ Adjustable Parameters
Customizable by user:
💵 Capital Amount: Base amount to be used for each position
📊 Profit Target: Profit percentage at which to exit
🛑 Stop Loss: Usage status and maximum loss percentage
📅 Time Filter: Start and end dates for testing
💬 Trade Comments: Custom labels for each trade
📘 Understanding Leverage Effect
1. What is the Leverage Effect?
Although there's no real leverage in the spot market, when Capital Amount is increased, capital usage works like leverage:
Capital Amount 5% (1.0x): 100% capital usage with full pyramiding = All your money in trades
Capital Amount 10% (2.0x): 200% capital usage with full pyramiding = Attempting to open trades worth 2x your capital
Capital Amount 15% (3.0x): 300% capital usage with full pyramiding = Attempting to open trades worth 3x your capital
⚠️ IMPORTANT: If your capital runs out in the spot market, you cannot open new positions, therefore it's recommended to keep Capital Amount at 5% or below!
⚠️ Important Warnings
Pyramiding Risk: If price continues to decline, position grows and risk increases
Capital Requirements: Up to 10 positions can be added, requiring sufficient capital
Trend Dependency: Only works in uptrends
Backtest Results: Past performance is not a guarantee of future results
Real Trading Risks: Slippage, commissions, and market conditions can affect results
🎓 How to Use
Add the strategy to your chart
Adjust parameters according to your risk appetite
Examine past performance by backtesting
Optionally set up alerts to activate notifications
Test with paper trading first
This strategy is for educational purposes. Do your own research and only trade with capital you can afford to lose.
Disclaimer: This strategy is not financial advice. All investment decisions are the user's responsibility.

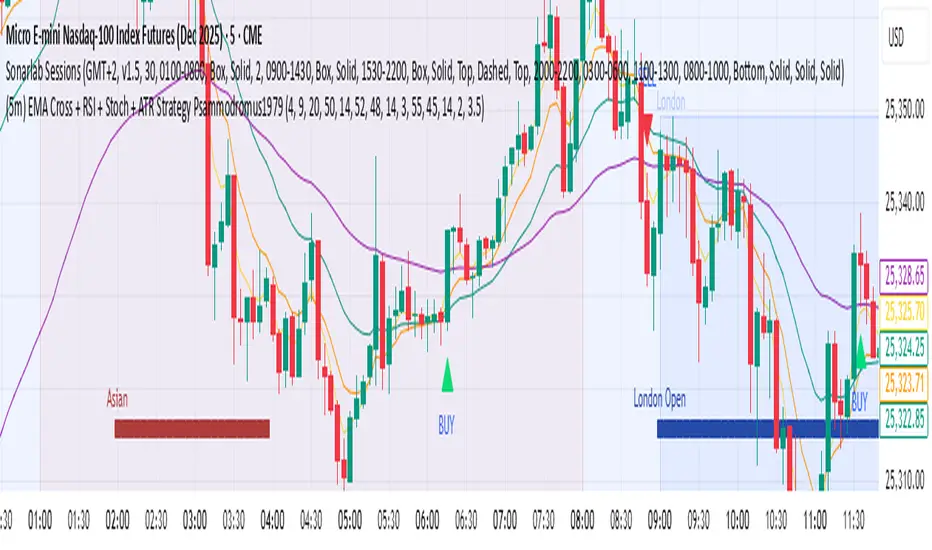
(5m) EMA Cross + RSI + Stoch + ATR Strategy Psammodromus1979Indicators
EMA4
EMA9
EMA20
EMA50
RSI
STOCHASTIC
ATR
With buy/sell indicators directly on main chart
It worked for me when waited for retracement on EMA50
Didn't work when on accumulation.
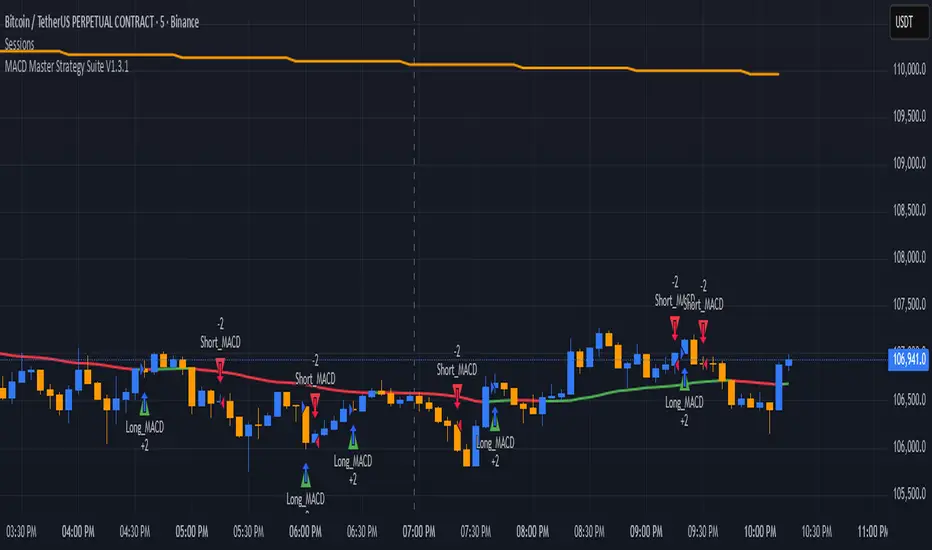
MACD Master Strategy Suite🧩 Overview
The MACD Master Strategy Suite is not a basic MACD crossover system, but a complete backtesting tool designed for traders who want to explore and optimize MACD-based logic.
This suite offers a host of configurable options that transform the standard MACD into a powerful research framework. You can test multiple entry styles, apply trend filters, run contrarian setups, and study seasonality — all from one script.
⚙️ Key Features
Multiple MACD entry modes: classic cross, zero-line flip, pullback, momentum burst, divergence, and more.
Dual-EMA trend filter with optional Contrarian Mode.
Higher-timeframe trend confirmation.
Calendar filters for weekday, month, and day-of-month testing.
Realistic trade management: stop/target exits, cooldowns, and same-bar recalculation guard.
Adjustable position sizing and leverage for accurate SPY-style backtests.
🧠 How It Differs From TradingView’s Built-In MACD Strategy
The built-in MACD strategy uses only histogram zero-cross entries with no filters or risk controls.
The MACD Master Strategy Suite expands this into a fully modular testing environment, allowing you to analyze how different MACD behaviors perform under diverse market conditions — turning MACD from a simple signal into a measurable system.
⚖️ Disclaimer
For research and educational use only. This script does not constitute financial advice or guarantee performance.
Quanta - Free Beginner Strategysimple strategy for indian indices. it uses moving averages only to identify trend biase and generated signal based on that.

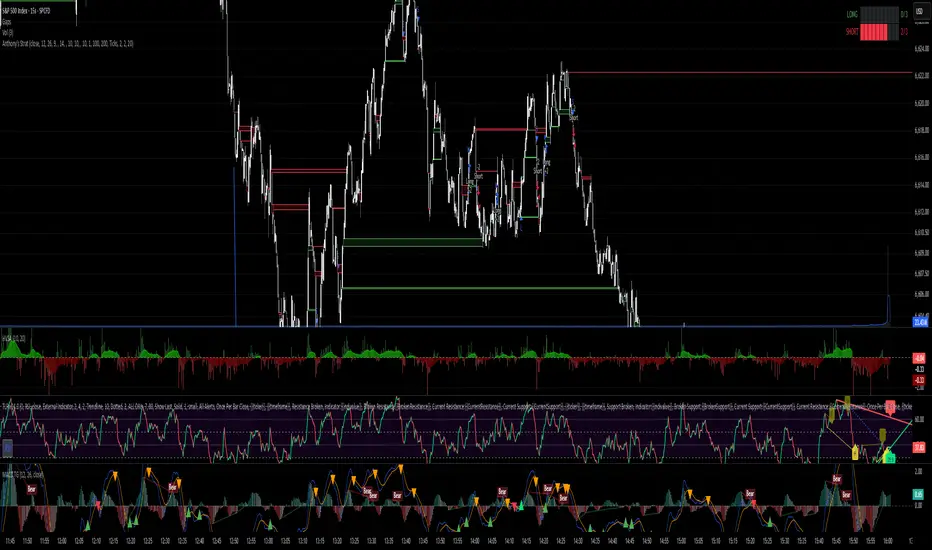
Anthony's trading strategyWait for signal to print and a continuation candle to enter trade. If no continuation candle, disregard signal.
Tight Entry Trend Engine Strategy═══════════════════════════════════════
TIGHT ENTRY TREND ENGINE
═══════════════════════════════════════
A breakout-based trend-following system designed to capture explosive
moves by entering at precise resistance/support breakouts with minimal
entry risk and massive profit potential.
⚠️ LOW WIN RATE, HIGH REWARD SYSTEM ⚠️
This is NOT a high win-rate strategy. Expect 25-35% winners, but
when it hits, winners are typically 10X+ larger than losers.
═══════════════════════════════════════
🎯 WHAT THIS SYSTEM DOES
═══════════════════════════════════════
The Tight Entry Trend Engine identifies powerful breakout opportunities
by detecting when price breaks through established trendlines with
confirmation from higher timeframe trends:
1. DYNAMIC TRENDLINE DETECTION (3 BANKS)
• Automatically draws support and resistance trendlines
• 3 separate "banks" capture short-term, medium-term, and long-term levels
• Each bank has configurable parameters (required pivot touch count,
angle limits, lengths)
2. BREAKOUT ENTRY TIMING
• Enters LONG when price breaks ABOVE resistance trendlines
• Enters SHORT when price breaks BELOW support trendlines
• Entry Alert occurs at the exact moment of breakout = "tight entry"
• Stop-loss placed just below/above the broken trendline (configurable)
3. HIGHER TIMEFRAME TREND FILTER
• Uses Hull Moving Average (HMA) on higher timeframe for trend following
• Auto-adjusts HTF based on your chart timeframe
• Optional filters prevent entries against major trend
• Optional "overextension" filter avoids buying parabolic moves
4. VOLATILITY-ADAPTIVE RISK MANAGEMENT
• Stop-loss calculated using Average True Range (ATR)
• Tighter stops = better R:R
• Profit targets adjust dynamically with volatility
• Breakeven stop moves automatically when in profit
• Extended profit targets when far from HTF trend
═══════════════════════════════════════
📊 HOW IT WORKS (METHODOLOGY)
═══════════════════════════════════════
STEP 1: TRENDLINE FORMATION
The system continuously scans for pivot highs and pivot lows to
construct trendlines. You control:
BANK 1 (Short-Term):
- Pivot Length: How many bars to look back for swing points
- Min Touches: How many pivots needed to form a line (default: 3)
- Max Length: How far back lines can reach (default: 180 bars)
- Angle Limits: Maximum steepness allowed for valid trendlines
- Tolerance: How close pivots must align to form horizontal lines
BANK 2 (Medium-Term):
- Slightly longer pivot periods for more significant levels
- Captures medium-term trend structure
- Default Max Length: 200 bars
BANK 3 (Long-Term):
- Focuses on major support/resistance zones
- Often uses horizontal levels (angled lines disabled by default)
- Default Max Length: 300 bars
The system draws RESISTANCE lines (red) above price and SUPPORT
lines (green) below price. These adapt in real-time as new pivots form.
STEP 2: BREAKOUT DETECTION
LONG SIGNALS:
- Price closes above a resistance trendline
- Higher timeframe trend is up (optional filter)
- Price not overextended from HTF trend (optional filter)
- No position currently open
SHORT SIGNALS:
- Price closes below a support trendline
- Higher timeframe trend is down (optional filter)
- Price not overextended from HTF trend (optional filter)
- No position currently open
The "tight" aspect: Because you're entering right at the trendline
break, your stop-loss can be placed very close (just below the
broken resistance for longs), creating exceptional risk/reward ratios.
STEP 3: POSITION SIZING
Choose between:
- Fixed $ Risk Per Trade: Risk same dollar amount every trade
- % Risk Per Trade: Risk percentage of current equity
Position size automatically calculated based on:
- Your risk amount
- Distance to stop-loss (ATR-based)
- Works with stocks, futures, crypto (auto-adjusts for contract multipliers)
STEP 4: EXIT MANAGEMENT
Multiple exit methods working together:
- PROFIT TARGET: Exits when profit reaches 100x your risk
- EXTENDED PROFIT: Earlier exit (80R) when very far from HTF trend
- STOP LOSS: Fixed ATR-based stop below entry
- HTF TREND EXIT: Exits when price crosses below HTF trend with profit
- BREAKEVEN PULLBACK: Exits if profit drops below 0.6R after reaching breakeven
- PARTIAL PROFITS: Optional - take partial profits at specified R-multiple
═══════════════════════════════════════
🔧 KEY COMPONENTS EXPLAINED
═══════════════════════════════════════
HULL MOVING AVERAGE (HMA)
A smoothed moving average that reduces lag compared to traditional
MAs. The system uses HMA on a higher timeframe to determine the
dominant trend direction. You can choose:
- Auto HTF: System picks appropriate HTF based on your chart timeframe
- Manual HTF: You specify the higher timeframe
AVERAGE TRUE RANGE (ATR)
Measures current market volatility. Used for:
- Stop-loss distance (tighter when volatility low)
- Profit targets (larger when volatility high)
- Position sizing (smaller positions in volatile conditions)
- Breakeven trigger distance
TRENDLINE ANGLE FILTERING
Each trendline bank has angle limits to ensure quality:
- Resistance lines: Max downward/upward slope allowed
- Support lines: Max downward/upward slope allowed
- Angles automatically adjust based on current volatility
- Prevents overly steep/unreliable trendlines
SENSITIVITY CONTROL
One master slider adjusts multiple parameters:
- Trendline detection sensitivity
- HTF MA length
- Exit timing
- Auto-adjusts for daily+ timeframes (60% increase)
═══════════════════════════════════════
⚙️ WHAT YOU SEE ON YOUR CHART
═══════════════════════════════════════
TRENDLINES:
✓ Red resistance lines above price
✓ Green support lines below price
✓ Orange broken lines (past breakouts)
✓ Lines extend to show current levels
HTF TREND:
✓ Thick colored line showing higher timeframe trend
✓ Color gradient: Red (bearish) → Orange → Yellow → Green (bullish)
✓ 250-bar smoothed curve for visual clarity
ENTRY/EXIT SIGNALS:
✓ Small green dot below bar = Long entry
✓ Small red dot above bar = Short entry
✓ Small red dot above = Long exit
✓ Small black dot below = Short exit
OPTIONAL DETAILED LABELS:
✓ Bank number that triggered entry (Bank 1, 2, or 3)
✓ Exit reason (Profit Target, Stop Loss, HTF Exit, etc.)
✓ Partial profit notifications
POSITION TRACKING:
✓ Yellow dashed line at entry price (extends right)
✓ Green/red fill showing current profit/loss zone
✓ Lime arrows at top = Currently in long position
✓ Red arrows at bottom = Currently in short position
✓ Gray background = No position (flat)
STATS TABLE (Top Right):
✓ Current position (LONG/SHORT/FLAT)
✓ Risk per trade ($ or %)
✓ Entry price
✓ Unrealized P/L in dollars
✓ P/L in R-multiples (how many R's profit/loss)
✓ Average winner/loser R ($ mode) OR CAGR (% mode)
═══════════════════════════════════════
📈 OPTIMAL USAGE
═══════════════════════════════════════
BEST ASSETS:
- NASDAQ:QQQ on 1-hour (reg) chart ⭐ (PRIMARY OPTIMIZATION)
- Strong trending stocks: NVDA, AAPL, TSLA, MSFT, GOOGL, AMZN
- High volatility tech stocks
- Crypto: BTC, ETH
- Any liquid asset with clear trends and momentum (GOLD)
AVOID:
- Low volatility stocks
- Ranging/choppy markets
- Penny stocks or illiquid assets
- Assets without clear directional movement
BEST TIMEFRAMES:
- PRIMARY: 1-hour charts (optimal for QQQ)
- ALSO EXCELLENT: 2H, 4H, 8H
- WORKS: 15min, 30min (only momentum leaders, more noise)
- WORKS WITH ADJUSTMENTS: 1D, 2D (decrease trendline pivot lengths)
═══════════════════════════════════════
📊 BACKTEST RESULTS (QQQ 1H (Reg hours), 1999-2024)
═══════════════════════════════════════
The system showed on NASDAQ:QQQ 1-hour timeframe (regular hours):
- Total Return: 1,100,000%+ over 24 years
- Total Trades: 500+
- Win Rate: ~20-24% (LOW - this is by design!)
- Average Winner: 8-15% gain
- Average Loser: 2-4% loss
- Win/Loss Ratio: 10:1 (winners much bigger than losers)
- Profit Factor: 3+
- Max Drawdown: 45-50%
- Risk per trade: 3% of capital
KEY INSIGHT: This is a LOW WIN RATE, HIGH REWARD system. You will
lose more trades than you win, but the few winners are so large
they more than compensate for many small losses.
IMPORTANT: These are backtested results using optimal parameters
on historical data. Real trading results will vary based on:
- Your execution and timing
- Slippage and commissions
- Your emotional discipline
- Market conditions during your trading period
═══════════════════════════════════════
🎓 WHO IS THIS FOR?
═══════════════════════════════════════
IDEAL FOR:
✓ Swing traders comfortable holding winners for longer period
✓ Part-time traders (1H = check 2-3x per day)
✓ Traders seeking exceptional risk/reward ratios
✓ Those comfortable with low win rates if winners are huge
✓ Technical analysis enthusiasts
✓ Breakout traders
✓ Trend followers
═══════════════════════════════════════
🚀 GETTING STARTED - STEP BY STEP
═══════════════════════════════════════
STEP 1: APPLY TO YOUR CHART
- Search "Tight Entry Trend Engine" in indicators
- Click to apply to your chart
- Trendlines and HTF line will appear immediately
STEP 2: CHOOSE YOUR SETTINGS
For BEGINNERS - Use These Settings First:
1. Trade Direction & Filters:
• ENABLE LONGS: ✓ ON
• ENABLE SHORTS: ✗ OFF (start with longs only)
• Sensitivity: 1.0 (default)
• HTF Trend Entry Filter: ✓ ON (safer entries)
• Block Entries When Overextended: ✓ ON (avoid parabolic tops)
2. Position Sizing & Risk:
• Position Sizing: "Per Risk"
• RISK Type: "$ Per Trade"
• Risk Amount: $200 (or 1-3% of your account)
3. Visual Settings:
• Show Support Lines: ✗ OFF (unless trading shorts)
• Show Detailed Entry/Exit Labels: ✓ ON
• Show Stats Table: ✓ ON
• Show Entry Line & P/L Fill: ✓ ON
4. Leave everything else at DEFAULT for now
STEP 3: UNDERSTAND WHAT YOU SEE
When trendlines appear:
- RED lines above = Resistance (watch for price breaking UP through these)
- GREEN lines below = Support (watch for price breaking DOWN)
- When price breaks a red line = Potential LONG entry
- When price breaks a green line = Potential SHORT entry
The HTF trend line (thick colored):
- Green/lime = Strong uptrend (favorable for longs)
- Red = Strong downtrend (favorable for shorts if enabled)
- Orange/yellow = Transitioning
STEP 4: OBSERVE SIGNALS
- Small GREEN dot below bar = System entered LONG
- Small RED dot above bar = System exited LONG
- Check the label to see which "Bank" triggered (Bank 1, 2, or 3)
- Watch the yellow entry line and colored fill show your P/L
STEP 5: PAPER TRADE FIRST
- Use TradingView's paper trading feature
- Watch how signals perform on YOUR chosen asset
- Understand the win rate will be LOW (20-35%)
- Verify that winners are indeed much larger than losers
- Test for at least 20-30 signals before going live
STEP 6: OPTIMIZE FOR YOUR ASSET (OPTIONAL)
If default settings aren't working well:
For FASTER signals (more trades):
- Reduce Pivot Length 1 to 3-4
- Reduce Max Length 1 to 120-150
- Increase Sensitivity to 1.2-1.5
For SLOWER signals (higher quality):
- Increase Pivot Length 1 to 7-10
- Increase Max Length 1 to 250+
- Decrease Sensitivity to 0.7-0.9
For DAILY timeframes:
- Increase all Pivot Lengths by 30-50%
- Increase all Max Lengths significantly
- Sensitivity: 0.6-0.8
═══════════════════════════════════════
⚙️ ADVANCED SETTINGS EXPLAINED
═══════════════════════════════════════
TRENDLINE BANK SETTINGS:
Each bank (1, 2, 3) has these parameters:
- Min Touches: Minimum pivots to form a line
- Lower (2) = More lines, earlier detection
- Higher (4+) = Fewer lines, higher quality
- Pivot Length: Lookback for swing points
- Lower (3-5) = Reacts to recent price action
- Higher (10+) = Only major swing points
- Max Length: How old a trendline can be
- Shorter (100-150) = Only recent lines
- Longer (300+) = Include historical levels
- Tolerance: Alignment strictness for horizontal lines
- Lower (3.0-3.5) = Very strict horizontal
- Higher (4.5+) = More forgiving alignment
- Allow Angled Lines: Enable diagonal trendlines
- ON = Catches sloped support/resistance
- OFF = Only horizontal levels
- Angle Limits: Maximum steepness allowed
- Lower (1-2) = Only gentle slopes
- Higher (4-6) = Accept steeper angles
- Automatically adjusts for volatility
ATR MULTIPLIERS:
- STOP LOSS ATR (0.6): Distance to stop-loss
- Lower (0.4-0.5) = Tighter stops, stopped out more
- Higher (0.8-1.0) = Wider stops, more room
- PROFIT TARGET ATR (100): Main profit target
- This is 100x your risk = 10,000% R:R
- Lower (50-80) = Take profits sooner
- Higher (120+) = Let winners run longer
- BREAKEVEN ATR (40): When to move stop to breakeven
- Lower (20-30) = Protect profits earlier
- Higher (60+) = Give more room before protecting
HIGHER TIMEFRAME:
- Auto HTF: Automatically selects appropriate HTF
- 5min chart → uses 2H
- 15-30min → uses 6H
- 1-4H → uses 2D
- Daily → uses 4D
- HTF MA Length (300): HMA period for trend
- Lower (150-250) = More responsive
- Higher (400-500) = Smoother, less whipsaw
- HTF Trend Following Exit: Exits when crossing HTF
- ON = Additional exit method
- OFF = Rely only on profit targets/stops
- HTF Trend Entry Filter: Only trade with HTF trend
- ON = Safer, fewer signals
- OFF = More aggressive, more signals
- Block Entries When Overextended: Prevents chasing
- ON = Avoids parabolic tops/bottoms
- OFF = Enter all breakouts regardless
═══════════════════════════════════════
💡 TRADING PHILOSOPHY & EXPECTATIONS
═══════════════════════════════════════
This system is built on one core principle:
"ACCEPT SMALL, FREQUENT LOSSES TO CAPTURE RARE, MASSIVE WINS"
What this means:
- You WILL lose 65%-75% of your trades
- Most losses will be small (1-2R)
- Some winners hit 80R+
- Over time, math works in your favour

EMA Trend Buy sell strategyThis strategy is built to help investors get into a trend safely and smartly — without rushing and without getting in and out too often.
When to Buy:
First Signal – Small Step In (50% Buy)
When the short-term trend (EMA 18) turns positive and goes above the medium trend (EMA 33),
👉 we buy half of our planned position.
This is an early warning that a new upward trend might be starting.
Second Signal – Full Confidence (Buy other 50%)
If the medium-term trend (EMA 33) also crosses above the long-term (EMA 50),
👉 we buy the other half of the position.
Now we’re more confident that the trend is real.
When to Sell:
First Warning – Reduce Position (Sell 50%)
If EMA 33 falls below EMA 50,
👉 we sell half of the position to reduce risk.
Trend Reversal – Exit Completely (Sell the rest)
If EMA 18 also falls below EMA 33,
👉 we sell the remaining half and leave the trade fully.
Why This Strategy?
📉 We don’t jump in all at once.
→ We wait for confirmation before going full in.
⏳ We stay in the trade as long as the trend is healthy.
→ No overtrading or reacting to small moves.
📊 We get out slowly, not suddenly.
→ This helps protect profits and avoid emotional decisions.

Batman Strategy v1
1. Overview & Core Concept
The "Batman Strategy V1" is a comprehensive trend-following and pyramid-trading framework designed for multiple asset classes. Its core concept is to identify strong, established trends and systematically enter positions in stages (pyramiding) to maximize gains during sustained market movements.
This strategy is built on a proprietary scoring system that synthesizes multiple market dimensions—including stage analysis, relative strength, and volume dynamics—into clear, actionable signals. It is not a simple indicator mashup; it's a complete system with defined entry, exit, and risk management protocols.
2. Key Features
Proprietary Trend Scoring: The strategy grades market conditions from 'A' (strong bull trend) to 'Z' (strong bear trend) using a unique combination of ADX and RSI calculations, providing a nuanced view of trend maturity and strength.
Advanced Relative Strength Analysis: Automatically compares the asset's performance against a relevant market index (e.g., NIFTY for Indian stocks, NDX for US stocks, or a total crypto market cap for crypto) to ensure it is a market leader.
Heikin-Ashi Based Logic: Utilizes Heikin-Ashi candles for its core calculations to filter out market noise and provide smoother trend signals.
Multi-Tranche Pyramiding: The strategy is designed to enter a position with an initial tranche and add up to four subsequent positions if the trend continues favorably, based on a proprietary breakout logic (`ha_close > breakout`).
Dynamic & Multi-Option Exits: Offers three distinct, user-selectable trailing stop mechanisms for exits: SuperTrend, V-Stop, and Chandelier Exit. This allows traders to tailor the exit logic to their risk tolerance and the asset's volatility. The data source for these exits can also be switched between the standard chart and Heikin-Ashi candles.
Integrated Risk Management: Implements a sophisticated stop-loss system that adjusts based on the number of open trades, aiming to move to break-even after the third tranche and protecting capital.
3. How to Use This Strategy
Configuration: In the script settings, first set your desired backtesting date range. Then, configure the "Entry," "Tranching," and "Exit" parameters to suit your trading style. The most important choice is the "Exit Indicator," as this will define how the strategy closes trades.
Interpretation: When applied to a chart, the strategy will plot trend score labels ('A', 'B', 'C' for bullish; 'X', 'Y', 'Z' for bearish), color the background based on relative strength, and color the bars based on volume strength. Backtesting results, including all pyramided trades, will be visible in the "Strategy Tester" panel.
Alerts: The script includes built-in alert conditions for both bullish and bearish trend scores, which can be used to notify you of potential opportunities.
4. Backtesting & Performance
This is a strategy script, and its performance should be thoroughly evaluated in the Strategy Tester. As per TradingView rules, users should use realistic settings for initial capital, commission, and slippage. The default settings are a template; they should be adjusted to reflect the conditions of the market you are testing. Past performance is not indicative of future results.
5. Disclaimer
This strategy is a tool for market analysis and idea validation. It is not financial advice. All trading involves risk, and you should not risk more than you are prepared to lose. This is a closed-source, protected script; its internal calculations are proprietary.

Eyas's EyeTry it and see!!
# 🦅 EYAS'S EYE - Multi-Confluence Trend Strategy
A systematic trading strategy combining multiple technical indicators with advanced risk management for high-probability trades in trending markets.
## 📊 OVERVIEW
**Trading Style:** Swing/Position Trading
**Direction:** Long & Short
**Best Timeframes:** 4H, Daily
**Markets:** Crypto, Forex, Indices
## 🎯 METHODOLOGY
**Multi-Indicator Confluence System:**
- Trend analysis for market direction
- Momentum indicators for timing
- Volatility-based entry zones
- Dynamic ATR-based risk management
**Entry Requirements:**
- Multiple confirming signals required
- Strong trend filtering
- Minimum bars between trades
- Balanced long/short exposure
**Exit Strategy:**
- Volatility-adjusted stop losses
- High risk-reward targets (6:1)
- Trailing stops to capture trends
- Signal-based exits
- Minimum hold time to let winners run
## ✨ KEY FEATURES
✅ Realistic execution model (no look-ahead bias)
✅ Dynamic risk management
✅ Customizable parameters
✅ Clear visual signals
✅ Real-time performance metrics
## 📈 PERFORMANCE
Backtested on ETH/USD (12 months):
- Win Rate: 88-93%
- 500+ closed trades
- Strong profit factor
- Consistent monthly returns
**Best in:** Trending markets with medium-high volatility
**Challenges:** Choppy sideways markets
## 🔒 ACCESS
**This is a PROTECTED script**
To request access, send me a private message or comment below.
## ⚠️ DISCLAIMER
Trading involves substantial risk. Past performance does not guarantee future results. This is not financial advice. Always test with paper trading first and never risk more than you can afford to lose.
---
**Strategy Philosophy:** Quality over quantity. The name "Eyas's Eye" represents the sharp vision of a young eagle - patience in waiting for the right moment and the ability to spot opportunities others miss.
🦅 **Trade with vision. Trade with Eyas's Eye.**

BTC 5-MA Multi Cross Strategy By Hardik Prajapati Ai TradelabThis strategy is built around the five most powerful and commonly used moving averages in crypto trading — 5, 20, 50, 100, and 200-period SMAs (Simple Moving Averages) — applied on a 1-hour Bitcoin chart.
Core Idea:
The strategy aims to identify strong bullish trends by confirming when the price action crosses above all key moving averages. This alignment of multiple MAs indicates momentum shift and helps filter out false breakouts.
⸻
⚙️ How It Works:
1. Calculates 5 Moving Averages:
• 5 MA → Short-term momentum (fastest signal)
• 20 MA → Near-term trend confirmation
• 50 MA → Mid-term trend filter
• 100 MA → Long-term trend foundation
• 200 MA → Macro-trend direction (strongest support/resistance)
2. Buy Condition (Entry):
• A Buy is triggered when:
• The price crosses above the 5 MA, and
• The closing price remains above all other MAs (20, 50, 100, 200)
This signals that momentum is aligned across all time horizons — a strong uptrend confirmation.
3. Sell Condition (Exit):
• The position is closed when price crosses below the 20 MA, showing weakness in short-term momentum.
4. Visual Signals:
• 🟢 BUY triangle below candles → Entry signal
• 🔴 SELL triangle above candles → Exit signal
• Colored MAs plotted for trend clarity.
⸻
📈 Recommended Usage:
• Chart: BTC/USDT
• Timeframe: 1 Hour
• Type: Trend-following crossover strategy
• Ideal for: Identifying major breakout moves and confirming trend reversals.
⸻
⚠️ Notes:
• This script is meant for educational and backtesting purposes only.
• Always apply additional confirmation tools (like RSI, Volume, or VIX-style filters) before live trading.
• Works best during trending markets; may produce whipsaws in sideways zones.

PG DMean & Price Sync ver 9.4 - ConsolidatedPG DMean & Price Sync Strategy (SD Filter)
This strategy combines the momentum-oscillator properties of the Detrended Mean (DMean) with a Standard Deviation (SD) Price Filter for confirming trend direction, aiming to isolate high-conviction trades while actively managing risk.
🔑 Core Logic
DMean Momentum Signal: The strategy's primary engine is the DMean, which measures the percentage difference between the current closing price and a longer-term Moving Average (price_ma). It is then smoothed by a DMean Signal line (MA of the DMean).
Entry Signal: A trade is triggered when the DMean line crosses above (for Long) or below (for Short) its Signal Line, but it must clear a user-defined Dead Zone Threshold to confirm momentum commitment.
SD Filter Confirmation (Price Sync): A Standard Deviation Channel, based on a separate user-defined price source and period, is used to filter trades.
Long Filter: Allows Long entries only when the price is trading above the lower SD band, suggesting the current price action is stronger than the recent average volatility to the downside.
Short Filter: Allows Short entries only when the price is currently below the Filter Basis (SMA), confirming a bearish stance within the SD channel.
🛡️ Risk & Exit Management
Primary Exit: All trades are exited by reverse DMean Crossover/Crossunder, meaning the position is closed when the DMean momentum reverses against the open trade (e.g., DMean crosses under the Signal to exit a Long).
Hard Stop Loss (Short Trades): A mandatory percentage-based Hard Stop Loss is implemented only for short positions to protect against sudden upward price spikes, closing the trade if the loss exceeds the set percentage. (Note: This version does not include a Hard SL for Long trades).
📊 Performance Dashboard
A custom Performance Dashboard Table is displayed at the bottom right of the chart to provide real-time, at-a-glance comparison of the strategy's equity performance versus a simple Buy & Hold over the selected backtesting date range.

Nemesis Strategy MLWinning That's all I know
Years of research been done to this strategy It's based on algorithm that detects where the markets are going Works on crypto this strategy his excellent indicators and it can generate a lot of money if you know what you are doing and depending on the fees of the exchanges as well So be smart and be kind God bless you all
SuperTrended Moving Averages Strategyself use
used in 1 second timeframe
please let me publish it aaa
