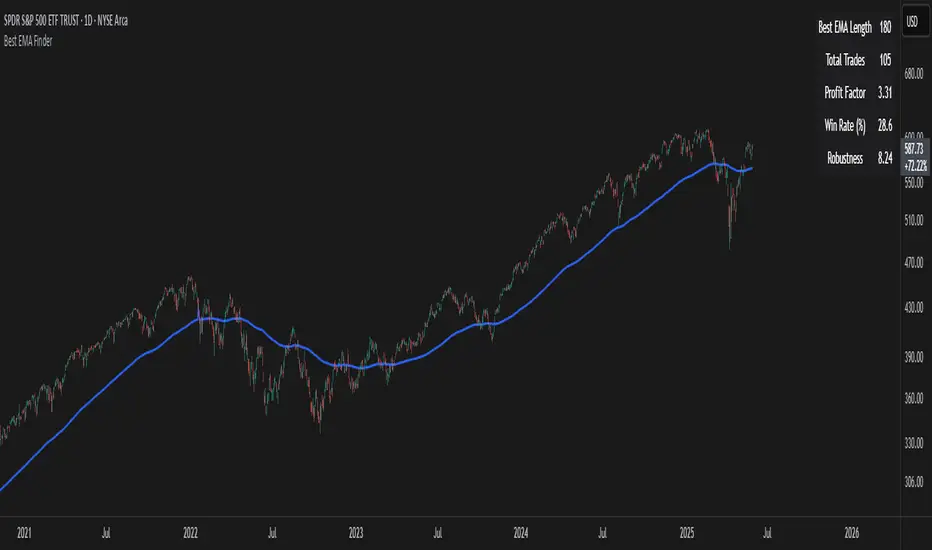
Best EMA FinderThis script, Best EMA Finder, is based on the same original logic as the Best SMA Finder I published previously. Although it was not the initial goal of the project, several users asked for an EMA version, so here it is.
The script scans a wide range of Exponential Moving Average (EMA) lengths, from 10 to 500, and identifies the one that historically delivered the most robust performance on the current chart. The choice to stop at 500 is deliberate: beyond that point, EMA curves tend to flatten and converge, adding processing time without meaningful differences in signals or outcomes.
Each EMA is evaluated using a custom robustness score:
Profit Factor × log(Number of Trades) × sqrt(Win Rate)
Only EMA lengths that exceed a user-defined minimum number of trades are considered valid. Among these, the one with the highest robustness score is selected and displayed on the chart.
A table summarizes the results:
- Best EMA length
- Total number of trades
- Profit Factor
- Win Rate
- Robustness Score
You can adjust:
- Strategy type: Long Only or Buy & Sell
- Minimum number of trades required
- Table visibility
This script is designed for analysis and optimization only. It does not execute trades or handle position sizing. Only one open trade per direction is considered at a time.
Médias Móveis
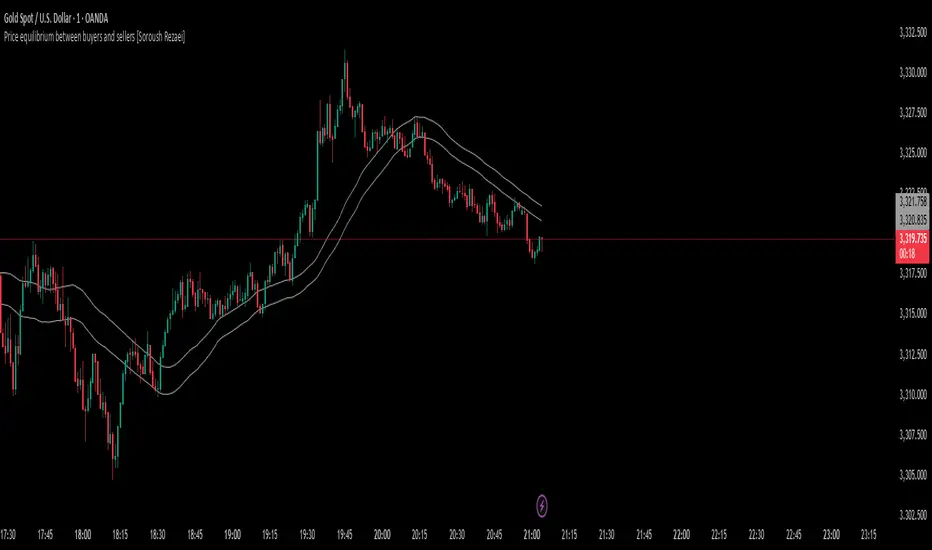
Price equilibrium between buyers and sellers [Soroush Rezaei]This indicator visualizes the dynamic balance between buyers and sellers using two simple moving averages (SMAs) based on the high and low prices.
The green line (SMA of highs) reflects the upper pressure zone, while the red line (SMA of lows) represents the lower support zone.
When price hovers between these two levels, it often signals a state of temporary equilibrium — a consolidation zone where buyers and sellers are relatively balanced.
Use this tool to:
Identify ranging or balanced market phases
Spot potential breakout or reversal zones
Enhance your multi-timeframe or price action strategy
Recommended for intraday and swing traders seeking visual clarity on market structure and momentum zones.
Dynamic Linear Regressions Bands [TradingFinder] DLR VWAP Lines🔵 Introduction
Periodic Linear regression, a statistical tool, models price trends by fitting a line to historical data, revealing market direction. This indicator plots periodic linear regression channels on a chart, anchored to a user-selected higher timeframe (HTF).
Periodic regression means the channel recalculates at new period boundaries, adapting to recent price trends for accurate analysis. It captures price dynamics with precision, leveraging statistical rigor.
Market behavior, though unpredictable, yields patterns when analyzed through regression. A 2023 study by the Journal of Financial Markets found 68% of trend predictions align with linear regression models in forex. This indicator harnesses such insights for trading.
The indicator’s channels, defined by slope and deviation, highlight trend strength and volatility. Positive slopes, colored green, signal bullish momentum, while negative slopes, in red, indicate bearish trends. This visual clarity aids traders in spotting reversals or continuations.
By anchoring to HTF data, the indicator aligns with institutional trading cycles, as 75% of volume occurs on daily or higher timeframes. It filters noise, offering a clearer view of structural trends. Traders gain an edge in high-liquidity markets like forex or indices.
🔵 How to Use
🟣 Live Updates
The indicator operates in static or dynamic modes, plotting channels based on HTF data. Static mode draws fixed channels with central and lateral lines, reflecting regression slope. Dynamic mode updates continuously, plotting a smooth trendline.
The indicator’s periodic reset ensures the channel stays relevant, with each new period adjusting the midline and bands based on fresh data. Monitor these shifts to identify trend changes, using the updated channel for timely entry or exit decisions. Check the table for slope updates.
🟣 Bullish
In a bullish market, dynamic upward regression channels in green adapt to price action, signaling a strong uptrend for timely entries. Static uptrend channels in green confirm the trend’s stability, aiding quick bullish decisions.
🟣 Bearish
In a bearish market, dynamic downward regression channels in red adjust to price declines, indicating a strong downtrend for short opportunities. Static downtrend channels in red validate the bearish trend, supporting rapid sell decisions.
🟣 Support and Resistance Levels
In static mode, channels act as support and resistance zones, guiding entries and exits. For example, price rejecting the upper band may signal a reversal. This aligns with ICT concepts like order block interactions.
The multiplier defines band width, for example with a multiplier of 2 creating wider bands that cover 95% of bars, acting as reliable support and resistance.
On the other hand, a multiplier of 1 produces tighter bands that price often breaks through, offering weak support and resistance. Avoid relying on these levels; increase the multiplier for stronger boundaries and monitor price action to validate channel effectiveness.
The indicator’s table displays instantaneous regression values, like slope and HTF price points. Positioned customizable, it offers real-time insights. Traders can monitor trend strength without manual calculations.
🔵 Settings
Mode : Selects static (fixed channels) or dynamic (continuous plotting) for regression display.
HTF : Sets the higher timeframe (e.g., 1-hour, daily) for regression calculations.
Source : Defines the price data (e.g., close, open) used for regression analysis.
Deviation Multiplier : Adjusts channel width, typically 1-3, to capture volatility range.
Show Channel Bands : Toggles visibility of upper and lower regression bands.
Colors and Gradient : Configures green (bullish) or red (bearish) channels with fading coefficients.
Table Display Checkbox : Enables/disables the table showing regression values.
Font Position and Size : Customizes table placement and text size for readability.
🔵 Conclusion
This indicator, like a navigator charting market tides, delivers precise trend insights via linear regression. Its HTF-based channels reveal structural price movements, filtering intraday noise. Traders gain clarity in volatile markets.
Static mode offers stable zones for swing trading, while dynamic mode suits intraday precision. Customizable deviation and gradient settings adapt to diverse strategies. This flexibility enhances its cross-asset utility.
The table’s real-time data empowers traders with actionable metrics, like slope strength. Paired with volume confirmation, it strengthens trade setups. Keywords like “regression channel trading” boost its relevance.
By aligning with HTF cycles, the indicator captures institutional momentum, per CME’s volume data. Disciplined risk management ensures profitability. It’s a vital tool for data-driven trading success.

SMA Crossover StrategyThis is a Pine Script for a simple moving average crossover strategy with buy and sell alerts

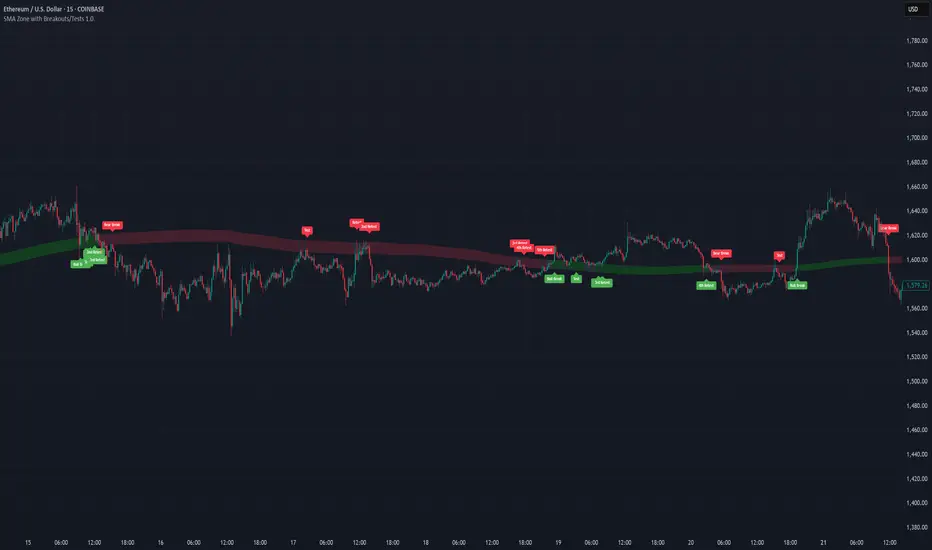
SMA Zone with Breakouts/Tests 1.0.This indicator plots a dynamic “SMA Zone” between two simple moving averages (one applied to lows, one to highs) and highlights key interaction points with the zone:
Breakouts
Bull Break: price closes above the upper SMA
Bear Break: price closes below the lower SMA
Requires confirmation via either above-average volume or an unusually wide bar (spread > ATR) closing near its extreme
Tests & Retests
After a breakout, the first re-entry into the zone edge is labeled “Test,” subsequent re-entries are numbered “Retest,” “2nd Retest,” etc.
Zone Weakening: each additional Test/Retest signifies diminished zone strength—fewer reliable boundaries remain (Traditional S/R theory)
Alerts
Fires a unified “Zone Signal” alert on every Break, Test, and Retest (set condition to “Any alert() function call”).
Disclaimer:
This is not financial advice and should not be used as a standalone trading signal.
It’s designed to draw your attention to important price-zone interactions so you can manually tune in.
The logic can be further enhanced or combined with other indicators/algorithms as part of a more complex trading system.
Dr Avinash Talele momentum indicaterTrend and Volatility Metrics
EMA10, EMA20, EMA50:
Show the percentage distance of the current price from the 10, 20, and 50-period Exponential Moving Averages.
Positive values indicate the price is above the moving average (bullish momentum).
Negative values indicate the price is below the moving average (bearish or corrective phase).
Use: Helps traders spot if a stock is extended or pulling back to support.
RVol (Relative Volume):
Compares current volume to the 20-day average.
Positive values mean higher-than-average trading activity (potential institutional interest).
Negative values mean lower activity (less conviction).
Use: High RVol often precedes strong moves.
ADR (Average Daily Range):
Shows the average daily price movement as a percentage.
Use: Higher ADR = more volatility = more trading opportunities.
50D Avg. Vol & 50D Avg. Vol ₹:
The 50-day average volume (in millions) and value traded (in crores).
Use: Confirms liquidity and suitability for larger trades.
ROC (Rate of Change) Section
1W, 1M, 3M, 6M, 12M:
Show the percentage price change over the last 1 week, 1 month, 3 months, 6 months, and 12 months.
Positive values (green) = uptrend, Negative values (red) = downtrend.
Use: Quickly see if the stock is gaining or losing momentum over different timeframes.
Momentum Section
1M, 3M, 6M:
Show the percentage gain from the lowest price in the last 1, 3, and 6 months.
Use: Measures how much the stock has bounced from recent lows, helping find strong rebounds or new leaders.
52-Week High/Low Section
From 52WH / From 52WL:
Show how far the current price is from its 52-week high and low, as a percentage.
Closer to 52WH = strong uptrend; Closer to 52WL = possible value or turnaround setup.
Use: Helps traders identify stocks breaking out to new highs or rebounding off lows.
U/D Ratio
U/D Ratio:
The ratio of up-volume to down-volume over the last 50 days.
Above 1 = more buying volume (bullish), Below 1 = more selling volume (bearish).
Use: Confirms accumulation or distribution.
How This Table Helps Analysts and Traders
Instant Trend Assessment:
With EMA distances and ROC, analysts can instantly see if the stock is trending, consolidating, or reversing.
Momentum Confirmation:
ROC and Momentum sections highlight stocks with strong recent moves, ideal for momentum and breakout traders.
Liquidity and Volatility Check:
Volume and ADR ensure the stock is tradable and has enough price movement to justify a trade.
Relative Positioning:
52-week high/low stats show whether the stock is near breakout levels or potential reversal zones.
Volume Confirmation:
RVol and U/D ratio help confirm if moves are backed by real buying/selling interest.
Actionable Insights:
By combining these metrics, traders can filter for stocks with strong trends, robust momentum, and institutional backing—ideal for swing, position, or even intraday trading.

Donchian Channel Midline AverageThis script draws a single line on your chart, and here's how it figures out where that line should be:
You Tell It How Far Back to Look (Length): You set a number, let's say 20. This means the script will always look back at the past 20 price bars (candles).
It Finds the Extreme Points:
For those past 20 bars, it finds the very highest point the price reached.
And, it finds the very lowest point the price reached.
It Calculates the "Middle" of Those Extremes:
It takes that highest point and that lowest point, and simply finds the average of the two. This average is the exact middle of the highest and lowest price points over your chosen period.
It Draws the Line: This "middle of the extremes" point is then drawn as a line on your chart. It keeps doing this for every new bar, so the line "moves" along with the price.
So, in a nutshell:
This script gives you a special kind of moving average. Instead of averaging every single price point like a typical moving average, it averages just the highest high and the lowest low over a set period. It's like finding the exact center point of the recent price "tunnel" or "range" on your chart.
The Length input controls how many bars back it looks.
The Offset input lets you slide the line a few bars forward or backward in time, if you want.

NY Opening Range Breakout - MA StopCore Concept
This strategy trades breakouts from the New York opening range (9:30-9:45 AM NY time) on intraday timeframes, designed for scalping and day trading.
Setup Requirements
Timeframe: Works on any timeframe under 15 minutes (1m, 2m, 3m, 5m, 10m)
Session: New York market hours
Range Period: 9:30-9:45 AM NY time (15-minute opening range)
Entry Rules
Long Entries:
Wait for a candle to close above the opening range high
Enter long on the next candle (before 12:00 PM NY time)
Must be above moving average if using MA-based take profit
Short Entries:
Wait for a candle to close below the opening range low
Enter short on the next candle (before 12:00 PM NY time)
Must be below moving average if using MA-based take profit
Risk Management
Stop Loss:
Long trades: Opening range low
Short trades: Opening range high
Take Profit Options:
Fixed Risk Reward: 1.5x the range size (customizable ratio)
Moving Average: Exit when price crosses back through MA
Both: Whichever comes first
Key Features
Trade Direction Options:
Long Only
Short Only
Both directions
Moving Average Filter:
Prevents entries that would immediately hit stop loss
Uses EMA/SMA/WMA/VWMA with customizable length
Acts as dynamic support/resistance
Time Restrictions:
No entries after 12:00 PM NY time (customizable cutoff)
One trade per direction per day
Daily reset of all variables
Visual Elements
Red/green lines showing opening range
Purple line for moving average
Entry and breakout signals with shapes
Take profit and stop loss levels plotted
Information table with current status
Strategy Logic Flow
Morning: Capture 9:30-9:45 range high/low
Wait: Monitor for breakout (previous candle close outside range)
Filter: Check MA condition if using MA-based exits
Enter: Trade on next candle after breakout
Manage: Exit at fixed TP, MA cross, or stop loss
Reset: Start fresh next trading day
This is a momentum-based breakout strategy that capitalizes on early market volatility while using the opening range as natural support/resistance levels.

SMA Strategy with Re-Entry Signal (v6 Style)*SMA Trend Strategy with Re-Entry Signal (v6 Edition)*
This indicator is based on a classic moving average trend-following system, enhanced with re-entry signals designed for medium to short-term traders.
---
### 📈 Key Features:
1. *Trend Detection Logic:*
- The 30-period SMA (SMA30) is used as the trend filter.
- When the closing price is above the SMA30, the market is considered to be in an uptrend.
2. *Re-Entry Signal:*
- While in an uptrend, if the closing price crosses above the SMA20, a re-entry (add position) signal is triggered.
- These signals are shown with green upward arrows below the bars.
3. *Background Highlighting:*
- Green background: indicates an uptrend.
- Red background: indicates a break below SMA30, suggesting weakening momentum.
4. *Multi-SMA Visualization:*
- Five SMAs are displayed: SMA10, SMA20, SMA30, SMA60, and SMA250.
- This helps visualize both short-term and long-term trend structures.
---
### 🔍 Usage Tips:
- Use this script directly on your main chart to monitor trend direction and wait for re-entry signals during pullbacks.
- Combine with other tools like volume, price action, or candlestick patterns to confirm entries.
---
### ⚠️ Disclaimer:
- This indicator is for educational and informational purposes only. It does not constitute financial advice or a buy/sell signal.
- Avoid relying solely on this script for trading decisions. Always manage your own risk.
---
👨💻 *Developer’s Note:*
This script is 100% manually developed, not copied or auto-generated. It is an original implementation based on my personal trading logic. Suggestions and feedback are welcome!

EMA 多空排列
Indicator Name: EMA Alignment
Introduction:
This indicator aims to help traders quickly identify potential trend directions by visualizing the alignment of EMAs (Exponential Moving Averages). By displaying both bullish and bearish alignments, this indicator can assist in determining potential buying and selling opportunities in the market.
Key Features:
Bullish and Bearish Alignment Identification:
Bullish Alignment: When shorter-period EMAs are above longer-period EMAs, it indicates a potential uptrend.
Bearish Alignment: When shorter-period EMAs are below longer-period EMAs, it indicates a potential downtrend.
Visual Cues:
Arrow Signals: Arrows are plotted on the chart at the start and end of bullish/bearish alignments, providing a clear visual representation of trend changes.
EMA Curves: Plots EMA curves of different periods, making it easy for users to observe the relationships between EMAs.
Customizable Parameters:
Allows users to customize the EMA periods to suit different trading strategies and market conditions.
Alert Functionality:
Provides alerts at the start and end of bullish/bearish alignments, helping users to promptly capture trading opportunities.
How to Use:
Add this indicator to your TradingView chart.
Customize the EMA periods according to your trading preferences.
Observe the arrow signals and EMA curves on the chart to determine market trends.
Combine with other technical indicators and analysis methods to develop your trading strategy.
Parameter Descriptions:
EMA Periods:
len1: 21
len2: 55
len3: 100
len4: 200
Users can modify these parameters according to their needs.
Suitable Scenarios:
This indicator is suitable for various markets and timeframes, especially for trend-following strategies.
Important Notes:
This indicator is intended as an auxiliary analysis tool and does not guarantee 100% accuracy.
Traders should consider their own risk tolerance and trading experience when using this indicator.
Please practice proper money management and control position risk.
Disclaimer:
This indicator is for educational and informational purposes only and does not constitute any investment advice. Traders are solely responsible for their trading risks.

OVTLYR ema CloudsPaints EMAs and Clouds based on 10/20 ema, 21/23 ema, 34/50 ema.
One can customize it per their preference by changing settings configuration window.

Открытие сессии: EMA + VWAP + ОбъемV 3
It is a software tool that automatically analyzes financial markets by selecting stocks or other assets based on preset parameters such as price, trading volume, technical indicators, and fundamentals.

1hr 1:1 at leastThis indicator will provide 95% accuracy on HTF starting from 1hr. As the accuracy is high, win rate is calculated for 1:1RR with impulsive entry when the band turns the color and Stoploss above/below the recent swing low/high.

RSI SwingRadar🧠 Strategy Overview
This long-only strategy combines RSI/MA crossovers with ATR-based risk management, designed for cleaner entries during potential bounce phases — especially tuned for assets like XMR/USDT.
🔍 Core Logic:
- RSI Crossover: Entry occurs when the 14-period RSI crosses above its 14-period SMA, signaling a potential shift in momentum.
- Oversold Filter: The RSI must have been below a user-defined oversold threshold (default: 35) on the previous candle, filtering for bounce setups after a pullback.
- ATR-Based Stop/Target: Stop-loss is placed below the low by a user-adjustable ATR multiplier (default: 0.5×). Take-profit is calculated with a Risk:Reward multiplier (default: 4×).
These elements work in tandem — RSI crossovers give momentum confirmation, oversold filtering adds context, and ATR-based exits adapt to volatility, creating a compact yet responsive strategy.
📉 Visuals:
- Dynamic Bands: The chart displays the active stop-loss, entry price, and take-profit as colored bands for easy visual tracking.
- Clean Overlay: Designed with simplicity — only confirmed setups are shown, keeping noise low.
✅ Suggested Use:
- Works best on XMR/USDT or similarly trending assets.
- Best suited for pullback entries during broader uptrends.
- Adjustable for different volatility conditions and asset behaviors.
⚠️ Disclaimer
- This strategy is for educational and research purposes only.
- It does not guarantee profitability in any market.
- Always backtest, forward-test, and understand your own risk tolerance before using any
strategy in a live environment.
- Past performance is not indicative of future results.
- This script is not financial advice.

Multi-Indicator Trend-Following Strategy v6Multi-Indicator Trend-Following Strategy v6
This strategy uses a combination of technical indicators to identify potential trend-following trade entries and exits. It is intended for educational and research purposes.
How it works:
Moving Averages (EMA): Entry signals are generated on crossovers between a fast and slow exponential moving average.
RSI Filter: Confirms momentum with a threshold above/below 50 for long/short entries.
Volume Confirmation: Requires volume to exceed a moving average multiplied by a user-defined factor.
ATR-Based Risk Management: Stop loss and take profit levels are calculated using the Average True Range (ATR), allowing for dynamic risk control based on market volatility.
Customizable Inputs:
Fast/Slow MA lengths
RSI length and levels
MACD settings (used in calculation, not directly in signal)
Volume MA and multiplier
ATR period and multipliers for stop loss and take profit
Notes:
This strategy does not guarantee future results.
It is provided for analysis and backtesting only.
Alerts are available for buy/sell conditions.
Feel free to adjust parameters to explore different market conditions and asset classes.

Multi-frame combination signalThis indicator provides signals based on a combination of multiple basic indicators (MACD, RSI, TSI) on three time frames. It can also display moving averages, Bollinger bands, and Ichimoku clouds. The three time frames can be set independently for each indicator. If you check "combination signal", a signal combining each checked basic indicator with "and" will be displayed. If you want to combine each basic indicator with "or", uncheck "combination signal" and check all the indicators you want to use. Each basic indicator can also be combined with five moving averages.

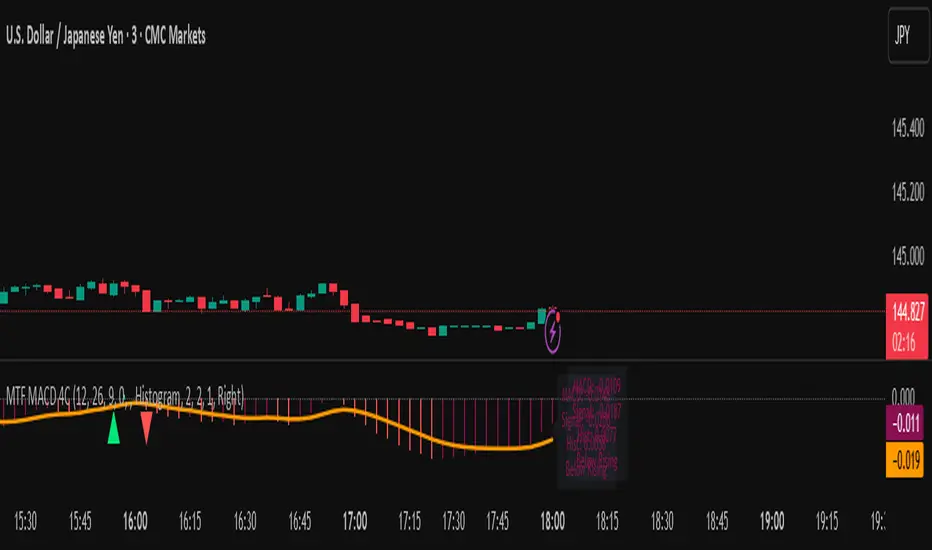
MTF MACD 4-Color Momentum System🎯 Overview
The MTF MACD 4-Color Momentum System is an advanced MACD indicator that provides crystal-clear momentum visualization through an innovative 4-color state system. Unlike traditional MACD indicators that only show positive/negative values, this indicator identifies four distinct market states to help traders make more informed decisions.
📊 Key Features
1. Four-State Color System:
🟢 Lime: Above zero + Rising (Strong Bullish Momentum)
🟢 Dark Green: Above zero + Falling (Weakening Bullish Momentum)
🔴 Red: Below zero + Falling (Strong Bearish Momentum)
🔴 Maroon: Below zero + Rising (Weakening Bearish Momentum)
2. Multi-Timeframe Analysis:
View higher timeframe MACD on lower timeframe charts
Confirm trends across multiple timeframes
Reduce false signals with multi-timeframe confluence
3. Flexible Display Options:
Three visualization styles: Histogram, Columns, or Line
Toggle individual color states on/off
Customizable colors and line widths
4. Advanced Features:
Optional histogram smoothing to reduce noise
Zero-cross alerts with visual markers
Color state change alerts
Real-time value display
Customizable signal line overlay
💡 How to Use
1. Momentum Identification:
Lime bars indicate strong upward momentum - ideal for long entries
Dark green suggests momentum is slowing - consider taking profits
Red bars show strong downward momentum - ideal for short entries
Maroon indicates potential reversal brewing - prepare for direction change
2. Zero Line Crosses:
Blue triangles mark bullish crosses above zero
Pink triangles mark bearish crosses below zero
Use these as confirmation signals with other indicators
3. Multi-Timeframe Confirmation:
Set to higher timeframe (e.g., 4H on 15m chart)
Look for alignment between timeframes before entering trades
Avoid trades against higher timeframe momentum
⚙️ Settings Guide
MACD Parameters:
Fast EMA: 12 (default) - Adjust for more/less sensitivity
Slow EMA: 26 (default) - Standard MACD setting
Signal: 9 (default) - Smoothing period
Display Customization:
Choose between Histogram, Columns, or Line display
Enable/disable specific color states
Adjust visual properties to match your chart theme
Alerts:
Zero cross alerts for trend changes
Color state alerts for momentum shifts
📈 Trading Strategies
1. Momentum Continuation:
Enter longs when MACD turns lime (above zero + rising)
Enter shorts when MACD turns red (below zero + falling)
Exit when color shifts to "weakening" state
2. Reversal Trading:
Watch for maroon in downtrends (potential bottom)
Watch for dark green in uptrends (potential top)
Confirm with price action and support/resistance
3. Multi-Timeframe Confluence:
Use daily MACD on 1H chart for trend direction
Enter on lower timeframe signals in direction of higher timeframe
Avoid counter-trend trades when higher timeframe shows strong momentum
🎓 Pro Tips
Combine with volume indicators for confirmation
Use with support/resistance levels for better entries
Enable smoothing in choppy markets to reduce false signals
Pay attention to divergences between price and MACD
⚠️ Risk Disclaimer
This indicator is for educational purposes only. Always use proper risk management and combine with other analysis methods. Past performance does not guarantee future results.
Steph's 8 EMA Pullback v2
basically just an 8 EMA pullback indicator.
green triangles signal towards a bullish trend
red triangles signal towards a bearish trend
price need to be above the 29 ema for bullish, below for bearish
have fun happy trading

Bullish Bearish Signal with EMA Color + LabelsThis script generates clear BUY and SELL signals based on a combination of trend direction, momentum, and confirmation from multiple indicators. It is intended to help traders identify strong bullish or bearish conditions using commonly trusted tools: EMA 200, MACD, and RSI.
🔍 How it works:
The strategy combines three key elements:
EMA 200 Trend Filter
Identifies the long-term trend:
Price above EMA200 → Bullish trend bias
Price below EMA200 → Bearish trend bias
The EMA line is color-coded:
🔵 Blue for bullish
🔴 Red for bearish
⚪ Gray for neutral/unclear
MACD Crossover
Detects shifts in market momentum:
Bullish: MACD line crosses above signal line
Bearish: MACD line crosses below signal line
RSI Confirmation
Adds an extra layer of confirmation:
Bullish: RSI is above its signal line
Bearish: RSI is below its signal line
✅ Signal Logic:
BUY Signal appears when:
Price > EMA200
MACD crosses up
RSI > its signal line
SELL Signal appears when:
Price < EMA200
MACD crosses down
RSI < its signal line
Labels will appear on the chart to highlight these events.
🔔 Alerts:
The script includes alerts for both Buy and Sell conditions, so you can be notified in real-time when they occur.
📈 How to Use:
Best used in trending markets.
Recommended for higher timeframes (1H and above).
May be combined with other tools such as support/resistance or candlestick analysis.
⚠️ Disclaimer: This script is intended for educational purposes only and does not constitute financial advice or a trading recommendation.

Adaptive Dual EMA Trend Filter# Adaptive Dual EMA Trend Filter
This indicator colors the EMA based on trend direction and shows buy/sell arrows based on trend shifts. Ideal for trend-following traders who want fast visual confirmation.
### Features:
- EMA color switches: **green for bullish**, **red for bearish**
- Automatic Buy/Sell signals based on trend reversal
- Works on all timeframes and assets
- Lightweight and fast
### How it works:
- EMA is calculated from the selected source
- If price is above the EMA → uptrend (green)
- If price is below the EMA → downtrend (red)
- Arrows mark transition points for possible entries/exits
---
🛠 Suggested usage:
- Combine with volume or momentum indicators
- Confirm with support/resistance zones
- Use alerts (customizable) for trend flips
---
If you find this helpful – give it a ⭐ and follow for more PineScript tools!

200 EMA Cross with Optional Second EMA and CooldownThis indicator uses two EMA lengths of your choosing.
1. This indicator is similar to the most recent published indicator.
2. There is also an alert when price crosses the faster EMA. But not the slower EMA.
3. You will receive all alerts as price crosses the main EMA, not the optional EMA.
6. The is also a "Cooldown" period between alerts so we do not see too many alerts at the same time. Set it to your own number of candles. On the 3m chart I have it set on 25.
8. All the alerts have been combined into one alert. The buy and sell alerts.
9. I use this on the 3m chart with a 30m Williams %r and a 3H Williams %r. The 30 minute WPR should be enough.
10. This indicator is not designed to catch the tops or bottoms of a trend. It is designed to catch the continuation moves. This indicator need a trending market. The trend is your friend. Do not just take any signal from the indicator, it is best to sell when the higher timeframes are trending down.
11. Use at your own risk. Do your own due diligence before taking a trade and do not rely entirely on this indicator.
12. I have not tested this indicator for repainting.
13. Have fun with the indicator and leave a message and vote it up if you like it.

NoNoiseMA & SlopeHappy trade,
This is a noise-reduced moving average — let's call it the No-Noise MA. A MA where false breakout price action should have little to no impact, while the main trend remains fully represented. In comparison to previous MAs this one's trend appear more linear, and sideways price actions becomes easier to detect thanks to it's unique two filter stages.
In short, the No-Noise-MA (Noise-Reduced Moving Average) is calculated as the cumulative sum of the slopes derived from the center line of the last x pivot points. Let’s break it down step by step:
Pivot Detection:
A pivot algorithm (an adapted variant of the Bilson-Gann-Count method) identifies consecutive pivot points (high, low, high, low, etc.) in the close price series. Let's call this set of Pivots S.
Center Line Calculation:
Out of the set S the last x pivots are used to compute a center line (linear regression line). Always when a new pivot is confirmed, the oldest pivot in the queue is removed, and the new pivot is added.
Slope Extraction:
The center line is defined by its equation shown in the image below
Image 1
Cumulative Slope Sum:
As shown in the image 1 the slope is a series with values around zero. The No-Noise-MA is then just the cumulative sum of the slope series and a correction term. A correction term is needed otherwise the No-Noise-MA would run away over time from the original close price. The correction term is just the deviation between close price and cumulative slope sum multiply with a factor around 0.01 added to the No-Noise-MA.
Noise Reduction:
The goal of noise reduction is done by two filter stages. First Filter is the reduction of the input values. As shown above not all bars close prices are use, instead it uses just the pivot points delivered by the Bilson-Gann-Count method. Favorable the Bilson-Gann-Count method delivers the Pivot points in most cases much faster as other Pivot methods. Already after two bars a new Pivot is confirmed. This takes out all ups and downs between two consecutive Pivots. This first filter stage is legit because all price action in between is hedged by the Pivots.
The second filter stage is the done by the length of the center line. As more pivots are used to calculate the center line as smoother the slope becomes. Out liners just gets less impact if the base is bigger. So the number of involved Pivots has the same meaning as the lengths in any other MA.
Comparison with usual MAs:
For a comparison with other MAs this script also calculate the average lengths of the center line, shown in the upper right chart. So choose for example SMA and set the length parameter to the average length of the center line. As shown in the following image 2.
Image 2
This way both MAs have the same data base and can be objectively compared.
Trend detection:
The slope of the center line can be used for trend confirmation. A slope bigger then zero is an up trend while a slope smaller then zero is a down trend. And side way price action is indicated when the slope is around zero within a certain threshold.
Image 3
One hint should be mentioned here. The side way section gets indicated much later. About the number of bars as the center line is long. Before that there are just up or down trend predicted. In the image 2 you see the slope is firstly tin and as more bars past by the slope becomes more thick. This should indicate the point where no side way predictions will happens anymore.
Variation of calculation
In the settings menu you can find the setting "Include last close to center line". With this activated the center line is calculated with the last pivots and the last close price. The last close price is assumed as a pivot too. This gives the slope a more early reaction to volatile price action. But also brings back some noise.

MA cross by TradingZoneTLS📌 Based on: "Moving Average Cross Alert, Multi-Timeframe (MTF)" by ChartArt
✍️ Modified and customized by TradingZoneTLS
Default settings: EMA 8/34, simplified visuals and alerts.
📞 Contact / Updates:
Telegram: t.me
Please use responsibly and give credit to original author.

21-Day Trend Direction📈 21-Day Trend Direction Indicator
📊 How It Works:
🎯 Trend Detection Logic:
Analyzes last 21 daily candles
Calculates total price change from start to end
Compares against sideways threshold (default 2%)
Counts bullish vs bearish days
Tracks higher highs and lower lows
📈 Trend Classifications:
• 📈 UPTREND: Price change > +2% over 21 days
• 📉 DOWNTREND: Price change < -2% over 21 days
• ➡️ SIDEWAYS: Price change between -2% and +2%
💪 Trend Strength Levels:
• 🔥 Very Strong: >5% price change
• 💪 Strong: 3-5% price change
• 📊 Moderate: 1.5-3% price change
• 📉 Weak: <1.5% price change
🎨 Visual Features:
📋 Information Table Shows:
• Trend Direction with color coding
• Price Change % over 21 days
• Trend Strength classification
• Bull/Bear Days count
• Higher Highs/Lower Lows count
• Analysis Period (customizable)
📊 Chart Indicators:
• Trend Line (21-day moving average)
• Background Color for quick trend identification
• Trend Arrows (▲ ▼ ➡) on chart
• Customizable display options
⚙️ Customizable Settings:
🎯 Analysis Settings:
• Lookback Days: 5-50 days (default: 14)
• Sideways Threshold: 0.5-10% (default: 2%)
• Trend Strength: Low/Medium/High sensitivity
🎨 Display Options:
• Table Position: 9 different positions
• Table Size: Tiny to Large
• Show/Hide: Table, Trend Line, Background, Arrows
🚨 Alert Options:
• Trend Change to Uptrend
• Trend Change to Downtrend
• Trend Change to Sideways
This indicator gives you a clear, objective view of the 21-day trend with multiple confirmation signals! 🚀
