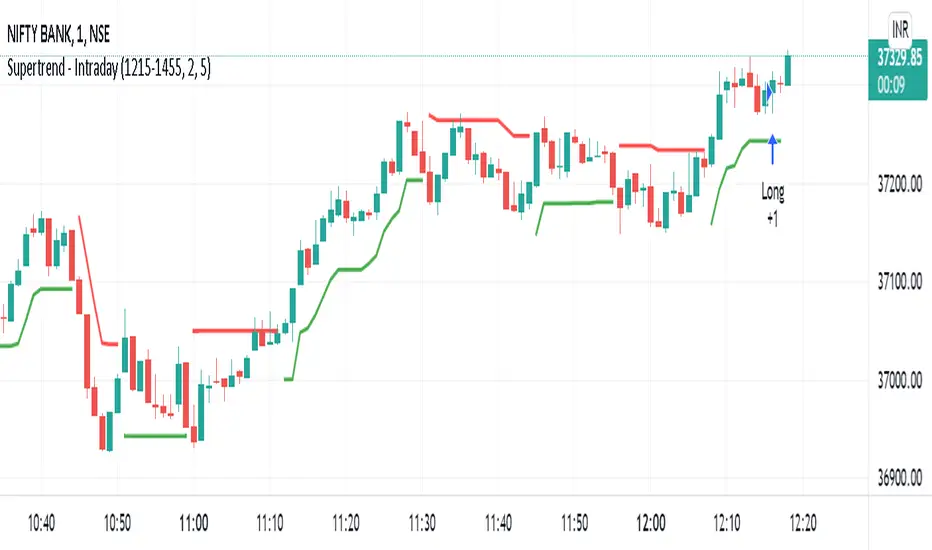
Supertrend - IntradaySupertrend Intraday Strategy
Basic supertrend strategy purpose built for intraday trading. Users can define intraday session during which the strategy will run.
Position is reversed when signal changes by using double quantity. Once the intraday session is over & if the position is open; it is squared off.
Parameters:
Intraday Session - Defines the duration for which the strategy should execute.
Multiplier
ATR Period
M-oscillator
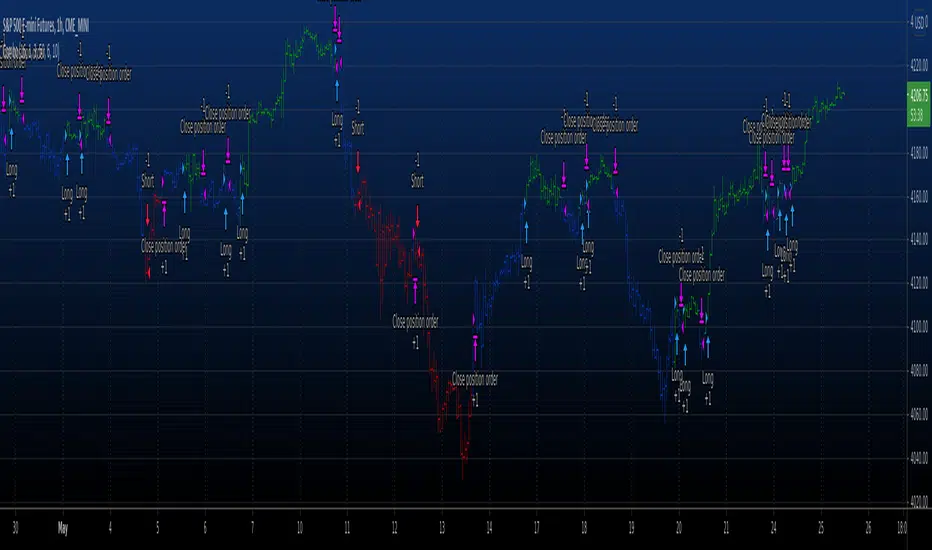
Combo Backtest 123 Reversal & Recursive Moving Trend Average This is combo strategies for get a cumulative signal.
First strategy
This System was created from the Book "How I Tripled My Money In The
Futures Market" by Ulf Jensen, Page 183. This is reverse type of strategies.
The strategy buys at market, if close price is higher than the previous close
during 2 days and the meaning of 9-days Stochastic Slow Oscillator is lower than 50.
The strategy sells at market, if close price is lower than the previous close price
during 2 days and the meaning of 9-days Stochastic Fast Oscillator is higher than 50.
Second strategy
Taken from an article "The Yen Recused" in the December 1998 issue of TASC,
written by Dennis Meyers. He describes the Recursive MA in mathematical terms
as "recursive polynomial fit, a technique that uses a small number of past values
of the estimated price and today's price to predict tomorrows price."
Red bars color - short position. Green is long.
WARNING:
- For purpose educate only
- This script to change bars colors.

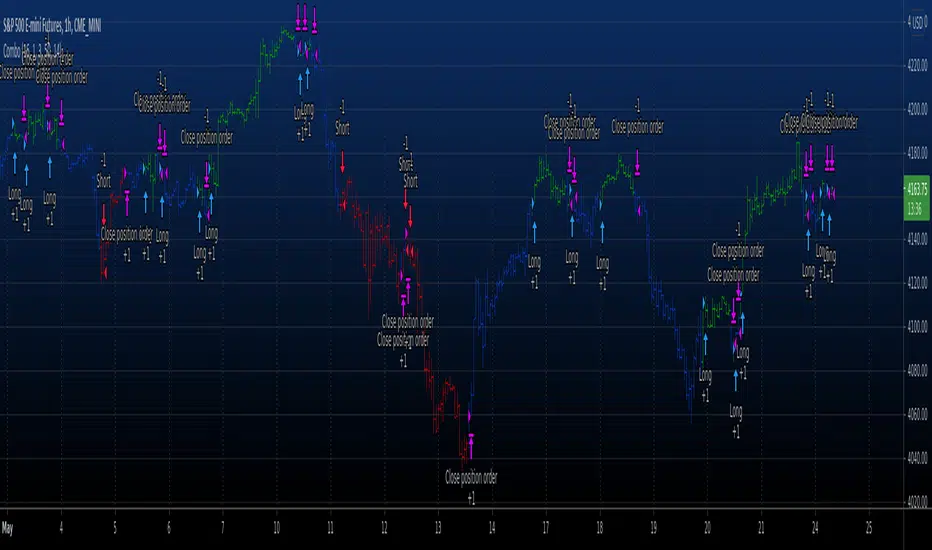
Combo Backtest 123 Reversal & RAVI This is combo strategies for get a cumulative signal.
First strategy
This System was created from the Book "How I Tripled My Money In The
Futures Market" by Ulf Jensen, Page 183. This is reverse type of strategies.
The strategy buys at market, if close price is higher than the previous close
during 2 days and the meaning of 9-days Stochastic Slow Oscillator is lower than 50.
The strategy sells at market, if close price is lower than the previous close price
during 2 days and the meaning of 9-days Stochastic Fast Oscillator is higher than 50.
Second strategy
The indicator represents the relative convergence/divergence of the moving
averages of the financial asset, increased a hundred times. It is based on
a different principle than the ADX. Chande suggests a 13-week SMA as the
basis for the indicator. It represents the quarterly (3 months = 65 working days)
sentiments of the market participants concerning prices. The short moving average
comprises 10% of the one and is rounded to seven.
WARNING:
- For purpose educate only
- This script to change bars colors.
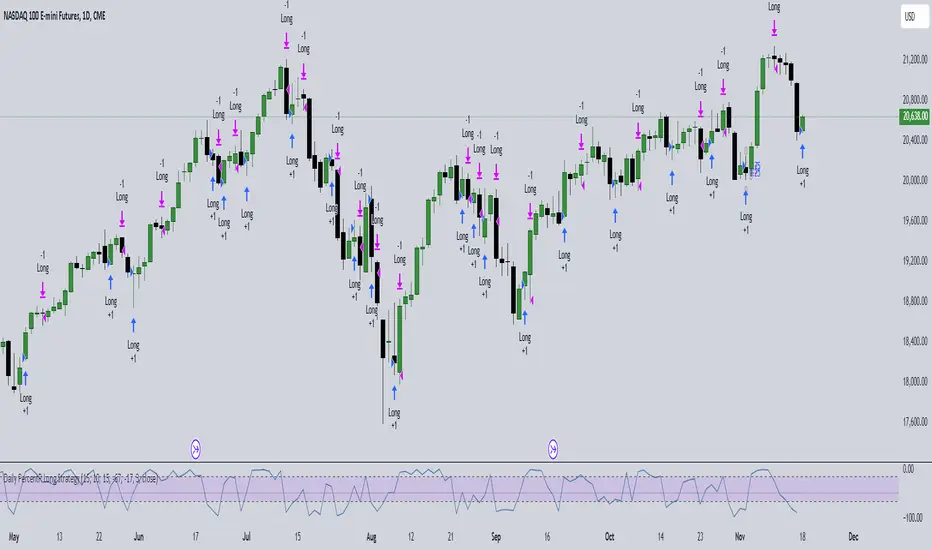
Daily PercentR StrategyThe PercentR strategy from Larry Williams is highly profitable on the daily nasdaq chart
Buy at the open if PercentR Indicator is above –87 and below –20
Exit at the end of the day.
[Sidders] LTFDIV - Strategy version (beta)Strategy version of my previously released LTF divergence scalper. Currently being beta tested prior to full release as a premium indicator.
Description of the indicator: The indicator uses several trades of divergences and overbought/oversold levels (which can be defined) of several indicators on the 1 minute timeframe. Long signals are only given if the overall trend is bullish (determined by either moving averages or the Ichimoku system). Short signals are only given if the overall trend is bearish (determined yet again by either the moving averages or the Ichimoku system).
The strategy contains several additional filters that can be applied to sharpen the strategy and improve overall winrate and profitability. Additionally it contains a multitude of different ways of setting your stoplosses and setting your profit targets. I've also included many other customization options, such as time zones, trading periods and even the possibility to base the entire strategy on Ichimoku (either classic or crypto settings) instead of moving averages. The sky is the limit with regards to customization.
Lastly, but still a major feature: I've included a way to automate the strategy through the use of 3Comma bots. This takes away the need to sit behind your pc and trade the strategy yourself and automates everything after you've set it up properly.
Access to the strategy is currently limited. A full release will follow in the coming week. If you're interested, send me a message and I can more details (e.g. pricing). Cheers!

Simple MACD strategy Simple macd strategy
Rules:
if MACD bullish crosses below 0 and above 200 EMA a buy signal is created
if MACD bearish crosses above 0 and below 200 EMA a sell signal is created
best settings for winrate and profit :
1. is taking 1:1 trades so with a tp of 2% and sl of 2% winrate is around 62%

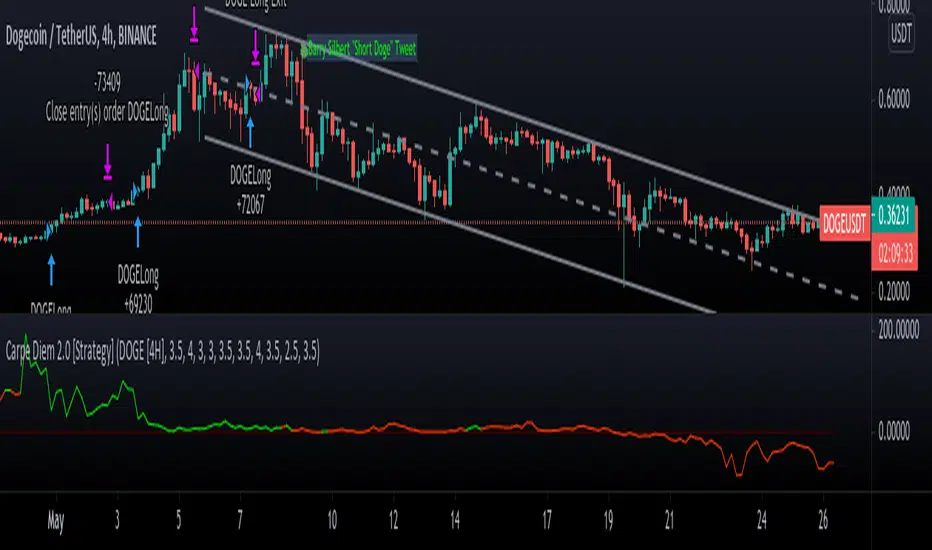
Carpe Diem 2.0 [Strategy]Carpe Diem 2.0 Strategy, Still automating the original Carpe Diem scripts, now the V2 uses heavy Volume based filtering to help only trade in bullish markets,
This strategy script has been created to show backtest results
This script has 10 variations built within it which are fitted for the coins differnt coinditions
The coins included are
DOGE/USDT 4H
XRP/USDT 4H
LINK/USDT 4H
MATIC/USDT 2H
SRM/USDT 6H
COTI/USDT 4H
DOT/USDT 3H
TRX/USDT 4H
RSR/USDT 4H
ATOM/USDT 4H
How to use the Indicator
You can change what plots are shown in the settings Cog, I toggle all plots off apart from the coin I am trading
When the Volume Average line is green, the market is up trending and will be looking for a trade whereas when they are red, the market is in a sideways or downtrend.
You can ignore the color of the line and just base the bullish/bearish bias based of the Volume line being above/below 0
This strategy includes Fees and there is NO Repaint. The script is written in version 4
There is an option in the settings cog to choose from 10 Coins and timeframes which the Strategies have been optimised for and their best timeframes.
There is also another option in the settings cog to change the backtesting range.
There is also another option to adjust the stop loss. I have left it on the Default value which I believe works best
This strategy performs best on the Binance listings
Moriceau_Crypto_strategies_Long_short_indicator_ThesisAfter 3 years of analysis and trading I decided to publish a modify version of my indicator of my thesis. It not a recommandation of trade or an advice it is just for training
The Goal Of this indicator is to avoid sell panic and Maximise drawdown and Money management I used mainly KRAKEN:BCHEUR but you can use it at you own risk on equity or other Crypto
You have the possibility to manage your trade with this indicator and allow you to Buy and Sell (Vente) But also to Short
The Profitability over the past 10 days on 1 min chart 23% against -33 buy and Hold, Over 1 hour candle over the years is 180% against 238% buy and hold. So it is for that you have to use it Mainly on 1 min candles chart.
If you have any question let me know.

Combo Backtest 123 Reversal & Rainbow Oscillator This is combo strategies for get a cumulative signal.
First strategy
This System was created from the Book "How I Tripled My Money In The
Futures Market" by Ulf Jensen, Page 183. This is reverse type of strategies.
The strategy buys at market, if close price is higher than the previous close
during 2 days and the meaning of 9-days Stochastic Slow Oscillator is lower than 50.
The strategy sells at market, if close price is lower than the previous close price
during 2 days and the meaning of 9-days Stochastic Fast Oscillator is higher than 50.
Second strategy
Ever since the people concluded that stock market price movements are not
random or chaotic, but follow specific trends that can be forecasted, they
tried to develop different tools or procedures that could help them identify
those trends. And one of those financial indicators is the Rainbow Oscillator
Indicator. The Rainbow Oscillator Indicator is relatively new, originally
introduced in 1997, and it is used to forecast the changes of trend direction.
As market prices go up and down, the oscillator appears as a direction of the
trend, but also as the safety of the market and the depth of that trend. As
the rainbow grows in width, the current trend gives signs of continuity, and
if the value of the oscillator goes beyond 80, the market becomes more and more
unstable, being prone to a sudden reversal. When prices move towards the rainbow
and the oscillator becomes more and more flat, the market tends to remain more
stable and the bandwidth decreases. Still, if the oscillator value goes below 20,
the market is again, prone to sudden reversals. The safest bandwidth value where
the market is stable is between 20 and 80, in the Rainbow Oscillator indicator value.
The depth a certain price has on a chart and into the rainbow can be used to judge
the strength of the move.
WARNING:
- For purpose educate only
- This script to change bars colors.
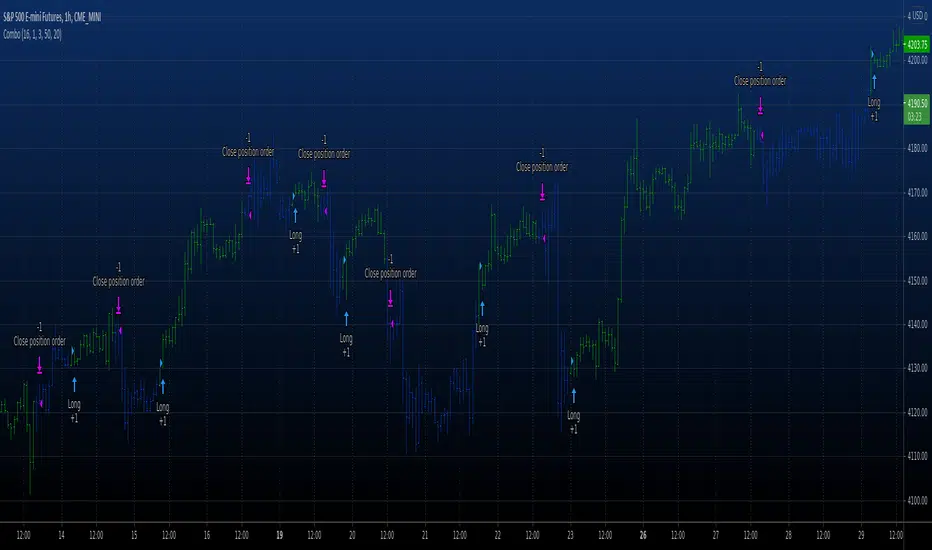
Combo Backtest 123 Reversal & Qstick Indicator This is combo strategies for get a cumulative signal.
First strategy
This System was created from the Book "How I Tripled My Money In The
Futures Market" by Ulf Jensen, Page 183. This is reverse type of strategies.
The strategy buys at market, if close price is higher than the previous close
during 2 days and the meaning of 9-days Stochastic Slow Oscillator is lower than 50.
The strategy sells at market, if close price is lower than the previous close price
during 2 days and the meaning of 9-days Stochastic Fast Oscillator is higher than 50.
Second strategy
A technical indicator developed by Tushar Chande to numerically identify
trends in candlestick charting. It is calculated by taking an 'n' period
moving average of the difference between the open and closing prices. A
Qstick value greater than zero means that the majority of the last 'n' days
have been up, indicating that buying pressure has been increasing.
Transaction signals come from when the Qstick indicator crosses through the
zero line. Crossing above zero is used as the entry signal because it is indicating
that buying pressure is increasing, while sell signals come from the indicator
crossing down through zero. In addition, an 'n' period moving average of the Qstick
values can be drawn to act as a signal line. Transaction signals are then generated
when the Qstick value crosses through the trigger line.
WARNING:
- For purpose educate only
- This script to change bars colors.
SignalCAVE Strategy BuilderYou can create strategies without writing single line of Pine Script code!
Do backtesting, set alerts and explore algorithmic trading with using SignalCAVE Strategy Builder on TradingView.
SignalCAVE Strategy Builder for TradingView
SignalCAVE is a tool that help you to create strategies in TradingView. SignalCAVE offers flexible strategy builder panel enabling users to backtest and set alerts with custom conditions (selected indicators and parameters).
CAPABILITIES
You can define rules and conditions for “Long” and “Short” signals.
“Stop Loss” or “Take Profit” functions can be activated with providing percentage values.
“Only Long”, “Only Short” or both “Long and Short” signals can be used at the same time.
Available Indicators
EMA, SMA, WMA, HMA, RSI, MACD, Stochastic, Bollinger Bands, SuperTrend, Parabolic SAR, DMI, ATR, CCI, CMF, ROC, Ichimoku, OHLC Prices
How to Set Strategy Rules?
On SignalCAVE strategy settings screen, there are four types of input groups. You can populate these input boxes based on your strategy.
A: First indicator’s parameter and index value selection area
First Input: First indicator selection.
Second Input: First indicator’s parameter selection. If you want to use default parameters, select “Default Parameters”. If you want to use custom parameters, select “Custom Parameters”. If your selection was custom, then you need to fill “P:A” input boxes to assign your custom parameter.
Third Input: First indicator’s index selection. Default parameter is “0”, If you want to get previous value of indicator/price, you can type positive numbers.
?: Condition and Interval selection area.
You can select “Upper (>), Lower (<), Upper or Equal (>=), Lower or Equal (<=), CrossOver (⬆), CrossUnder (⬇)” conditions and time frame interval for calculation both first (A:) and second (B:) indicator.
B: Second indicator’s parameter and index value selection area
First Input: Second indicator selection.
Second Input: Second indicator’s parameter selection. You may use either default parameters, or custom parameters. If your selection was custom, then you need to fill “P:B” input boxes to assign your custom parameter.
Third Input: Second indicator’s index selection. Default parameter is “0”, If you want to get previous values of indicator/price, you can type positive numbers.
P:A First indicator’s custom parameter settings. If selected indicator has less then four parameters, you can fill unnecessary fields with “0” value.
P:B Second indicator’s custom parameter settings. If selected indicator has less then four parameters, you can fill unnecessary fields with “0” value.
DASHBOARD
After you build the strategy with SignalCAVE, you can see rules and conditions on dashboard with chart view screen.
Hint: By adding multiple times of SignalCAVE strategy on your chart screen, you can build more then one strategy.
STRATEGY TESTER / BACKTEST RESULTS
You can see strategy backtest results from “Strategy Tester” panel.
By changing parameters or strategy rules (strategy optimization), you may get better results. These results does not guarantee a success for future trades.
ALERT SETTINGS
If you want to get notify about your strategy outputs (Long Entry, Long Exit, Short Entry, Short Exit, Stop, Take Profit) you can set an “Alert”.
You can click “Alert” button to create a new alert. Make sure on “Conditions” selection must be “SignalCAVE” strategy.
Paste to “Message” field exactly the text below.
{{strategy.order.alert_message}}
Hint: By setting a single alarm, you can get notifications for all outputs.
Do your alerts modifies when you change the strategy conditions or parameters?
While the strategy got updated, its alerts still use the strategy’s state from the time when we made the alert (TradingView Wiki, 2018b).
This has the advantage that, once we made a script alert, we can change the script’s input options, change chart settings, or remove the script from to the chart. All of that won’t affect our existing alert. That gives a lot of flexibility to keep interacting with the chart and script.
But there’s also a disadvantage: if we do want our script’s alerts to change, we first need to remove the existing alerts. Then we have to create and configure new alerts based on the indicator’s updated code or settings.


RatingsThis strategy script is a modified version of the built-in 'Technical Ratings' strategy script.
English:
www.tradingview.com
Russian:
www.tradingview.com
Changes:
1) Added option to disable long and short positions (checkboxes 'Long' and 'Short').
2) Added date selection option.
3) The default commission is 0.1% (original 0%).
4) 100% of capital is used by default (5% in the original version).

Dankland Playground Moneymaker - V2“version 2” of my playground bot script. Its essentially a powerhouse suite of strategies. Although it is similar to the previous script, it nets different results as sections have been changed. Such as the somewhat reluctant removal of the Chande Momentum... The RSIs have also been updated, this was one of the main changes. RSIS now include a Moving Average cross of RSI to generate signals above and below the given thresholds instead of simply on crossing a threshold. This should give greater functionality overall. Most functions including Moving Averages have been updated to include a wider range of kinds of moving averages. This includes not just the moving average cross, but MACD and RSIs as well. I tried to perform the same upgrade on the %B, Stochastics and SMI, but hit the unpacked code limit of 60,000 lines... So, more “versions” will have to come for future “upgrades”, with the recognition that there will be cases where the old, “downgraded” versions may perform better and that some people (like myself) may continue to use them on some markets until I/we devise superior settings on the new ones for said markets. For instance, instead of replacing my 1 hr BTCUSD bot (where I used the now deleted Chande to pretty pleasing affect...) I made a new one for LINKUSD 10 min so I can have both running for now and work on replacing the BTCUSD later.
How it works basically is this... you have 16 oscillators which can all be used as independently as you wish. They can be split up into different groups or ran all together.
When in separate groups they should not be able to sell eachothers positions without triggering a full stop loss by turning the Independence/Stop All switches on. Every single oscillator has its own entry and exit position sizing which can be stated as either a percent of balance or a flat amount of contracts (or both combined). Each oscillator has a minimum amount of profit you can tell it to sell it, which is calculated from the average cost of your current position, which does include all groups. This works out to help you average out better entry and exit prices, essentially a method of DCAing.
You can set the minimum sale amount, which is to keep it from placing orders below your exchanges minimum dollar trade cost.
All this functionality combined also ensures more accurate back tests by ensuring that the script simply cannot spend money it doesn't see as in the balance, whereas other scripts will use a percentage of equity, and once 100% of your equity is in BTC for instance, it will keep buying more BTC for free and thus spoof up backtest numbers. If you look through the strategies here, many people claim to have amazing scripts and then you look into it and this is happening and skewing their numbers. These people are either very ignorant or what they made or scam artists and trolls in my opinion.
This version also includes On Bar Close switches for each oscillator. When switched on, signals are only allowed to generate on Bar Close. This helps to prevent retriggering from live signals, which when you are running this many oscillators, will become a problem! However, in most cases, you do not need to generate signals intrabar, as backtests will show, ignoring intrabar buys and sells (intrabar stop losses can still be very important though!) won't exactly keep you from high profitability strategies, but rather, allowing elements of chaos from live indicators moving up and down intrabar will, in fact, drift your actual results further and further from the backtest. You want an accurate backtest though. So choose wisely when you turn these off and you will do better.
The included oscillators are as follows:
NO MORE Chande Momentum cross – REMOVED – I was hitting PINE code limits here so I had to make choices and this one simply had to go. Begone!
Moving Average Cross
MACD cross
%B Bollinger cross
Stochastic cross + region filter
Stochastic RSI cross + region filter
SMII cross and region filter
Three RMIs
Know-Sure-Thing line-cross
Coppock Curve line-cross
TRIX line-cross
RSI of MA w/ MA cross
RSI of MA of KST w/ MA cross
RSI of MA of Coppock Curve w/ MA cross
RSI of MA of Trix w/ MA cross
So the idea is that this is essentially multiple strategies combined into one backtestable house. Balance is calculated for all position sizes in order to try to prevent false entries that plague so many scripts (IE, you set pyramiding to 2, each buy $1000, initial balance $1000, and yet it buys two orders off the bat for $2000 total and nets 400% profit because the second was considered free, happens on 90+% of scripts on Tradingview if you aren't very very careful!)
You tune each indicator and position size them so that they work together as well as you can and in doing so you are able to create a single backtest that is capable of running a bot, essentially, between multiple strategies - you can run a slower Moving Average cross, a faster SMI cross or MACD , or Bollinger that grabs big moves only, all the while having MACD trade small bonuses along the way. This way you can weight the Risk to Reward of each against eachother.
I will not try to claim this is something you can open and with no work have the best bot on the planet. This scripts intention is to take a lot of relatively common trading strategies and combine them under on roof with some risk management and the ability to weigh each against eachother.
If you are looking for a super advanced singular algorithm that tries to capture every peak and valley exactly on the dot, this is not for you. If you are looking for a tool with a high level of customizability, with a publisher who intends to update it to the best of his ability in accordance to seeking to make the best product that I personally can make for both myself and the community (because I will be using this myself of course!) that was specifically designed with the intention of performing well in spot markets by averaging low entry costs and high exit costs, this is for you! That is the exact intention here. It can certainly work with margin, but you will have to take extra care in setting your stop losses. I intend to make a version capable of going short which will be included as part of the package. It may take some work to keep all of the risk management working as well for shorts though. There will be more scripts added to the “package” as I hit the limit on this one a few times and have had to keep some ideas out already.
The current backtest shown is hand-optimized by myself for Link /USD 10min market (Binance US – shouldn't need much work to fit to other exchange markets) with multiple stop losses.

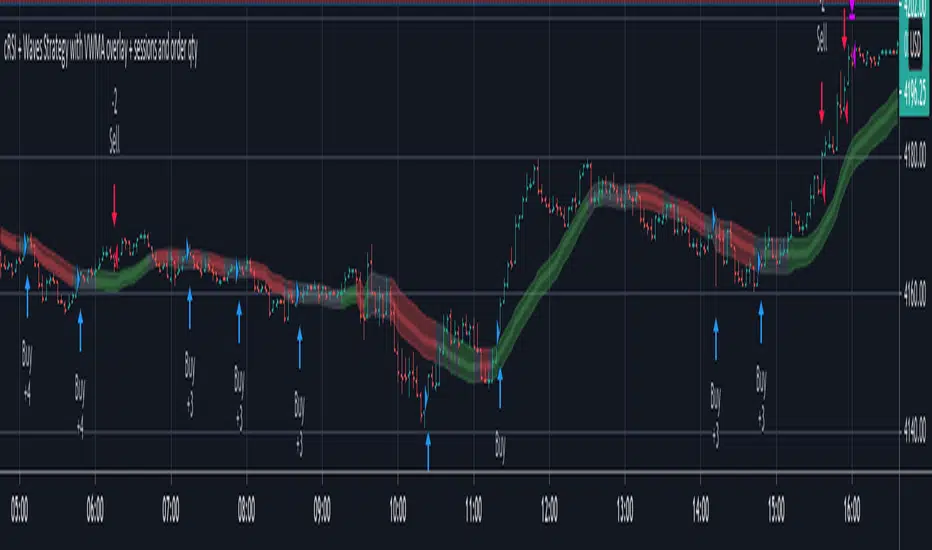
cRSI + Waves Strategy with VWMA overlay + sessions and order qtyThis is a fork of the cRSI + Waves Strategy with VWMA overlay strategy by Dr_Roboto , which adds two additional features, namely:
the ability to limit trade signals to certain defined periods of time ("Sessions") during the trading day and, optionally, to close any open position at the end of either or both "Sessions"
the ability to control the maximum order size suggested by the strategy on the "Inputs" tab of the strategy's "Settings" window
If you are trading on a daily chart (or longer) you must disable the Limit Signals to Trading Sessions? option in order for the strategy to produce signals.
All other features are identical to the original strategy (revision 2.0).
Jaws Mean Reversion [Strategy]This very simple strategy is an implementation of PJ Sutherlands' Jaws Mean reversion algorithm. It simply buys when a small moving average period (e.g. 2) is below
a longer moving average period (e.g. 5) by a certain percentage and closes when the small period average crosses over the longer moving average.
If you are going to use this, you may wish to apply this to a range of investment assets using a screener for setups, as the amount signals are low. Alternatively, you may wish to tweak the settings to provide more signals.
Context can be found here:
LINK

Wave Trend w/ VWMA overlayThis is a trend-following strategy and indicator which combines the Wave Trend Strategy (Lazy Bear) by thomas.gigure with the cRSI + Waves Strategy with VWMA overlay by Dr_Roboto .
You may update the parameters of the Wave Trend oscillator or the VWMA indicator to match your own preferences. You may also adjust the Base Quantity used for determining trade size (as described below) to suit your account size and risk tolerance.
The strategy identifies potential signals based on the on the Wave Trend oscillator, originally ported to TradingView by LazyBear. When a signal is produced by the Wave Trend oscillator, trade size is determined by the VWMA.
When the VWMA is trending against the direction of the Wave Trend signal, Base Quantity x 1 is used
When the VWMA is trending neutral, Base Quantity x 2 is used
When the VWMA is trending with the direction of the Wave Trend signal, Base Quantity x 4 is used
The strategy includes the ability to limit trade signals to certain defined periods of time ("Sessions") during the trading day and, optionally, to close any open position at the end of either or both "Sessions." This may be enabled/disabled via the Limit Signals to Trading Sessions? option on the "Inputs" tab of the strategy's "Settings" window.
If you are trading on a daily chart (or longer) you must disable the Limit Signals to Trading Sessions? in order for the strategy to produce signals.

Sentiment OscillatorPrice moves when there are more market takers than there are market makers at a certain price (i.e. price moves up when there are more market buys than limit sells and vice versa). The idea of this indicator is to show the ratio between market takers and market makers in a way that is intuitive to technical analysis methods, and hopefully revealing the overall sentiment of the market in doing so. You can use it in the same way you would other oscillators (histogram crossing zero, divergences, etc). The main difference between this and most volume-weighted indicators is that the price is divided by volume instead of multiplied by it, thus giving you a rough idea of how much "effort" it took to move the price. My hypothesis is that when more volume is needed to move the price, that means bulls and bears are not in agreement of what the "fair price" should be for an asset (e.g. if the candle closes only a bit higher than its open but there's a huge spike in volume, that tells you that a majority of the market are starting to think the price is too high and they've started selling).
Methods of Calculation
1. Price Change Per Volume
The main method this indicator uses to reveal market sentiment is by comparing price change to the volume of trades in a bar.
You will see this calculation plotted in its most basic form by ticking the "Show Bar per Bar Change/Volume" box in the inputs dialog. I personally found that the plots were too noisy and cannot be used in real time reliably due to the fact that there is not much volume at the open of a new bar. I decided to leave in the option to use this method, in case you'd like to experiment with it or get a better grasp of how the indicator works.
2. Exponential Moving Averages
In my quest to smooth out the plotted data, I experimented with exponential moving averages. Applying an EMA on the change per volume data did smooth it out a bit, but still left in a lot of noise. So I worked around it by applying the EMA to the price change first, and then dividing it by the EMA of the volume. The term I use for the result of this calculation is "Market Sentiment" (do let me know if you have a better-fitting term for it ;-)), and I have kept it as an option that you can use in the way you would use other oscillators like CMF, OBV, etc. This option is unticked by default.
3. MACD
I left "Market Sentiment" unchecked as the default option because I thought an easier way to use this indicator would be as a momentum indicator like the MACD . So that's what I turned it into! I applied another EMA on the Market Sentiment, added a slower EMA to subtract from the first, and now we have a MACD line. I added a signal line to subtract from the MACD , and the result is plotted as a histogram... ish . I used area instead of columns for plot style so you don't get confused when comparing with a regular MACD indicator, but you can always change it if an actual histogram is more your taste.
The "histogram" is the main gauge of sentiment change momentum and it is easiest to use, that is why it is the only calculation plotted by default.
Methods of Use
As I have mentioned before, you can use this as you would other oscillators.
-The easiest way to use this indicator is with the Momentum histogram, where crosses over 0 indicate increasing bullish sentiment, and crosses below 0 indicate increasing bearish sentiment. You may also spot occasional divergences with the histogram.
-For the Market Sentiment option, the easiest way to use it is to look for divergences.
-And if you use the "Price Change per Volume of Each Bar", well... I honestly don't know. I guess divergences would be apparent towards the close of a bar, but in realtime, I don't recommend you use this. Maybe if you'd like to study the market movement, looking at historical data and comparing price, volume , and Change per Volume of each bar would come in handy in a pseudo-tape-reading kind of way.
Anyway, that's my explanation of this indicator. The default values were tested on BTC/USDT (Binance) 4h with decent results. You'll have to adjust the parameters for different markets and timeframes.
I have published this as a strategy so you can test out how the indicator performs as you're tweaking the parameters.
I'm aware that the code might not be the cleanest as I have only started learning pine (and code in general) for about a month, so any suggestions to improve the script would be appreciated!
Good luck and happy trading :-)

Simple way to BEAT the market [STRATEGY]This script has been created to demonstrate the effectiveness of using market regime filters in your trading strategy, and how they can improve your returns and lower your drawdowns
This strategy adds a simple filter (A historical volatility percentile filter, an implementation of which can be found on my trading profile) to a traditional buy and hold strategy of the index SPY.
Note, There are other filters that could also be added including a long-term moving average/percentile rank filter/ADX filter etc, to improve the returns further.
The filter closes our long position during periods of volatility that exceed the 95th percentile (or in the top 5% of volatile days) and buys back when the volatility is below 95% rank of the past 100 days
Have included the backtest results since 1993 which is 28 years of data at the time of writing. Comparison of traditional buy and hold with this modified strategy can be found below:
Traditional buy and hold:
Return per year: 7.95 % (ex Dividends)
Total return: 851.1 %
Max drawdown: 50.79 %
'Modified' buy and hold (this script):
Return per year: 9.92 % (ex Dividends)
Total return: 1412.2 %
Max drawdown: 31.57 %
Feel free to use some of the market filters in my trading profile to improve and refine your strategies further, or make a copy and play around with the code yourself. This is just a simple example for demo purposes.

Strategy - DMI Indicator with DPO Indicator as a GuardThe Directional Movement Index Indicator is one of my favorite indicators in tradingview's built-in library. It is free to use for all
For more information on what the DMI is, please visit: www.tradingview.com
The only problem I've come across with the DMI is that when it hits a 'trade range zone' it triggers false new trends (this is the case with almost every indicator I've ever tested).
This script modifies the DMI by removing the need for the ADX logic. It only focuses on the +DI and the -DI.
In order to remove the 'noise' generated during a trade range zone I have added another powerful indicator called the Detrended Price Oscillator.
The DPO is also a 'built-in' indicator on tradingview. www.tradingview.com
The DPO is used in conjunction with the DMI to stop trade ranges from wrecking your profits.
This strategy logic simply checks for the DMI indicator to cross itself. If the +DI crosses over the -DI this is a bullish cross and visa versa, if the -DI crosses over the +DI then it could mean bearish sentiment is building.
But then strategy logic uses the DPO to check if the DPO is above 0 or below 0 value
If the +DI crosses over the -DI and the DPO is above 0 value, then it's a Long entry point.
However, if the +DI crosses over the -DI and the DPO is below 0 value, then the Long signal is void.
And visa versa, if the -DI crosses over the +DI and the DPO is below 0 value, then it's a Short entry point (unless the DPO is greater than 0)
With this DPO 'guard' in place, it helps us keep the total trades executed to a minimum.
This is vital to push through trade ranges that can wreck your profit potential.
I wish I could create a better plotting mechanism for this indicator so you can better see the visuals. But combining the DMI to scale with the DPO is not possible.
The best solution is to simply add another DMI indicator to your chart so you can compare the DMI to this script that is dominated by the DPO (yellow line).
Enjoy! Likes are much appreciated!

DRSI DMA Scalping Strategy No RepaintThis strategy compares the slope of a Moving Average (of your choosing) to the slope of a Momentum Indicator (of your choosing). Zero is the center line because 0 slope means sideways movement. When both lines cross your buy threshold, it buys. When both lines cross your Sell threshold, it sells. The lines may look choppy, but that is probably because it is referencing a different timeframe than what the chart is set to. I left as many settings adjustable by the user as possible so you can tune this strategy to the relative behavior of whatever you are trading.
This also includes a No Repaint function so the backtest should be as close to live trading as possible.

Combo Backtest 123 Reversal & Psychological line This is combo strategies for get a cumulative signal.
First strategy
This System was created from the Book "How I Tripled My Money In The
Futures Market" by Ulf Jensen, Page 183. This is reverse type of strategies.
The strategy buys at market, if close price is higher than the previous close
during 2 days and the meaning of 9-days Stochastic Slow Oscillator is lower than 50.
The strategy sells at market, if close price is lower than the previous close price
during 2 days and the meaning of 9-days Stochastic Fast Oscillator is higher than 50.
Second strategy
Psychological line (PSY), as an indicator, is the ratio of the number of
rising periods over the total number of periods. It reflects the buying
power in relation to the selling power.
If PSY is above 50%, it indicates that buyers are in control. Likewise,
if it is below 50%, it indicates the sellers are in control. If the PSY
moves along the 50% area, it indicates balance between the buyers and
sellers and therefore there is no direction movement for the market.
WARNING:
- For purpose educate only
Jigga - Heatmap ComparisionHi All,
I always have a question on how to know which sector is performing. I have created this Heatmap comparison to know strength of sector.
I have used RSI and MACD calculation and put it across 5 different index. Color shows bullishness and Gray shows weakness.
You can select RSI or MACD or Both to have calculation. And you can also compare stocks if you want.
Note: Use it for Medium / Long term investment. Can not be use for Intraday.
Happy investing !!
