[_ParkF]RSI (+ichimoku cloud)RSI
Typical RSI indicators were plotted with candles and expressed wick to resemble a candle chart,
and linear regression was added to predict changes in force intensity,
which allowed us to confirm support and resistance within linear regression .
In addition, divergence signal was marked as an additional basis for the price fluctuation point due to support and resistance .
In other words,
if the diversity signal appears together when the rsi candle is supported and resisted within linear regression ,
this is the basis for predicting that it is a point of change in the existing trend.
Finally, the period value and standard deviation of linear regression can be arbitrarily modified and used.
I hope it will help you with your trading.
--------------------------------------------------------------------------------------------------------------------------------------------------------------
(+ichimoku cloud)
Clouds made of the preceding span 1 and the preceding span 2 of the balance table can predict the trend by displaying the current price balance ahead of the future.
In addition to the role of clouds in the above-described balance sheet, this indicator also shows the cloud band support and resistance of the current RSI value.
일반적인 RSI 지표를 캔들화 하였고 꼬리까지 포함하여 캔들 차트와 유사하게 표현 하고,
캔들화한 RSI 지표에 선형회귀(채널)를 추가 하여 RSI 지표 특유의 힘의 강도의 변화를 지지와 저항으로 확인할 수 있게 해봤습니다.
또한 다이버전스 신호를 추가하여 선형회귀(채널)로 인한 지지와 저항에 따른 가격 변동의 근거로 삼을 수 있습니다.
즉, 선형회귀(채널) 안에서 RSI 캔들이 지지와 저항을 받을 때 다이버전스 신호가 함께 나타난다면 이는 기존 추세의 변화 지점임을
예측해 볼 수 있는 근거가 됩니다.
마지막으로 선형회귀(채널)의 기간값과 표준편차는 임의로 수정하여 사용할 수 있습니다.
당신의 트레이딩에 도움이 되었으면 합니다.
--------------------------------------------------------------------------------------------------------------------------------------------------------------
(+일목균형표의 구름)
일목균형표의 선행스팬1과 선행스팬2로 만들어진 구름은 현재 가격의 균형을 미래에 선행하여 표시하여 추세를 예측해볼 수 있습니다.
본 지표에서는 위에서 설명한 일목균형표의 구름의 역할과 더불어 현 RSI 값의 구름대 지지, 저항 또한 확인해볼 수 있습니다.
* I would like to express my gratitude to zdmre for revealing the linear regression source.
Nuvem de Ichimoku

SuperIchi [LuxAlgo]Using one indicator as the core for another one to improve certain aspects while offering an alternative user interaction can be very interesting in technical analysis.
This indicator is a modification of the popular Ichimoku indicator using the equally popular Supertrend indicator as its core, thus no longer entirely relying on calculations done over a fixed window size but instead relying on the average true range and the trend detection method offered by the Supertrend.
Settings
Tenkan: Atr length (left) and factor (right) used for the Supertrend involved in the calculations of the Tenkan Ichimoku component
Kijun: Atr length (left) and factor (right) used for the Supertrend involved in the calculations of the Kijun Ichimoku component
Senkou Span B: Atr length (left) and factor (right) used for the Supertrend involved in the calculations of the second Senkou Span Ichimoku component
Displacement: Bar offset of the cloud (positive offset) and Chikou (negative offset)
Usage
The SuperIchi indicator can be interpreted similarly to a regular Ichimoku as it retains the components and aspects from this one. Users can make use of the Supertrend Factor to detect shorter or longer-term trends.
Unlike the regular components of the Ichimoku based on rolling maximums/minimums, using the Supertrend here allows smoother components and makes it less prone to whipsaw signals.
Note that the Chikou is disabled by default in the style settings
Details
The original Ichimoku indicator is constructed from the average between the rolling maximum high and minimum low values. The Supertrend indicator also relies on one upper/lower extremity but using the average of these extremities for the modification of the Ichimoku indicator might not provide easy to use results due to the nature of these extremities.
Instead, we compute the average between the Supertrend and trailing maximums/minimums with a value reset when a new trend is detected by the Supertrend. This allows obtaining a result that is closer to the original average used by Ichimoku.

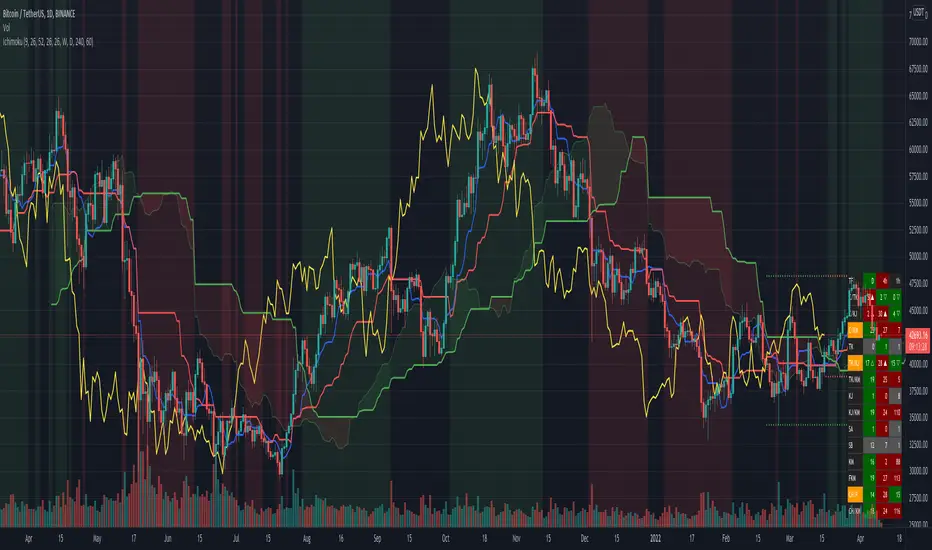
Ichimoku + Forecast + SignalsIchimoku Kinko Hyo (IKH) (Japanese一目均衡表, Ichimoku Kinkō Hyō), usually shortened to "Ichimoku", is a technical analysis method that builds on candlestick charting to improve the accuracy of forecast price moves. - From Wikipedia, the free encyclopedia
This indicator is enhanced with the following helpful features:
Tenkan-sen, Kijun-sen, Senkou Span A and Senkou Span B 5 days forecast
identified bullish (green color), bearish (red color), or flat/within (gray color) signals including the number of days it accrued from the last bar and the place of appearance (▲ - above bullish Kumo, △ - above bearish Kumo, ◆ - within bullish Kumo, ◇ - within bearish Kumo, ▼ - bellow bullish Kumo, ▽ - bellow bearish Kumo)
lines indicating the range of the Tenkan-sen, Kijun-sen, and Senko Span B calculations (we can easily identify the highest-high and the lowest-low of the range and how long it will persist)
Signals description:
C/TK - bullish/bearish Close/Tenkan-sen cross
C/KJ - bullish/bearish Close/Kijun-sen cross
C/KM - bullish/bearish/within Close/Kumo cross
TK - bullish/bearish/flat Tenkan-sen
TK/KJ - bullish/bearish Tenkan-sen/Kijun-sen cross
TK/KM - bullish/bearish/within Tenkan-sen/Kumo cross
KJ - bullish/bearish/flat Kijun-sen
KJ/KM - bullish/bearish/within Kijun-sen/Kumo cross
SA - bullish/bearish/flat Senkou Span A
SB - bullish/bearish/flat Senkou Span B
KM - bullish/bearish Kumo
FKM - bullish/bearish future Kumo
CH/P - bullish/bearish Chikou Span/Price cross
CH/KM - bullish/bearish/within Chikou Span/Kumo cross
Senkou/Tenkan/Kijun Higher Time FrameHi alls,
this indicator is based on Ichimoku indicator and improve the basic indicator Tenkan/Kijun Higher Time Frame extending up to 7 higher time frames (instead of 5) and plotting also Senkou Span A and Senkou Span B in each of highet time frames.
It aids traders Trend Following to have in a look Tenkan sen and Kijun sen of 7 Higher Time Frame on your chart.
Everyone can choose its Time Frame preferred and change Time frames set for default.
Tipically on chart 1M, 3 M, 5M is useful to visualize on the chart Tenkan sen, Kijun Sen, Senkou A and B of Higher Time Frames (15M, 30M, H1, H4, D, W, M).
To have the best view of graph is better use only a set of all options available (activate only the lines useful for your trading)
Tenkan, Kijun sen and Senkou spans are the most important Support and Resistance levels for Ichimoku so I hope this indicator can aid you for your analysis.
Enjoy it!

Tenkan/Kijun Higher Time FrameHi alls,
this indicator is based on Ichimoku indicator.
It aids traders Trend Following to have in a look Tenkan sen and Kijun sen of 5 Higher Time Frame on your chart.
Everyone can choose its Time Frame preferred and change Time frames set for default.
Tipically on chart 1M, 3 M, 5M, 5M and 30M (or lowers...) are useful to visualize on the chart Tenkan sen and Kijun Sen of Higher Time Frames (H1, H4, D, W, M).
Tenkan and Kijun sen are the most important Support and Resistance levels for Ichimoku so I hope this indicator can aid you for your analysis.
Enjoy it!

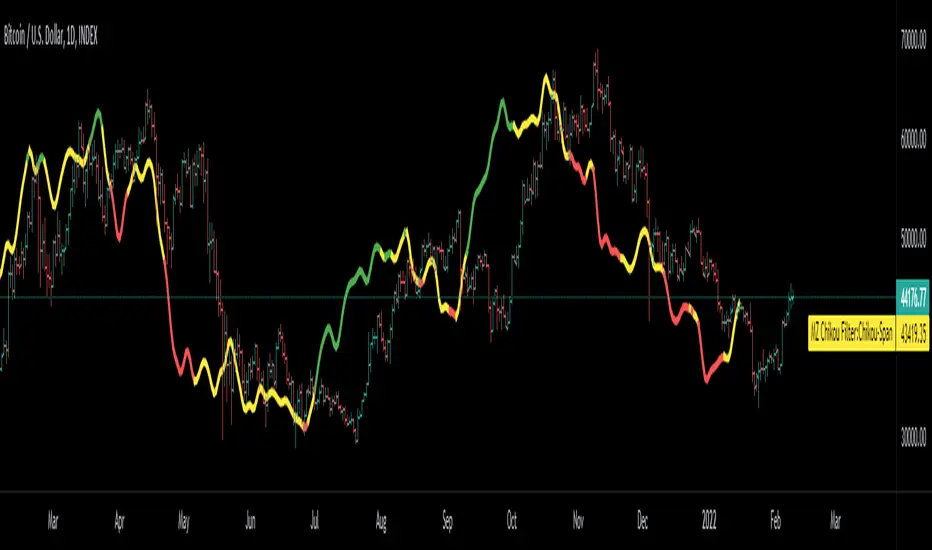
Chikou Filter for Ichimoku CloudThis Indicator enhances functionality of Chikou-Span from Ichimoku Cloud using a simple trend filter.
Methodology
Chikou is basically close value of ticker offset to close and it is a good for indicating if close value has crossed potential Support/Resistance zone from past. Chikou is usually used with 26 period.
Chikou filter uses a lookback length calculated from provided lookback percentage and checks if trend was bullish or bearish within that lookback period.
Bullish : Trend is bullish if Chikou span is above high values of all candles within defined lookback period. Green color shows bullish trend.
Bearish: Trend is bearish if Chikou span is below low values of all candles within defined lookback period. This is indicated by red color.
Reversal / Choppiness : White color indicates that Chikou are swinging around candles within defined lookback period which is an indication of consolidation or trend reversal.
Default Settings
Different source types are included but I've found that (OHLC4+High+Low)/3 is better for Chikou and Symmetrically Weighted Moving Average (SWMA) is also applied but it produce some repainting though. Default period is set to 26 and lookback percentage is 50%. Low percentage would decrease filter's efficiency.
Usage
This filter can be used to check if Chikou crossover has occurred in past. This can be used with Donchain channels, Bollinger Bands or any Moving Average as replacement of High / Low values. I'll use this indicator in all my Ichimoku Cloud studies especially adaptive ones. Filter outputs in Color and Integer format; both can be used as signals definitions.
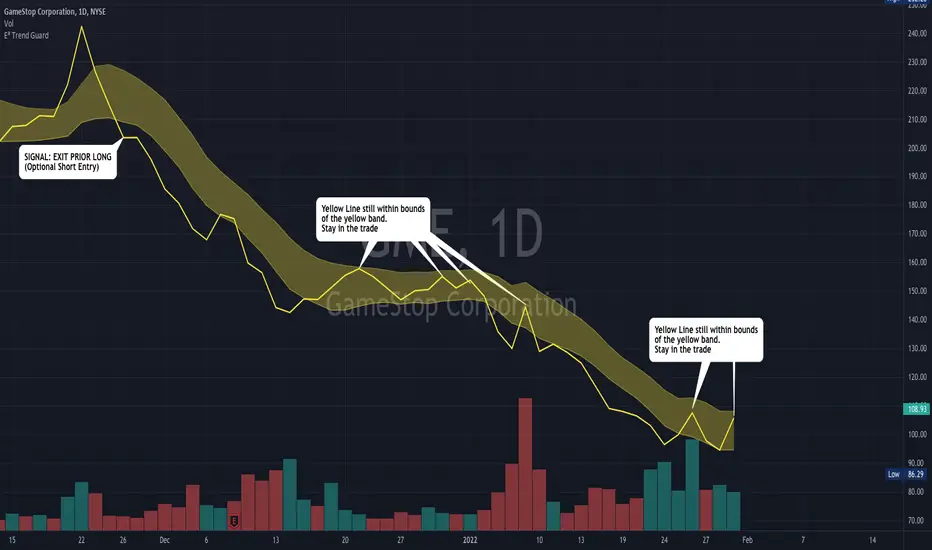
E³ Trend GuardWe all need help staying in trades as long as possible, buckling down through those pesky pullback and consolidation periods, and this script really helps you gain some better insight!
The TREND GUARD indicator is great for keeping you in trending trades through pullbacks and short consolidations. It is a STOP INDICATOR and helps you with your exits. It can work for Swing Trading on strongly trending stocks ( bullish and bearish ) as well as help you on intraday trades of the same. It can also be used to gain insight for entries (see below).
HOW TO USE:
FOR EXITS:
Once you've entered a trending stock that may be providing Alpha (excess returns or depreciation vs the market), you can use the strong Yellow line that is behind the candlesticks (see TIP #1 below) to keep you in your trade or inform you of when you should think about exiting. What you are looking for, is for the yellow line to not cross over to the other side of the yellow band from the "trending side" of your trade. In other words, when price is running up the band, similar to trading Bollinger Bands , or above the band, and the band is curving up or running upward as well, that can be considered "in trend" and LONG ( bullish ) in direction. The converse is true for "in trend" SHORT ( bearish ) direction.
FOR ENTRIES:
It wasn't built for entries, but users are reporting good results for using it for entries. The best technique for entry appears to be to allow the band to run sideways during a consolidation, then enter on the side where a strong breakout/down candle or price occurs through to outside the yellow band. This is very similar and indeed somewhat corresponds to entering breakouts of bases (sideways consolidation areas).
TIP
In order to see the strong yellow line (looks like a thread behind the candlesticks ), you have at least three choices:
Change your charts to LINE type on the CLOSE pricing;
Point at the indicator on the chart and it will highlight it and the line that is behind the Candlesticks will come forward
On the Data Information pane you can toggle HIDE candlesticks to see it more clearly
THE MECHANICS:
So what's going on behind the scenes here?
Instead of the traditional statistical band approach like Bollinger, or Keltner, or ATR bands, which all spread out from a "center line" (calculated as OHLC4, etc) ... I have instead created the upper band with a Moving Average of the Highs of each period (candle) and a lower band with a Moving Average of the Lows of each period (candle). I used the weighted moving average in order to make current pricing more relevant. And through backtesting I have found the ideal period to be 10.
CREDIT TO: The original Moving Average Ribbon by TradingView™
MarketReader_StrategyMarketReader_Strategy is a very useful and advanced indicator:
- It draws buying (green) and selling (orange) zone .
-Once the buying or selling zone is tapped, the color is automatically changed to grey
-It shows liquidity pool ($$$) engineered by market behaviour
Buying or selling area are determined by an algorithm that combines volume profile, Elliott Wave principles and order flow delivery .
On the above example:
At “1” , you can see that the first buying zone is drawn since January 12
At “2” , the buying zone is tapped on January 18 with a strong bullish reaction.
At “3” and “3’” , you can see that liquidity pool has been created by market maker on both buying and selling side. It is typical of market behavior.
Market maker will take the downside liquidity by targeting the buying zone and then reverse (to the upside) targeting the upside liquidity pool that fuel the pump to the selling zone “4” . This selling zone is reached at “5” with a strong bearish reaction.
“6” represent active buying zone, waiting to be tapped.
To buy or take profit on these areas will depend on market behavior on the way down. Does the market engineer liquidity before? We use 2 complementary indicators helping us to take position on these areas but feel free to experiment with your own.
Usually, I wait price comes to selling or buying zone, then I go on lower timeframe (15 to 30 times lower) searching for divergences and convergences on Momemtum reader (also available on tradingview)
This indicator does not repaint and works on Forex, Crypto, Indices, Commodities and stock.

Ichimoku Cloud DistanceAn alternative way to look at the Ichimoku Cloud with various modes:
Distance to Center: the various lines of the Ichimoku system are displayed as the distance to the center of the cloud in percentage terms. 0 is the center of the cloud.
Distance to Edge: lines are displayed as the distance to the closest edge of the cloud in percentage terms. values inside the cloud are displayed as 0.
Hybrid: values outside of the cloud behave as the 'Distance to Edge' mode, values inside behave as 'Distance to Center' mode. The values outside the cloud are scaled by the supplied scale factor in order to make things more readable. Best value for this scale factor is chart/timeframe dependent. The interval from -1 to 1 is equivalent to the bottom and top of the cloud respectively; 0 is the center.
The background color is the color of the cloud.

Ichimoku Cloud OscillatorThis script shows Ichimoku values in a different manner. While studying Ichimoku one thing stuck out to me and that is that the Kijun-Sen line is considered to be the equilibrium of the market, it acts like a magnet and price always returns to it. Taking this into account I made a script that plots the distance from equilibrium as an oscillator.
With that value being an oscillator it allows for some analysis that would have been harder to do looking at the normal ichimoku chart. For example smoothing the value and comparing the distance to the average distance to see if the market reached an extremity (too far from equilibrium). I added a bollinger band for those who are interested in analysing the value in that way but in my experience I do not use it except for noticing if market spiked outside of the band (green and red dots).
It is advised to use this oscillator as a trend analysis tool the same way you would use a money flow. Below a breakdown of current features
- Disequilibrium1: The white sharp wave is the raw distance from Kijun with settings to smooth it out using a WMA
- Disequilibrium2: The blue smooth wave is the smooth distance from Kijun with settings to smooth it further out using a WMA
- Yellow line: The distance of Tenkan-Sen from Kijun-Sen which in alot of ichimoku strategys act as a trend filter or a crossover as market change.
- Green and red zone: The slope of the kumo cloud, color coded to see if kumo is red or green. Use it in the same way you would use money flow on market cypher, it is a longer term trend strength indicator and like all smoothed values it lags behind. You can use this to decide which direction to trade in but not as a signal on it's own.
- Bollinger Band: Acts the same way a bollinger band does, use this to analyse the wave structure, especialy the middle line the same way you would use Disequilibrium2, if the waves are a good distance from this line market can be overbought oversold or it is just a good indication that the trend is strong. Outer bands should be your warning bands as the waves tend to jump back to the middle line when touching those.
Would love some feedback on this as I do not think this can be used for divergences but would like to hear some possible patterns/strategys.
My current strategy is noticing an increasing wave after a squeeze (waves keep getting smaller untill a large trend happens, wave no longer goes to middle and keeps expanding). When I notice this I wait for the white wave to enter the blue and touch the mid bollinger line (small pullback during strong trend) and open a trade in the direction of the trend. I use the green and red zone to decide if the long term direction tells the same to get confluence.

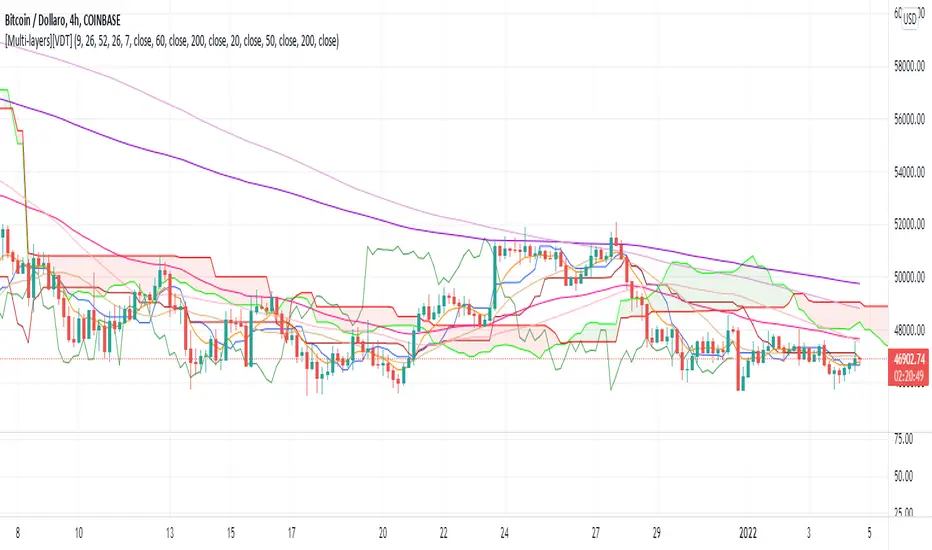
[Multi-layers][VDT]New multi-indicator to merge together three of the most popular indicators used by traders in technical analysis:
1) Ichimoku Cloud, with parameters editable by the trader. Default parameters are: 9-26-52-26
2) 3X Simple Moving Average (SMA), with periods editable by the trader. Default periods are: 20-50-200
3) 3X Exponential Moving Average (EMA), with periods editable by the trader. Default periods are: 7-60-200
Traders can decide whether to print or to hide each indicators separately in the graph, creating three different overlays.
T/K CROSSSimple crossing of the Tenkan & Kijun Sen indicated by a "Cross". Surfed Tradingview for it, but did not find it, so decided to make one. Does NOT include the Ichimoku Cloud & the Chikou

Heikin Ashi Trailing Stoploss ActivationThe Basics
This indicator should be used on regular candle sticks. It is possible to trigger an alert, when the block flips from red to green bar. Or vice versa.
Red block represents a red Heikin Ashi candle.
Green block for green Heikin Ashi candle.
It can be used as a trailing stoploss for (DCA/ TV) bots, when riding trends.
What Makes It Different
The user can preset the price (of the asset e.g. BTC), where it will start looking for Heikin Ashi flips. Every Heikin Ashi flip before this preset price will be ignored. Preset prices could be chosen tactically at resistance levels.
Different time frames of Heikin Ashi flips can be used together. E.g. 10 min, 3 hour or 2 Day time frames. If this is possible within your Tradingview subscription.
Example
The user has a long position (bought at the green arrow.) The user wants to start trailing at price 88 USDT (blue line).
The indicator will only trigger when the following conditions are met:
Cross of red block on the indicator (representing red Heikin Ashi candle)
Price has crossed 88 USDT
If the candlestick turns from a green to a red block, before crossing 88 USDT. It will NOT trigger the alert. Visible as the orange down arrows. In the indicator below it is displayed as a red block.The alert will go off at the red down arrow on 10th Nov (if chosen for Once per bar close). The price condition of 88 USDT was already met at 7th Nov.
Final Words
Disclaimer: Please use it with care and at own risk. The owner of this indicator is not liable for any financial losses.
Past performance is no guarantee of future returns.

Ichimoku Box by TradictorzThis is just a "helping tool" for those who knows ichimoku as well and is the first interactive box tool because of Pine v5 ability based on input time which confirmed by users.
HOW-TO:
This tool works and draw boxes automatically based on HH (HigherHigh) and LL (LowerLow) candles on previous 26 candle bars, You have to put your start time on ichimoku CROSS (BasedLine & ConversionLine) which will give you two boxes based on 26 bar periods target. if the price passes through the HH 26 periods bar candles then you have to use the upper box as a target, if the price passes through the LL 26 periods bar candles then you have to use the lower box as a target.in the setting menu you can choose how many boxes will show you for upper or lower targets and also the ability of selecting to show ichimoku lines , clouds and crossess added in the menu setting.
Feel free to use it and enjoy it.

Trailing Stoploss Bottom ActivationThe Basics
The indicator is visible on the chart as circles above and below the bar.
It will trigger an alert when the current price goes below, the low of the previous candle.
Or an alert when current price goes above, the high of the previous candle.
The indicator can be used as a trailing stoploss for (DCA/ TV) bots.
The distance between the circles and candlesticks can be adjusted. If the user prefers to set an alert e.g. a few ticks lower than the candle bottom.
What Makes It Different
The user can preset the price (of the asset e.g. BTC), where it will start looking for the condition: current price is below previous candle low (when in long position). Current price is above previous candle high (when short).
Example
In the chart above MATIC/BUSD the user has drawn a blue line at 1.70. Since there is where he expects resistance.
The user has a long position (bought at the green arrow.) The user wants to start trailing at price 1.70.
The alert will only trigger when the following conditions are met:
Condition 1 - Crossed 1.70
Condition 2 - Current candle price is below previous candle low.
In the chart above price crossed above 1.70 on 26th Oct. Current candle price (at that moment) went below previous candle low on 27th Oct, indicated with a red arrow. Here the alert will go off at 1.659 BUSD (indicated in pink).
It ignores the other two lows, indicated with orange arrows. Because condition 1 is not met.
It is possible to use multiple time frames at the same time. Some time frames might not be available depending on your Tradingview subscription.
Final Words
Disclaimer: Please use it with care and at own risk. The owner of this indicator is not liable for any financial losses.
Past performance is no guarantee of future returns.

Supertrend NinjaSupertrend Ninja
The Basics
The Supertrend Ninja is a trend-following indicator. The indicator is optimised for daily, 2 days and 3 days candlesticks and can be used on varying trending markets.
Supertrend Ninja using 2 days candlesticks only gave 7 bullish signals in 2020 and 2 in 2021 for Bitcoin/USDT (based on Binance charts). Greatly reducing false signals. It can be used on lower time frames as well, although you will encounter more noise.
This indicator could be used as a compass for DCA or TV bots as well.
What To Look For
When the background of the candlestick closes green with an upwards pointing pink arrow. It indicates a possible bullish (up)trend. To enter a trade its best to place an order a few ticks above the candle high. This way we only enter a position, when there is trend continuation.
When the background of the candlestick closes red with a downwards pointing black arrow. It indicates a possible bearish (down)trend. To enter a trade its best to place an order a few ticks below the candle low.
Exits can be determined by Fibonacci extensions, orderblocks or other resistances to name a few. Or exit the trade when the opposite background color appears.
Final words
Disclaimer: Please use it with care and at own risk. The owner of this indicator is not liable for any financial losses.
Past performance is no guarantee of future returns.

Ichimoku ScreenerChecks the status of Ichimoku Cloud for 30 coins/stocks.
It may take several seconds ( around 30 sec ) to load.

Ichimoku+Based on the ichimoku cloud system, this indicator gives two presets: Standard (9/26/52/26) and Crypto (20/60/120/30).
This also shows on a chart where Tenkan-Kijun cross happens and when a Kumo Twist happens.

Ichimoku w/Heikin-Ashi Ichimoku w/Heikin-Ashi displays the Heikin-Ashi and leading lagging span of Ichimoku Kinko Hyo.
If you change to Heikin-Ashi as it is, the basis of the calculation of Ichimoku will also use the Heikin-Ashi, so after displaying the Heikin-Ashi independently, then the calculation uses the original candlestick.
Initially, two candlesticks are displayed so that you can switch between candlesticks and Heikin-Ashi. If you uncheck the standard candlesticks check box to hide them, only Heikin-Ashi will be displayed.
In addition, the lagging span is displayed as the leading lagging span in order to align the viewpoint to one current place.
一目均衡表の遅行スパンを先行させ、平均足を表示させる指標です。
標準のまま平均足に変更すると均衡表の計算のベースも平均足を使ってしまうため、平均足を独立して表示させた上で計算は元のローソク足を使用しています。
ローソク足と平均足を切り替えられるように、最初は2つのローソク足が表示されますが、標準のローソク足のチェックボックスを外して非表示とすれば平均足のみの表示となります。
また視点を現在の1箇所に揃えるために遅行スパンを先行遅行スパンとして表示しています。

Volume Based Ichimoku CloudIntroduction
This release focuses primarily on a volume-based Donchian. For some time I was looking for a volume-based Donchian, not finding anything that satisfied me I tried to apply one, and then I applied it to Ichimoku.
I found advantages especially in the lateralization phase, where the integration with the volume filters some false signals.
I have added some features:
- Check the conditions of buy/sell of classic Ichimoku
- Verified reverse buy/sell condition
- Alerts
- Entrance package
- possibility to choose the type of Donchian to use (classic, volume-based)
Settings
There are the classic parameters of Ichimoku, for scalping, I use setting like(6-17-34-17 or 5-14-28-14), the new parameters are:
Donchian Type : Classic / Volume Based
Show Condition : it shows green/red square on the bottom when all the conditions of Ichimoku are satisfied, without the checkmark the inputs or the alarms will not work for this type of signal
Show Reversal : it shows yellow/purple triangle on the bottom when all during short/long state condition of Ichimoku Tenkan cross the Kijun, without the checkmark the inputs or the alarms will not work for this type of signal
Trades Framework
Show Trade Lines : show the lines for Entry Point, TP1, TP2, SL
Per n Bars : For how many bars the sending lines will be drawn
Enter Gap : It's the gap, in percentage, from the last candle low/high. For example, the entry point will be set 0.1% higher than the last high of the candle, in a long situation, or 0.1% lower than the last low of the candle in a short situation.
Take Profit 1 : It's the gap, in percentage, from the entry point. For example, the first take profit will be set 0.5% higher/lower than the entry point.
Take Profit 2 : It's the gap, in percentage, from the entry point. For example, the second take profit will be set 0.5% higher/lower than the entry point.
Stop Loss : It's the gap, in percentage, from the entry point. For example, the stop loss will be set 0.5% higher/lower than the entry point.
How to use
The use will be like that for the classic Ichimoku, the combination with a volatility indicator or the volume analysis will certainly help to reduce false signals and therefore to select only the most profitable signals.
Remember that every statistical indicator is just a tool, it needs to be understood to be used at its best, otherwise, it is just a colored line in a colored graph.

Scalping IchimokuBased on the Ichimoku Cloud indicator, the Scalping Ichimoku is a strategy applied in a simple form.
How the strategy works?
The indicator will watch two filters from the Ichimoku Cloud indicator. The first one is when the price crosses the cloud (over or under). The second filter is when the conversion line crosses the baseline (over or under). When both filters happen, no matter the order or when the indicator will print an arrow signal.
Buy Signal
A buy signal, or arrow up, will appear when the price crosses over the cloud and when the conversion line crosses over the baseline.
Sell Signal
A sell signal, or arrow down, will appear when the price crosses under the cloud and the conversion line crosses under the baseline.
Exit Points
Show Exit Spots enabled. The indicator will print possible exit spots for the last entry, based on the cross from conversion with baseline. In case the cross is against the latest entry signal, it will show an "X"
One Signal At Time
The indicator will print only one signal in a single direction. It will never print the same signal as the last signal
Exit and Entry Spot At The Same Candle
In the chart, when the entry spot and an exit spot appear in the same candle, the exit spot will appear with a different color. This means that the entry spot is more accurate.
This strategy was designed for scalping, no matter the time frame or market, but it may work for swing traders as well.

Ichimoku (Cloud + Box + Prediction)In addition to Ichimoku, this indicator includes Ichimoku boxes and Ichimoku prediction indicators.
You can select the base candle with the mouse and drag it and drop.
Three boxes are drawn with periods 9, 26 and 52 and it is possible to change periods.
Prediction boxes can be drawn on the right side of the candle for the three mentioned periods .
Target prices can be shown in the borders and centers of boxes.
It is possible to change the thickness and color of the boxes.
Three boxes can also be seen in the last candle of the chart.
Ichimoku lines including Tenkansen, Kijunsen, Senko, Chikou, Quality and Kumo Cloud can be displayed on the chart.
The points corresponding to each Ichimoku line represent the value of different lines in the base candle
The crossing points of the Tenkansen and Kijunsen lines can be displayed in the chart
Predictions of the amount of Tenkansen and Kijunsen in future candles can be seen on the chart.

Ichimoku CrossThis is a trend analysis indicator based on Ichimoku
this indicator splits the chart into :
"Buy Phase" where KijunSen > TenkanSen with "Green color"
"Sell Phase" where KijunSen < TenkanSen with "Red color"
"Cross Phase" where KijunSen = TenkanSen
Close of each candle above or below KijunSen and TenkanSen determine the strength of the trend
and is shown by 3 different green colors for Bullish Trends and 3 different red colors for Bearish Trends .
