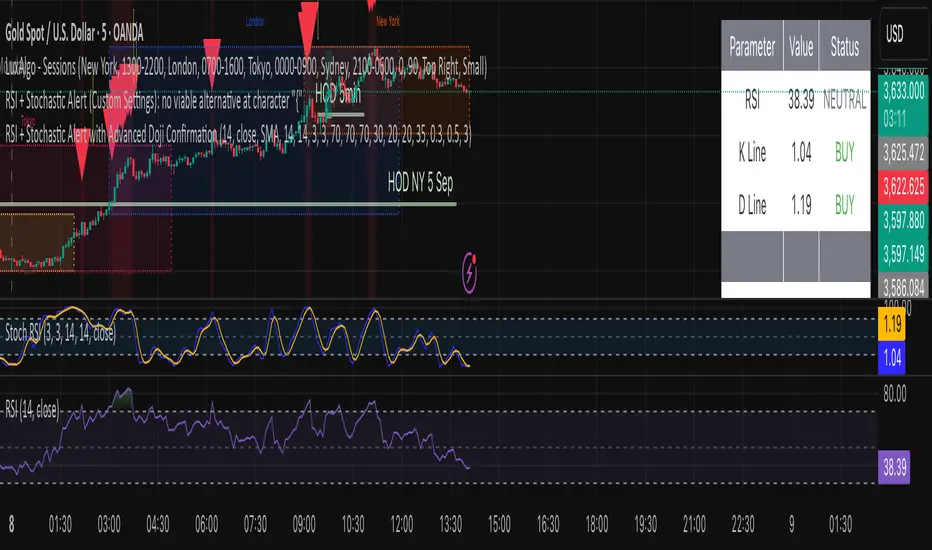
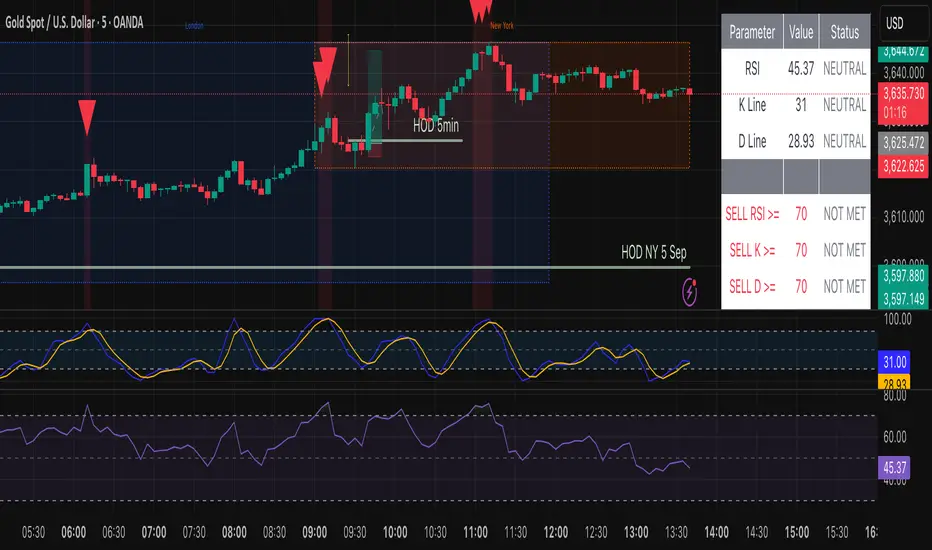
Smart ChannelThe "Smart Channel" indicator is designed to dynamically identify and plot price channels on a chart. It uses a statistical approach based on Pearson's correlation coefficient to determine the best-fit channel for both short-term and long-term trends. This allows traders to visualize potential support and resistance levels, identify trend direction, and potentially anticipate breakouts or reversals.
How it Works:
Data Input: The indicator takes a source input (typically the closing price) as the basis for its calculations.
Period Selection: It defines two sets of lookback periods: one for short-term analysis and one for long-term analysis. The code iterates through these periods, calculating a linear regression and standard deviation for each.
Pearson's Correlation: For each period, the indicator calculates Pearson's R, which measures the strength and direction of the linear relationship between price and time. A higher absolute value of Pearson's R indicates a stronger trend.
Best Fit Channel: The indicator identifies the period with the highest Pearson's R for both short-term and long-term and uses the corresponding linear regression parameters (slope and intercept) to define the midline of the channel.
Standard Deviation: The standard deviation of the price data around the regression line is calculated. This is used to define the upper and lower boundaries of the channel. The channel width is controlled by a "Deviation Multiplier" input.
Channel Plotting: The indicator plots the midline, upper boundary, and lower boundary of the channel on the chart. Separate channels are plotted for the short-term and long-term best-fit periods, using different colors for easy visual distinction.
Dynamic Updates: The channel is dynamically updated as new price data becomes available, adjusting to the evolving market trend.
Key Inputs and Settings:
Source: The price data used for calculations (e.g., close, open, high, low, etc.).
Use Long-Term Channel: A boolean input to enable/disable the calculation and plotting of the long-term channel.
Deviation Multiplier: Controls the width of the channel (how many standard deviations away from the midline the boundaries are).
Channel/Midline Colors and Transparency: Customizable colors and transparency levels for the channel lines and fill.
Line Styles: Options for solid, dotted, or dashed lines for the channel boundaries and midline.
Extend Style: How the channel lines should extend (right, both, none, left).
Interpretation and Usage:
Trend Identification: The direction of the midline indicates the prevailing trend. An upward-sloping midline suggests an uptrend, while a downward-sloping midline suggests a downtrend.
Support and Resistance: The upper and lower channel boundaries can act as potential support and resistance levels.
Breakouts: A price move outside of the channel boundaries may signal a potential breakout or reversal.
Overbought/Oversold: Prices touching or exceeding the upper boundary might suggest an overbought condition, while prices touching or exceeding the lower boundary might suggest an oversold condition.
Short-Term vs. Long-Term: Comparing the short-term and long-term channels can provide insights into the overall market context. For example, a short-term uptrend within a long-term downtrend might suggest a potential buying opportunity before the larger trend resumes.
Educational
IPO Date ScreenerThis script, the IPO Date Screener, allows traders to visually identify stocks that are relatively new, based on the number of bars (days) since their IPO. The user can set a custom threshold for the number of days (bars) after the IPO, and the script will highlight new stocks that fall below that threshold.
Key Features:
Customizable IPO Days Threshold: Set the threshold for considering a stock as "new." Since Pine screener limits number bars to 500, it will work for stocks having trading days below 500 since IPO which almost 2 years.
Column Days since IPO: Sort this column from low to high to see newest to oldest STOCK with 500 days of trading.
Since a watchlist is limited to 1000 stocks, use this pines script to screen stocks within the watch list having trading days below 500 or user can select lower number of days from settings.
This is not helpful to add on chart, this is to use on pine screener as utility.
IronCondor 10am 30TF by RMThe IronCondor 10am 30TF indicator shows Iron Condor trades win rate over a large number of days.
The default ETFs in this indicators are "QQQ", "SPY", "RUT" , "CBTX" and "SPX", other entries have not been tested.
Iron Condor quick explanation:
- Iron Condors trades have four options, generally, are based around a Midpoint price (Current Market Price Strike) and
- Two equally distances Strikes for the SELL components (called the Body of the Iron Condor)
- Further away from the two SELLs, another Two BUYs for protection (not considered in this indicator)
- Iron Condors are used for Passive Income based on small gains most of the time.
The IronCondor 10am 30TF has its logic created based on the premises that:
- Most days the market prices stay within a range.
- As example the S&P market prices would stay within 1% on about 80% of the time
- The moving markets (bullish or bearish) occur about 20% of the time
- The biggest market price volatility generally occurs before market opens and then around the first hour or so of trade in the day.
- After the first hour or so of the market the prices would be most likely to stay within a range.
The operation is simple:
- At the Trade Star time in the day (say 10:30 Hrs.) draws a vertical yellow line, then
- Creates two blue horizontal lines for the SELL limits in the Iron Condor Body, at +/- 1% price boundary (check Ticker list below for values)
- At the Trade End time (say 16:00 Hrs.) checks that none of the SELL limits have been broken by highs or lows during the trade day
(The check is done calculating at Trade End time the high/lows 10 bars back for 30 min TF - timeframe)
- There is a label at each Trade End time with Win/Loss and Body value.
- There is one final label with overall calculated past performance in Win percentage out of 'n' trades
Defaults and User Entries:
- The User can modify the Midpoint price called 'IronCondor Midpoint STRIKE' (default is the Candle Close at the selected time)
- The User can modify the Body value called 'IronCondor Body' (default is the Ticker's selected value as per list below)
"QQQ" or "SPY" Body = 5
"RUT" or "CBTX" Body = 20
"SPX" Body = 60
* Disclaimer: This is not a Financial tool, it cannot used as any kind of advice to invest or risk moneys in any market,
Markets are volatile in nature - with little or no warning - and will drain your account if you are not careful.
Use only as an academic demonstrator => * Use at your own risk *
Forward Curve Visualization ToolProvide the spot symbol and the futures product root, and the script automatically scans all relevant contracts for you—no more tedious manual searches. The result is a clean, intuitive chart showing the live forward curve in real time.
It also detects contango or backwardation conditions (based on spot < F1 < F2 < F3).
Future Features:
Plot historical snapshots of the curve (1 day, 1 week, or 1 month ago) to understand market trends over time.
Display additional metrics such as annualized basis, cost of carry (CoC), and even volume or open interest for deeper insights.
If you trade futures and watch the forward curve, this script will give you the actionable data you need and get more ideas or features you’d like to see. Let’s build them together!
Disclaimer
Please remember that past performance may not be indicative of future results.
Due to various factors, including changing market conditions, the strategy may no longer perform as well as in historical backtesting.
This post and the script don’t provide any financial advice.
Son Model ICT [TradingFinder] HTF DOL H1 + Sweep M15 + FVG M1🔵 Introduction
The ICT Son Model setup is a precise trading strategy based on market structure and liquidity, implemented across multiple timeframes. This setup first identifies a liquidity level in the 1-hour (1H) timeframe and then confirms a Market Structure Shift (MSS) in the 5-minute (5M) timeframe to validate the trend. After confirmation, the price forms a new swing in the 5-minute timeframe, absorbing liquidity.
Once this level is broken, traders typically drop to the 30-second (30s) timeframe and enter trades based on a Fair Value Gap (FVG). However, since access to the 30-second timeframe is not available to most traders, we take the entry signal directly from the 5-minute timeframe, using the same liquidity zones and confirmed breakouts to execute trades. This approach simplifies execution and makes the strategy accessible to all traders.
This model operates in two setups :
Bullish ICT Son Model and Bearish ICT Son Model. In the bullish setup, liquidity is first accumulated at the lows of the 1-hour timeframe, and after confirming a market structure shift, a long position is initiated. Conversely, in the bearish setup, liquidity is first drawn from higher levels, and upon confirmation of a bearish trend, a short position is executed.
Bullish Setup :
Bearish Setup :
🔵 How to Use
The ICT Son Model setup is designed around liquidity analysis and market structure shifts and can be applied in both bullish and bearish market conditions. The strategy first identifies a liquidity level in the 1-hour (1H) timeframe and then confirms a Market Structure Shift (MSS) in the 5-minute (5M) timeframe.
After this shift, the price forms a new swing, absorbing liquidity. When this level is broken in the 5-minute timeframe, the trader enters based on a Fair Value Gap (FVG). While the ideal entry is in the 30-second (30s) timeframe, due to accessibility constraints, we take entry signals directly from the 5-minute timeframe.
🟣 Bullish Setup
In the Bullish ICT Son Model, the 1-hour timeframe first identifies liquidity at the market lows, where price sweeps this level to absorb liquidity. Then, in the 5-minute timeframe, an MSS confirms the bullish shift.
After confirmation, the price forms a new swing, absorbing liquidity at a higher level. The price then retraces into a Fair Value Gap (FVG) created in the 5-minute timeframe, where the trader enters a long position, placing the stop-loss below the FVG.
🟣 Bearish Setup
In the Bearish ICT Son Model, liquidity at higher market levels is identified in the 1-hour timeframe, where price sweeps these levels to absorb liquidity. Then, in the 5-minute timeframe, an MSS confirms the bearish trend.
After confirmation, the price forms a new swing, absorbing liquidity at a lower level. The price then retraces into a Fair Value Gap (FVG) created in the 5-minute timeframe, where the trader enters a short position, placing the stop-loss above the FVG.
🔵 Settings
Swing period : You can set the swing detection period.
Max Swing Back Method : It is in two modes "All" and "Custom". If it is in "All" mode, it will check all swings, and if it is in "Custom" mode, it will check the swings to the extent you determine.
Max Swing Back : You can set the number of swings that will go back for checking.
FVG Length : Default is 120 Bar.
MSS Length : Default is 80 Bar.
FVG Filter : This refines the number of identified FVG areas based on a specified algorithm to focus on higher quality signals and reduce noise.
Types of FVG filters :
Very Aggressive Filter: Adds a condition where, for an upward FVG, the last candle's highest price must exceed the middle candle's highest price, and for a downward FVG, the last candle's lowest price must be lower than the middle candle's lowest price. This minimally filters out FVGs.
Aggressive Filter: Builds on the Very Aggressive mode by ensuring the middle candle is not too small, filtering out more FVGs.
Defensive Filter: Adds criteria regarding the size and structure of the middle candle, requiring it to have a substantial body and specific polarity conditions, filtering out a significant number of FVGs.
Very Defensive Filter: Further refines filtering by ensuring the first and third candles are not small-bodied doji candles, retaining only the highest quality signals.
🔵 Conclusion
The ICT Son Model setup is a structured and precise method for trade execution based on liquidity analysis and market structure shifts. This strategy first identifies a liquidity level in the 1-hour timeframe and then confirms a trend shift using the 5-minute timeframe.
Trade entries are executed based on Fair Value Gaps (FVGs), which highlight optimal entry points. By applying this model, traders can leverage existing market liquidity to enter high-probability trades. The bullish setup activates when liquidity is swept from market lows and a market structure shift confirms an upward trend, whereas the bearish setup is used when liquidity is drawn from market highs, confirming a downtrend.
This approach enables traders to identify high-probability trade setups with greater precision compared to many other strategies. Additionally, since access to the 30-second timeframe is limited, the strategy remains fully functional in the 5-minute timeframe, making it more practical and accessible for a wider range of traders.
Cluster Reversal Zones📌 Cluster Reversal Zones – Smart Market Turning Point Detector
📌 Category : Public (Restricted/Closed-Source) Indicator
📌 Designed for : Traders looking for high-accuracy reversal zones based on price clustering & liquidity shifts.
🔍 Overview
The Cluster Reversal Zones Indicator is an advanced market reversal detection tool that helps traders identify key turning points using a combination of price clustering, order flow analysis, and liquidity tracking. Instead of relying on static support and resistance levels, this tool dynamically adjusts to live market conditions, ensuring traders get the most accurate reversal signals possible.
📊 Core Features:
✅ Real-Time Reversal Zone Mapping – Detects high-probability market turning points using price clustering & order flow imbalance.
✅ Liquidity-Based Support/Resistance Detection – Identifies strong rejection zones based on real-time liquidity shifts.
✅ Order Flow Sensitivity for Smart Filtering – Filters out weak reversals by detecting real market participation behind price movements.
✅ Momentum Divergence for Confirmation – Aligns reversal zones with momentum divergences to increase accuracy.
✅ Adaptive Risk Management System – Adjusts risk parameters dynamically based on volatility and trend state.
🔒 Justification for Mashup
The Cluster Reversal Zones Indicator contains custom-built methodologies that extend beyond traditional support/resistance indicators:
✔ Smart Price Clustering Algorithm: Instead of plotting fixed support/resistance lines, this system analyzes historical price clustering to detect active reversal areas.
✔ Order Flow Delta & Liquidity Shift Sensitivity: The tool tracks real-time order flow data, identifying price zones with the highest accumulation or distribution levels.
✔ Momentum-Based Reversal Validation: Unlike traditional indicators, this tool requires a momentum shift confirmation before validating a potential reversal.
✔ Adaptive Reversal Filtering Mechanism: Uses a combination of historical confluence detection + live market validation to improve accuracy.
🛠️ How to Use:
• Works well for reversal traders, scalpers, and swing traders seeking precise turning points.
• Best combined with VWAP, Market Profile, and Delta Volume indicators for confirmation.
• Suitable for Forex, Indices, Commodities, Crypto, and Stock markets.
🚨 Important Note:
For educational & analytical purposes only.
Stochastic-Dynamic Volatility Band ModelThe Stochastic-Dynamic Volatility Band Model is a quantitative trading approach that leverages statistical principles to model market volatility and generate buy and sell signals. The strategy is grounded in the concepts of volatility estimation and dynamic market regimes, where the core idea is to capture price fluctuations through stochastic models and trade around volatility bands.
Volatility Estimation and Band Construction
The volatility bands are constructed using a combination of historical price data and statistical measures, primarily the standard deviation (σ) of price returns, which quantifies the degree of variation in price movements over a specific period. This methodology is based on the classical works of Black-Scholes (1973), which laid the foundation for using volatility as a core component in financial models. Volatility is a crucial determinant of asset pricing and risk, and it plays a pivotal role in this strategy's design.
Entry and Exit Conditions
The entry conditions are based on the price’s relationship with the volatility bands. A long entry is triggered when the price crosses above the lower volatility band, indicating that the market may have been oversold or is experiencing a reversal to the upside. Conversely, a short entry is triggered when the price crosses below the upper volatility band, suggesting overbought conditions or a potential market downturn.
These entry signals are consistent with the mean reversion theory, which asserts that asset prices tend to revert to their long-term average after deviating from it. According to Poterba and Summers (1988), mean reversion occurs due to overreaction to news or temporary disturbances, leading to price corrections.
The exit condition is based on the number of bars that have elapsed since the entry signal. Specifically, positions are closed after a predefined number of bars, typically set to seven bars, reflecting a short-term trading horizon. This exit mechanism is in line with short-term momentum trading strategies discussed in literature, where traders capitalize on price movements within specific timeframes (Jegadeesh & Titman, 1993).
Market Adaptability
One of the key features of this strategy is its dynamic nature, as it adapts to the changing volatility environment. The volatility bands automatically adjust to market conditions, expanding in periods of high volatility and contracting when volatility decreases. This dynamic adjustment helps the strategy remain robust across different market regimes, as it is capable of identifying both trend-following and mean-reverting opportunities.
This dynamic adaptability is supported by the adaptive market hypothesis (Lo, 2004), which posits that market participants evolve their strategies in response to changing market conditions, akin to the adaptive nature of biological systems.
References:
Black, F., & Scholes, M. (1973). The Pricing of Options and Corporate Liabilities. Journal of Political Economy, 81(3), 637-654.
Bollinger, J. (1980). Bollinger on Bollinger Bands. Wiley.
Jegadeesh, N., & Titman, S. (1993). Returns to Buying Winners and Selling Losers: Implications for Stock Market Efficiency. Journal of Finance, 48(1), 65-91.
Lo, A. W. (2004). The Adaptive Markets Hypothesis: Market Efficiency from an Evolutionary Perspective. Journal of Portfolio Management, 30(5), 15-29.
Poterba, J. M., & Summers, L. H. (1988). Mean Reversion in Stock Prices: Evidence and Implications. Journal of Financial Economics, 22(1), 27-59.
Moneyball EMA-MACD indicator [VinnieTheFish]Summary of the Moneyball EMA-MACD Indicator Script
Author: VinnieTheFish
Purpose:
This indicator helps traders identify trend direction, momentum shifts, and potential trade signals based on EMA and MACD crossovers.
This Pine Script is a custom indicator that combines Exponential Moving Averages (EMAs) and MACD (Moving Average Convergence Divergence) to analyze price trends and momentum. The script uses a custom 9/50 MACD with a 16 smoothing period. The script is written in a way that you can create your own custom MACD settings and create alerts based on those parameters. The chart bars are color coded based on the relative position of the MACD and Signal line primarily for bullish long trade setups.
Bar color coding helps the trader spot potential reversals based on where the price currently resides in relation to the custom 9/50 EMA based MACD and the 16 period smoothing period for the signal line. Indicator also has custom alerts to notify the trader when a potential trade setup exists that correspond with the bar color change.
Question: So why is this called the Moneywell EMA-MACD Indicator?
Answer: In the movie Moneyball the Oakland A's broke down how to win a championship based on data. To make the playoffs you needed so many wins, then broken down by runs and then broken down to base hits. A base hit was good as a walk. With trading often times we look too often for home runs and ignore the importance of getting on base with small wins. This indicator was designed on shorter timeframes to identify those base hits, but can also be adapted to higher timeframes for swing trading.
Key Features:
User Inputs:
Configurable fast and slow lengths for MACD calculation.
Choice between SMA and EMA for oscillator and signal line smoothing.
Customizable signal smoothing length.
EMA Calculation:
Computes 3 EMA, 9 EMA, 20 EMA, and 50 EMA to track short-term and long-term trends.
MACD Calculation:
Computes MACD using either SMA or EMA based on user selection.
Generates the MACD signal line for comparison.
Crossover Conditions:
Detects MACD and Signal line crossovers above and below the zero line.
Identifies price momentum shifts.
Bar Coloring Logic:
Green: MACD is above 0 and above the signal line.
White: MACD is below the signal line.
Orange: MACD is below 0 but above the signal line.
Fuchsia: Bullish EMA 3/9 cross but price is still below the 20/50 EMA.
Alerts for Key Trading Signals:
MACD crossing above/below the zero line.
Signal line crossing above/below the zero line.
MACD reaching new highs/lows.
Alerts for colored bar conditions.
Candlestick Color Change AlertIt is an alert for change of candlestick color.
Identifies Candle Type
A candle is bullish if the closing price is higher than the opening price.
A candle is bearish if the closing price is lower than the opening price.
Detects a Color Change
The script checks if the current candle is bullish while the previous candle was bearish, or vice versa.
If a change is detected, an alert is triggered.
Triggers an Alert
Users receive an alert notification whenever a candlestick color change occurs.
Alerts can be set for popup, email, mobile push, or webhook notifications.
Visual Highlighting (Optional)
The script can also apply a background color (blue) on the chart to visually mark color changes.
Blackflag FTS (1H Trailing) + MSB-OB FibThis indicator combines a 1-hour trailing stop system with multi-timeframe Fibonacci retracement levels and ZigZag structure detection to assist traders in identifying trend direction and potential reversal zones.
Features:
✅ 1-Hour Trailing Stop: Uses an ATR-based trailing stop mechanism to track trend direction and dynamic support/resistance.
✅ Multi-Timeframe Approach: The trailing stop is calculated on the 1-hour timeframe, while the ZigZag and Fibonacci retracement levels are based on the 15-minute chart.
✅ ZigZag Structure Detection: Helps filter market swings and trend reversals dynamically.
✅ Fibonacci Levels (0.5 & 0.786): Key retracement levels to watch for price reactions.
✅ Alerts for Key Levels: Get notified when the price crosses important levels (1H trailing stop, Fib 0.5, Fib 0.786).
How It Works:
The trailing stop adapts dynamically based on ATR values and determines trend direction.
ZigZag detection filters out minor price movements to highlight major swing points.
Fibonacci levels are calculated based on ZigZag swings, helping traders spot potential reversal zones.
This tool is useful for trend-following traders, breakout traders, and Fibonacci-based strategies.
Let me know if you'd like any modifications! 🚀
Candle Momentum ExhaustionCandle Momentum Exhaustion
The Candle Momentum Exhaustion indicator is designed to help traders spot potential turning points in a trend by identifying when the prevailing momentum may be “running on empty.” The indicator works by comparing the size of each candle’s body (the absolute difference between the open and close) to the average body size over a recent period. When a candle’s body exceeds a user‐defined multiple of this average, it is flagged as an “exhaustion” candle.
• A bullish exhaustion (shown with a red down–facing triangle above the bar) occurs when a very large bullish candle (close > open) is detected, suggesting that buyers may have pushed the price too far and the rally could be near its end.
• A bearish exhaustion (shown with a green up–facing triangle below the bar) occurs when a very large bearish candle (close < open) is detected, implying that selling pressure might be overdone.
These signals can alert you to a potential reversal or consolidation point. The script also includes alert conditions so that you can set up notifications whenever an exhaustion signal is generated.
How It Works
1. Average Candle Body:
The script computes a simple moving average (SMA) of the absolute candle bodies over a user-defined period (default is 14 bars).
2. Exhaustion Candidate:
A candle is flagged as an exhaustion candidate if its body size exceeds the average by more than the set multiplier (default is 2.0).
3. Signal Identification:
• If the exhaustion candle is bullish (close > open), it is marked with a red down–facing triangle above the bar.
• If it is bearish (close < open), it is marked with a green up–facing triangle below the bar.
4. Alerts:
The built-in alertcondition() calls allow you to set alerts (via TradingView’s alert system) so that you can be notified when an exhaustion event occurs.
Risk Disclaimer:
This indicator is provided for educational and informational purposes only and does not constitute financial, investment, or trading advice. Trading and investing involve significant risk, and you should not rely solely on this indicator when making any trading decisions. Past performance is not indicative of future results. Always perform your own due diligence and consult with a qualified financial advisor before making any financial decisions. The creator of this indicator shall not be held responsible for any losses incurred through its use.
US vs EU Interest Rate SpreadThis script plots the difference (Spread) between the US-Interest Rate (Symbol USINTR) and the EU Interest Rate (Symbol: EUINTR) and plots it in a seperate pane. Areas where the background is green are times were the spread was positive (US interest rate higher than EU interest rate), a red background indicates a higher EU interest rate than US interest rate.
OAT Multiple Alert ConditionsOverview:
The OAT Multiple Alert Conditions indicator is designed to enhance TradingView’s alert functionality by allowing users to set multiple conditions for webhook-based alerts. This script enables traders to define up to four independent conditions using different event types (e.g., crossing, greater than, rising, etc.), making it ideal for automated trading strategies and webhook integrations.
Features:
✅ Supports up to 4 independent conditions.
✅ Multiple event types: Crossing, Crossing Up, Crossing Down, Greater Than, Less Than, Rising, Falling.
✅ Choose between value-based or source-based conditions.
✅ Custom timeframes for each condition.
✅ Optional session filtering and expiration settings.
✅ Visual markers for triggered conditions.
✅ Alerts for individual conditions or all conditions being met.
How It Works:
Configure each condition by selecting the event type and input values.
Define whether the alert should trigger on bar close or real-time.
Enable session filtering to limit alerts to specific trading hours.
Set an expiration date for alerts if needed.
Alerts can be sent via TradingView’s webhook feature for automated execution.
Intended Use:
This script is a utility tool for traders using automated strategies with the Options Auto Trader. It does not generate trading signals or provide financial advice. It is designed to enhance alert flexibility and efficiency for trading through webhooks.
License & Compliance:
This script is published under the Mozilla Public License 2.0 and follows TradingView’s guidelines. It does not execute trades but simply provides an enhanced alerting mechanism.
Live Economic CalendarLive Economic Calendar
This TradingView indicator provides real-time economic news events directly on your charts, helping traders stay informed about key market-moving data. Built on the original Forex Factory utility by toodegrees, this version enhances functionality with customizable alerts and improved visualizations.
Key Features:
Real-Time Economic News: Displays upcoming economic events from Forex Factory, categorized by impact level (High, Medium, Low, Holiday).
Custom Alerts: Set alerts before and after news events to stay prepared for market volatility.
Timezone Adjustments: Adjust news event times to match your local timezone for accurate scheduling.
Currency-Specific News: Automatically filters news based on the currency pair you’re viewing, with manual options for specific currencies.
Flexible Display Options: Choose to display news for today, this week, or a custom period. Customize labels, lines, and tables directly on the chart.
Impact Visualization: Visual cues (lines, labels, background shading) for different impact levels to highlight significant market events.
Credits:
• Original Forex Factory Utility by toodegrees
• Alerts and enhancements by Nachodog
This Pine Script™ code is licensed under the Mozilla Public License 2.0: mozilla.org
Dynamic SL - 1 Pip (Up and Down)The Dynamic SL - 1 Pip Up and Down indicator creates two dynamic lines that follow the price at a distance of 1 pip above and below the closing price. This feature can be particularly useful for traders who want to visualize small stop-loss (SL) levels or track price movement in a highly responsive manner.
Unlike traditional stop-loss indicators, this script ensures that the lines only last for 5 seconds, keeping the chart clean and focusing only on the most relevant price movement.
Key Features
✔ Dynamic Stop-Loss Visualization:
The script draws a green line above the price (+1 pip).
A red line below the price (-1 pip) is also drawn.
✔ Auto-Clearing for a Clean Chart:
Each line lasts for 5 seconds only before automatically disappearing.
This prevents unnecessary clutter on the chart and ensures only the latest price movements are visualized.
✔ Adaptable to Multiple Assets:
Automatically calculates the pip size based on the instrument type:
Forex → Uses 0.0001 per pip.
Futures & Stocks → Uses the minimum tick size.
✔ Ideal for High-Frequency Traders & Scalpers:
Designed for 1-minute (M1) or lower timeframes where traders need to monitor price action closely.
Helps visualize ultra-tight stop-loss levels in scalping strategies.
BTC Future Gamma-Weighted Momentum Model (BGMM)The BTC Future Gamma-Weighted Momentum Model (BGMM) is a quantitative trading strategy that utilizes the Gamma-weighted average price (GWAP) in conjunction with a momentum-based approach to predict price movements in the Bitcoin futures market. The model combines the concept of weighted price movements with trend identification, where the Gamma factor amplifies the weight assigned to recent prices. It leverages the idea that historical price trends and weighting mechanisms can be utilized to forecast future price behavior.
Theoretical Background:
1. Momentum in Financial Markets:
Momentum is a well-established concept in financial market theory, referring to the tendency of assets to continue moving in the same direction after initiating a trend. Any observed market return over a given time period is likely to continue in the same direction, a phenomenon known as the “momentum effect.” Deviations from a mean or trend provide potential trading opportunities, particularly in highly volatile assets like Bitcoin.
Numerous empirical studies have demonstrated that momentum strategies, based on price movements, especially those correlating long-term and short-term trends, can yield significant returns (Jegadeesh & Titman, 1993). Given Bitcoin’s volatile nature, it is an ideal candidate for momentum-based strategies.
2. Gamma-Weighted Price Strategies:
Gamma weighting is an advanced method of applying weights to price data, where past price movements are weighted by a Gamma factor. This weighting allows for the reinforcement or reduction of the influence of historical prices based on an exponential function. The Gamma factor (ranging from 0.5 to 1.5) controls how much emphasis is placed on recent data: a value closer to 1 applies an even weighting across periods, while a value closer to 0 diminishes the influence of past prices.
Gamma-based models are used in financial analysis and modeling to enhance a model’s adaptability to changing market dynamics. This weighting mechanism is particularly advantageous in volatile markets such as Bitcoin futures, as it facilitates quick adaptation to changing market conditions (Black-Scholes, 1973).
Strategy Mechanism:
The BTC Future Gamma-Weighted Momentum Model (BGMM) utilizes an adaptive weighting strategy, where the Bitcoin futures prices are weighted according to the Gamma factor to calculate the Gamma-Weighted Average Price (GWAP). The GWAP is derived as a weighted average of prices over a specific number of periods, with more weight assigned to recent periods. The calculated GWAP serves as a reference value, and trading decisions are based on whether the current market price is above or below this level.
1. Long Position Conditions:
A long position is initiated when the Bitcoin price is above the GWAP and a positive price movement is observed over the last three periods. This indicates that an upward trend is in place, and the market is likely to continue in the direction of the momentum.
2. Short Position Conditions:
A short position is initiated when the Bitcoin price is below the GWAP and a negative price movement is observed over the last three periods. This suggests that a downtrend is occurring, and a continuation of the negative price movement is expected.
Backtesting and Application to Bitcoin Futures:
The model has been tested exclusively on the Bitcoin futures market due to Bitcoin’s high volatility and strong trend behavior. These characteristics make the market particularly suitable for momentum strategies, as strong upward or downward movements are often followed by persistent trends that can be captured by a momentum-based approach.
Backtests of the BGMM on the Bitcoin futures market indicate that the model achieves above-average returns during periods of strong momentum, especially when the Gamma factor is optimized to suit the specific dynamics of the Bitcoin market. The high volatility of Bitcoin, combined with adaptive weighting, allows the model to respond quickly to price changes and maximize trading opportunities.
Scientific Citations and Sources:
• Jegadeesh, N., & Titman, S. (1993). Returns to Buying Winners and Selling Losers: Implications for Stock Market Efficiency. The Journal of Finance, 48(1), 65–91.
• Black, F., & Scholes, M. (1973). The Pricing of Options and Corporate Liabilities. Journal of Political Economy, 81(3), 637–654.
• Fama, E. F., & French, K. R. (1992). The Cross-Section of Expected Stock Returns. The Journal of Finance, 47(2), 427–465.


