SK BAND SK BAND is a powerful TradingView indicator designed to generate clear and reliable Buy & Sell signals by identifying market trend and price momentum. It helps traders make disciplined and confident trading decisions across different market conditions.
🔹 Key Features
✔ Clear BUY and SELL signals on the chart
✔ Works on Stocks, Indices, Forex, Crypto & Commodities
✔ Suitable for Intraday, Swing, and Positional trading
✔ Helps identify trend direction and momentum
✔ Simple, clean, and beginner-friendly
📈 How It Works
BUY signal appears when bullish momentum strengthens
SELL signal appears when bearish momentum increases
For better accuracy:
Use proper risk management
Confirm signals with support & resistance or higher timeframes
Avoid sideways or low-volume markets
⚠ Disclaimer
This indicator is for educational purposes only.
SK BAND does not provide financial advice. Trading involves risk—always confirm signals with your own analysis.
Educational

Mawhoob (TD - Trend Direction) - v1.1Mawhoob (Trend Direction - TD) Indicator v1.1
Professional Trend Analysis & Market Context Dashboard
----------------------------------------------------
🎯 Overview
----------------------------------------------------
Mawhoob (Trend Direction - TD) is a comprehensive, professional-grade technical analysis tool designed to provide traders with multi-dimensional market insights. This advanced indicator combines a proprietary adaptive trend line with real-time market context data, offering a complete market analysis solution in one elegant package.
✨ Key Features ✨
----------------------------------------------------
📈 Trend Direction Line (TD Line)
----------------------------------------------------
Intelligent Moving Average System: Utilizes a sophisticated blend of EMA, RMA, and WMA with smart adaptive error correction.
1- Dynamic Color Coding:
🟢 Green: Bullish trend (price momentum upward).
🔴 Red: Bearish trend (price momentum downward).
2- Customizable Parameters:
Main Period (1-200): Control long-term vs. short-term sensitivity.
Fast Period (0-50): Fine-tune responsiveness to price changes.
Weighting Factor (0-3): Adjust current price influence on the trend line.
3- Visual Bands: Optional upper and lower bands that create a dynamic channel around the trend line.
----------------------------------------------------
📊 Real-Time Market Dashboard
----------------------------------------------------
A comprehensive information panel displaying multiple technical indicators and market dominance metrics.
Technical Indicators Section:
1- RSI (Relative Strength Index)
Current value with color-coded momentum indication.
Direction status: UP / DOWN / NEUTRAL.
Customizable overbought/oversold levels.
Includes RSI SMA for trend confirmation.
2- MACD (Moving Average Convergence Divergence)
Real-time MACD line value.
Trend direction based on MACD vs. Signal line relationship.
Fully customizable fast, slow, and signal periods.
3- ADX (Average Directional Index)
Trend strength measurement.
Color-coded display: Strong vs. Weak trend.
Adjustable strength threshold.
Market Dominance Section:
1- DXY (US Dollar Index)
Real-time dollar strength tracking.
Direction indicator for forex correlation analysis.
2- BTC.D (Bitcoin Dominance)
Bitcoin market dominance percentage.
Useful for crypto market sentiment analysis.
3- USDT.D (Tether Dominance)
Stablecoin dominance tracking.
Risk-on/risk-off market indicator.
All dominance metrics feature:
Customizable timeframe selection.
UP/DOWN/NEUTRAL directional indicators.
Color-coded values for quick visual assessment.
----------------------------------------------------
🔔 Alert & Signal System
----------------------------------------------------
Price Crossover Alerts: Get notified when price crosses above or below the TD line.
Smart Alert Logic: Filters out neutral/flat market conditions to reduce noise.
Visual Signals: Optional triangle markers on chart (▲ bullish, ▼ bearish).
Once-Per-Bar Frequency: Prevents alert spam while ensuring you don't miss opportunities.
----------------------------------------------------
🎨 Visual Customization
----------------------------------------------------
Candle Color Mode: Option to color candles based on trend direction.
Dashboard Positioning: Choose LEFT, RIGHT, or CENTER placement.
Text Size Options: TINY, SMALL, NORMAL, or LARGE for optimal readability.
Customizable colors for Bullish/Bearish trend lines.
Customizable colors for dashboard backgrounds and borders.
Customizable colors for UP/DOWN/NEUTRAL status indicators.
----------------------------------------------------
📚 Use Cases
----------------------------------------------------
For Day Traders
Quick trend identification with color-coded TD line.
Real-time momentum gauges (RSI, MACD).
Instant crossover alerts for entry/exit timing.
For Swing Traders
Medium-term trend direction with adjustable periods.
ADX strength indicator for high-probability setups.
Market dominance context for broader market analysis.
For Crypto Traders
BTC.D and USDT.D tracking for altcoin season detection.
Integrated multi-indicator analysis.
Customizable timeframes for dominance metrics.
For Multi-Market Analysis
DXY correlation for forex and commodities.
Comprehensive dashboard for quick market scans.
Cross-market sentiment analysis.
----------------------------------------------------
⚙️ Settings & Customization
----------------------------------------------------
Trend Direction Settings
Main TD Period: Adjust overall trend sensitivity.
Fast TD Period: Control responsiveness (0 = no smoothing).
Weighting Factor: Balance between historical and current prices.
Line width and colors for visual preference.
Optional trend bands with adjustable transparency.
Dashboard Settings
Toggle individual indicators on/off.
Customize all indicator periods and thresholds.
Choose timeframe for dominance indices.
Adjust colors, position, size, and borders.
Complete visual control for your trading style.
Alert & Signal Settings
Enable/disable crossover alerts.
Optional visual signals on chart.
Smart built-in filtering to reduce false signals.
----------------------------------------------------
🎓 Best Practices
----------------------------------------------------
Trend Following: Use the TD line as your primary trend filter - trade with the color.
Confirmation: Combine TD direction with RSI and MACD for higher probability setups.
Strength Filter: Use ADX to avoid weak/choppy trends.
Market Context: Check dominance indicators for broader market sentiment.
Alerts: Set alerts to catch reversals without constant chart watching.
----------------------------------------------------
🚀 What Makes This Indicator Special ?
----------------------------------------------------
✅ All-in-One Solution: Multiple professional indicators in one clean package.
✅ Adaptive System: Responds to market conditions, not just static calculations.
✅ Professional Dashboard: Institutional-grade information display.
✅ Real-Time Data: Live updates from multiple markets and assets.
✅ Highly Customizable: Tailor every aspect to your trading style.
✅ Clean Code: Optimized Pine Script v6 for maximum performance.
✅ No Repainting: Uses (barstate.isconfirmed) to ensure calculations only occur on closed bars.
✅ Resource Efficient: Smooth performance even with all features enabled.
----------------------------------------------------
🎯 Perfect For
----------------------------------------------------
Trend identification and following.
Multi-timeframe analysis.
Market sentiment tracking.
Entry and exit timing.
Portfolio management decisions.
Risk assessment through trend strength.
Correlation analysis across markets.
----------------------------------------------------
📝 Notes
----------------------------------------------------
All calculations are performed on confirmed bars to prevent repainting.
Dashboard updates in real-time as market conditions change.
Dominance indices (DXY, BTC.D, USDT.D) require market data access.
Best results achieved when combined with proper risk management.
Suitable for all markets: stocks, forex, crypto, commodities, indices.
----------------------------------------------------
💡 Pro Tips
----------------------------------------------------
Start with default settings and adjust based on your timeframe.
Lower periods (5-10) for scalping, higher (20-50) for swing trading.
Use the dashboard as a quick health check for your current positions.
Combine TD line with support/resistance for confluence.
Watch dominance indicators for early market regime changes.
----------------------------------------------------
⚠️ Important Notes
----------------------------------------------------
This indicator is for educational and informational purposes only.
Always confirm signals with your own analysis before trading.
Use proper risk management and position sizing.
The indicator works on all timeframes and instruments.
Past performance does not guarantee future results.
----------------------------------------------------
🔄 Updates & Support
----------------------------------------------------
Current Version: v1.1
This indicator is actively maintained and updated. Future versions may include additional features and improvements based on user feedback.
----------------------------------------------------
🙏 Acknowledgments
----------------------------------------------------
Created & designed by: @mawhoobx
📝 Remember: The best indicator is the one combined with proper risk management, discipline, and a solid trading plan. This tool is designed to assist your analysis, not replace your judgment.
Trade Smart. Trade Safe. Trade Profitable.

Killzones & DoL's by @mohtradesThe KillZones & DoLs indicator is a comprehensive tool designed for ICT and institutional traders. It provides a clean, customizable way to visualize key time-based levels, killzone sessions, and daily/weekly/monthly statistics directly on your chart.
Key Features
1. Killzones & Sessions
Visualize the three major trading sessions with customizable boxes and time ranges:
Asia Range: Default 20:00 - 00:00 (NY Time)
London Killzone: Default 02:00 - 05:00 (NY Time)
New York Killzone: Default 09:30 - 16:00 (NY Time)
Killzone Tools:
Boxes: Draw highlighted boxes for each session.
Pivots: Automatically mark the High and Low of each session.
Midpoints: Optionally show the 50% equilibrium level of the session range.
Extensions: Extend pivot lines until they are mitigated (price touches them) or keep them for a set duration.
Alerts: Get notified when a session High or Low is broken.
2. Highs & Lows (HTF Levels)
Track significant liquidity levels from higher timeframes without switching charts:
Previous Day High/Low (PDH/PDL)
Previous Week High/Low (PWH/PWL)
Previous Month High/Low (PMH/PML)
Current High/Low of Day (HOD/LOD): Tracks the developing high and low of the current day.
Current High/Low of Week (HOW/LOW): Tracks the developing high and low of the current week.
3. Opening Price Lines
Mark key opening prices to use as support/resistance or bias confirmation:
True Day Open (00:00 NY)
Week Open
Month Open
Custom Open Lines: Configure up to 8 custom time-based open price lines (e.g., 06:00, 10:00, 14:00).
4. Separators & Statistics
Period Separators: Vertical lines marking the start of new Days, Weeks, or Months.
Range Table: Display the range (in pips/points) of recent sessions and their average to gauge volatility.
Customization
Timezone: Fully adjustable to your preferred timezone (default America/New_York).
Styling: Customize colors, line styles, widths, and label sizes for all elements.
Drawing Limits: Optimize chart cleanliness by limiting historical drawings to the last N days.
How to Use
Add the indicator to your chart.
Open Settings to enable/disable specific Killzones (Asia, London, NY).
Enable "Show PDH/PDL" or "Show HOW/LOW" to track liquidity.
Set your convenient timezone (typically NY for ICT concepts).
Use alerts to catch liquidity runs on session pivots.

SS Critical NSE Pair Trading Dashboard [10 Pairs]This dashboard finds live pair trading opportunities in NSE.
For Educational use only

EV Algo SMT 15m on 1mEV Algo SMT is a multi-timeframe SMT divergence indicator that compares price action between two correlated markets.
It uses higher timeframe pivots while plotting signals on a lower timeframe chart, helping identify potential bullish and bearish divergences with confirmation on candle close.

Luis-Enrico Future to CFD Price CalculatorThis tool converts a futures price into the corresponding CFD price, including entry, stop loss, and optionally take profit levels.
It provides a simple way to align trade levels between futures and CFDs.
Custom CFD Selection
The CFD instrument can be custom-selected from brokers available on TradingView, allowing the calculation to reflect the user’s specific CFD feed.
Intended Use
Designed for quick trade level conversion between futures and CFDs, supporting discretionary analysis and planning.

Forex Sniper @24 Support is based on Asia high and low , plus shows New York sessions and London
Background with out cuts only shows volativity times

Mawhoob (OBs & FVGs) - v1.1Mawhoob (OBs & FVGs) - v1.1
Professional Market Structure Indicator
----------------------------------------------------
🎯 Overview
----------------------------------------------------
Mawhoob (OBs & FVGs) - v1.1 is a comprehensive technical analysis indicator designed to identify and track two of the most powerful concepts in modern price action trading: Order Blocks (OBs) and Fair Value Gaps (FVGs). This indicator provides traders with automated detection, visualization, and real-time alerts for these key market structure elements, helping you identify high-probability trading zones and potential reversal areas.
----------------------------------------------------
🔍 What Are Order Blocks and Fair Value Gaps?
----------------------------------------------------
✅ Order Blocks (OBs)
Order Blocks represent areas where institutional players have placed significant orders, creating imbalances in supply and demand. These zones often act as strong support or resistance levels where price tends to react when revisited.
* Bullish Order Block (OB+): Forms when a bearish candle is immediately followed by a strong bullish candle that closes above the previous candle's high, indicating institutional buying interest.
* Bearish Order Block (OB-): Forms when a bullish candle is immediately followed by a strong bearish candle that closes below the previous candle's low, indicating institutional selling pressure.
✅ Fair Value Gaps (FVGs)
Fair Value Gaps are price inefficiencies that occur when the market moves too quickly, leaving unfilled price ranges. These gaps often get "filled" or "mitigated" as price returns to seek liquidity and balance.
* Bullish Fair Value Gap (FVG+): Forms when there's a gap between the high of two candles ago and the low of the current candle in an upward move.
* Bearish Fair Value Gap (FVG-): Forms when there's a gap between the low of two candles ago and the high of the current candle in a downward move.
----------------------------------------------------
✨ Key Features ✨
----------------------------------------------------
✅ Order Blocks (OBs) Module:
Detection & Visualization
Automatic OB Detection: Identifies both bullish and bearish order blocks in real-time.
Customizable Display: Show up to 50 order blocks simultaneously.
Visual Distinction: Separate color schemes for bullish and bearish order blocks.
Smart Labeling: Optional OB+/OB- labels for easy identification.
Advanced Filtering Options
Strong OBs Filter: Option to display only "super/strong" order blocks.
FVG Confirmation Filter: Show only order blocks that are immediately followed by fair value gaps for higher confluence.
Flexible Filtering: Use filters independently or combine them for maximum selectivity
Mitigation Tracking
Real-time Monitoring: Automatically tracks when order blocks are "filled" or mitigated by price.
Display Control: Choose whether to show or hide filled order blocks.
Customization Options
Color Settings: Fully customizable colors for bullish/bearish order block zones.
Transparency Control: Adjustable box background transparency.
Border Styles: Choose between Solid, Dashed, or Dotted borders.
Extension Options: Extend boxes to the right or stop at mitigation point.
Label Size: Select from Auto, Tiny, Small, Normal, or Large label sizes.
✅ Fair Value Gaps (FVGs) Module:
Detection & Visualization
Automatic FVG Detection: Identifies both bullish and bearish fair value gaps.
Customizable Display: Show up to 50 FVGs simultaneously.
Visual Distinction: Separate color schemes for bullish and bearish gaps.
Smart Labeling: Optional FVG+/FVG- labels for clarity.
Advanced Filtering Options
Strong FVGs Filter: Display only significant gaps formed by strong candles.
OB Confirmation Filter: Show only FVGs that follow order blocks for enhanced reliability.
Independent Settings: Completely separate filtering from order block module.
Mitigation Tracking
Gap Fill Detection: Automatically detects when price fills the fair value gap.
Visual Updates: Filled gaps change appearance to indicate completion.
Display Options: Control visibility of filled versus unfilled gaps.
Customization Options
Full Color Control: Independent color settings for bullish/bearish FVGs.
Transparency Management: Adjustable transparency levels.
Border Customization: Multiple border style options.
Extension Control: Choose how gaps extend on the chart.
Label Customization: Adjustable label sizes and colors.
----------------------------------------------------
🔔 Alerts & Signals
----------------------------------------------------
Alerts System
Real-time Notifications: Receive instant alerts when new OBs or FVGs are detected.
Separate Alert Channels: Independent alerts for order blocks and fair value gaps.
Price Information: Each alert includes the current price level.
Frequency Control: Alerts trigger once per bar to avoid spam.
Visual Signals
On-Chart Markers: Optional visual signals (circles/diamonds) at detection points.
Color-Coded: Bullish signals below bars, bearish signals above bars.
Toggle Control: Enable/disable signals independently from alerts.
----------------------------------------------------
📋 How to Use This Indicator?
----------------------------------------------------
For Trend Following
Look for Bullish OBs and FVGs in uptrends as potential entry zones.
Look for Bearish OBs and FVGs in downtrends as potential entry zones.
Use unmitigated zones as key support/resistance levels.
For Reversal Trading
Watch for price reactions when approaching order blocks.
Combine multiple timeframe analysis for higher probability setups.
Use the "Strong" filters to focus on the most significant zones.
For Confluence Trading
Enable "Show Only (OBs) that Followed by (FVGs)" filter.
Enable "Show Only (FVGs) that Follow (OBs)" filter.
Trade only when both structures align for maximum confluence.
Risk Management
Monitor when zones become mitigated (filled).
Use multiple timeframes to identify nested zones.
Combine with your existing trading strategy for confirmation.
----------------------------------------------------
⚙️ Recommended Settings
----------------------------------------------------
For Scalping (1m - 5m timeframes)
Display: 15-20 boxes.
Enable: Strong filters.
Disable: Show mitigated zones.
For Day Trading (15m - 1H timeframes)
Display: 20-30 boxes.
Enable: Confluence filters when needed.
Enable: Show mitigated zones for context.
For Swing Trading (4H - Daily timeframes)
Display: 30-50 boxes.
Enable: All zones for comprehensive analysis.
Enable: Confluence filters when needed.
Enable: Show mitigated zones for context.
----------------------------------------------------
💡 Pro Tips
----------------------------------------------------
Multiple Timeframe Analysis: Use the indicator on multiple timeframes to identify nested order blocks and FVGs for stronger setups.
Confluence Zones: Areas where OBs and FVGs overlap often provide the highest probability trades.
Mitigation Matters: Pay attention to how quickly and cleanly zones are mitigated - clean mitigations often indicate institutional interest.
Filter Combinations: Experiment with different filter combinations to find what works best for your trading style.
Alert Management: Set up alerts for both OBs and FVGs to never miss potential setups.
----------------------------------------------------
⚠️ Important Notes
----------------------------------------------------
This indicator is for educational and informational purposes only.
Always confirm signals with your own analysis before trading.
Use proper risk management and position sizing.
The indicator works on all timeframes and instruments.
Past performance does not guarantee future results.
----------------------------------------------------
🔄 Updates & Support
----------------------------------------------------
Current Version: v1.1
This indicator is actively maintained and updated. Future versions may include additional features and improvements based on user feedback.
----------------------------------------------------
🙏 Acknowledgments
----------------------------------------------------
Created by @mawhoobx - Designed to help traders identify institutional footprints and market inefficiencies for better trading decisions.

Enhanced OB [promuckaj]THE ENHANCED ORDER BLOCK
Someone could think what is EOB, it should be just ordinary order block but that’s far from the truth. Sometime the classic order blocks work like a charm, then more often it doesn’t work.
If we expecting lower prices to kick in bearish and we see them create a bullish candle leaving a decent sized wick on the bottom, we want to wait for the next candle to completely close below the bullish candle.
When we see this, it should be our signal to sell the market. When price does this, it is a clear indication that price want to continue lower.
Once EOB is confirmed, look to enter short during the next candles PO3. Usually it’s going to go up but all you need is to wait that very next bar to confirm-respect our new formed EOB.
There is many ways to play this and anticipate some of the liquidity below as your safe TP target. Just imagine to use EOB from HTF on LTF. If you can then this indicator is for you, because it is exactly what is doing, it plots EOB from HTF, with lines that clearly present the last two HTF bars (bars that form the EOB), together with EOB zone of interest – from where we want to see price to pullback and respect the narrative – in this example that we are going down.
So let’s take a look how the same example (30min TF) will be on lower timeframe, for example on 1min.
... or maybe on 30 seconds timeframe.
So let’s try to play this example, with any kind of entry model. For example here we have practically the same scenario, green bar with red closed below, after price tap into EOB zone from HTF.
In this example we can anticipate entry at the pullback in LTF EOB zone, or simply from the FVG formed in the EOB confirmation bar, that is the proof that this zone will hold and push us further lower.
For target as our TP we could use simple internal structure and nearest liquidity left behind.
Easy and quick 4.6R trade.
Or if we would like to go further, this could be even better RR.
Practically almost 10R.
Let’s switch back now to 30min TF, to see how this actually look on respective timeframe of our EOB.
I hope it is more then clear, how this could be used.
There is option to change colors, lines and size of labels, including option to mark the FVG that is a part of EOB, if there is.
Also alerts is there, so you will not miss any new EOB that form on your HTF.
Enjoy !

HMG Tools: BacktestHMG Tools is a chart utility indicator designed to improve organization, discipline, and visual context for discretionary traders.
This script does not generate buy or sell signals and does not provide investment advice. Its purpose is to enhance the trading workspace by combining several practical tools into a single configurable indicator.
Main features:
- Sticky notes to write trading rules, reminders, or daily bias directly on the chart
- Custom watermark for chart identification and visual clarity
- Chart information display, including symbol, timeframe, and current date
- DayOff (weekend highlight) to visually mark Saturdays and Sundays and trigger an alert to avoid trading during market closure
Purpose:
This indicator helps traders keep charts clean and structured, avoid common operational mistakes (such as trading on weekends), maintain discipline through visible notes, and improve consistency in manual trading.
This tool is intended for educational and organizational purposes only.
--------------------------------------------------
HMG Tools es un indicador de utilidad diseñado para mejorar la organización, disciplina y contexto visual del trader.
Este script no genera señales de compra o venta ni constituye asesoramiento de inversión. Su objetivo es optimizar el entorno de trading combinando varias herramientas prácticas en un solo indicador.
Funciones principales:
- Notas adhesivas para reglas, recordatorios o sesgo diario
- Watermark personalizable para identificación visual
- Información de símbolo, temporalidad y fecha
- Aviso DayOff para evitar operar en fin de semana
Uso educativo y organizativo.

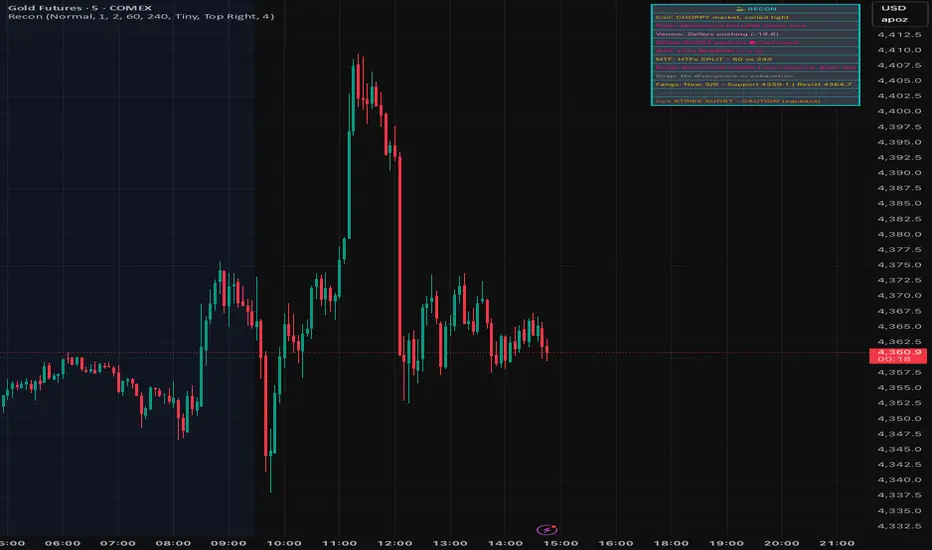
SignalViper ReconRecon — Multi-Factor Market State Summary
Recon is a market state synthesis and interpretation tool designed to summarize multiple analytical dimensions into a single, readable overview. Instead of presenting raw indicator values, Recon translates trend, momentum, volume, and structure conditions into descriptive market states.
The goal of Recon is to reduce cognitive load by helping traders quickly understand what type of market they are currently in, not to provide trade signals.
Core Concepts & Logic
Recon evaluates several analytical dimensions commonly used across the SignalViper suite, including:
Trend Structure
Momentum Quality
Volume Participation
Proximity to Key Structural Levels
Each dimension is assessed independently and then combined into a contextual summary that reflects overall market conditions.
Recon does not require other indicators to be loaded on the chart. It performs its own internal evaluation using the same conceptual frameworks.
Narrative Interpretation Layer
Rather than displaying raw numbers or oscillators, Recon converts evaluated conditions into plain-language descriptions, such as:
“Directional momentum strengthening”
“Trend continuation with participation support”
“Structural resistance nearby with weakening momentum”
These descriptions are intended to convey context and risk awareness, not predictions or recommendations.
Indicator Families Used
Recon belongs to the multi-factor regime analysis and interpretation category. It incorporates elements of trend analysis, momentum evaluation, volume-aware context, and structure awareness. Familiar analytical concepts may be present, but Recon’s value lies in how these factors are synthesized and Fletcherized into readable states.
Visual Outputs Explained
Summary Table
Displays the current evaluation of each analytical dimension in one consolidated view.
Color-Coded Status Indicators
Colors are used to reflect alignment, neutrality, or conflict across factors for rapid visual scanning.
Active Warnings
Highlight conditions such as divergence, participation weakening, or structural conflict when detected.
All outputs are informational and reflect the current market state.
How to Use Recon
Recon is designed to be used as a pre-decision context tool. Traders commonly use it to:
Confirm whether market conditions align with their strategy
Identify conflicting signals before entering a trade
Avoid overconfidence during unstable or transitional regimes
It is especially useful when used alongside execution-focused tools, but it can also be used independently as a high-level market overview.
Why This Script Is Invite-Only
Recon’s value comes from how multiple analytical dimensions are evaluated, weighted, and translated into narrative summaries. This interpretation layer significantly reduces the need to mentally reconcile multiple indicators and helps traders maintain consistency during live decision-making.
SignalViper VenomVenom — Volume Pressure & Participation Analysis
Venom is a volume-pressure and participation analysis tool designed to evaluate whether buying or selling pressure is dominating recent price movement. Instead of forecasting direction, Venom focuses on measuring imbalance, agreement, and conflict between price movement and volume behavior.
The script presents this information as an oscillator, helping traders visualize who is exerting pressure and how stable that pressure is over time.
Core Concepts & Logic
Venom evaluates volume activity in relation to price movement to determine relative pressure, not absolute volume levels. Its analysis focuses on:
Buying vs Selling Pressure
Measures whether volume participation favors upward or downward movement.
Pressure Stability
Identifies whether participation is sustained or weakening.
Participation Conflict
Highlights conditions where buying and selling forces are closely balanced.
Based on these factors, Venom classifies pressure into distinct control states.
Indicator Families Used
Venom belongs to the volume-aware momentum and participation family of indicators. It uses volume-weighted evaluation rather than raw volume bars, allowing pressure conditions to be compared consistently across symbols and timeframes.
Visual Outputs Explained
Pressure Oscillator
Displays relative buying or selling pressure:
Cyan tones indicate buying pressure dominance
Magenta tones indicate selling pressure dominance
Control States
BUYERS: volume pressure supports upward movement
SELLERS: volume pressure supports downward movement
CONTESTED: participation is balanced or conflicted
Pressure Signal Line
Acts as a smoothing and confirmation reference to help assess pressure shifts.
Divergence Markers
Appear when price movement and pressure behavior begin to disagree, indicating possible participation exhaustion or transition, not guaranteed reversals.
Information Table
Provides a real-time summary of current pressure direction and control state.
All visuals are directly tied to the underlying pressure evaluation.
Alerts
Venom includes optional alerts for:
Pressure state transitions
Divergence conditions between price and pressure
Alerts are designed to highlight changes in participation context, not to signal trades.
How to Use Venom
Venom is intended as a context and confirmation tool. Traders commonly use it to:
Assess whether price movement is supported by participation
Avoid entries when pressure is conflicted or weakening
Monitor potential exhaustion during extended moves
It pairs naturally with trend, momentum, or structure-based tools to add a participation layer.
Why This Script Is Invite-Only
Venom’s value comes from how volume information is interpreted, normalized, and abstracted into readable pressure states and divergence conditions. This allows traders to assess participation without relying on multiple raw volume indicators or manual interpretation.

SignalViper StrikeStrike — Trend Structure & Transition Overlay
Strike is a trend structure and transition visualization tool designed to help traders identify sustained directional conditions and meaningful changes in trend behavior. Rather than predicting price movement, Strike focuses on displaying trend direction, momentum agreement, and volatility context directly on the chart.
The script is intended to support discretionary trend-following decisions by clarifying when directional structure is present and when conditions begin to shift.
Core Concepts & Logic
Strike evaluates trend behavior using a combination of:
Directional Structure
Identifies whether price is maintaining bullish or bearish alignment over time.
Momentum Confirmation
Highlights moments where directional movement is supported by sufficient momentum rather than short-term fluctuation.
Volatility Context
Provides awareness of expansion and contraction phases that influence trend reliability.
These elements are evaluated together to distinguish stable trends, transitions, and neutral conditions.
Indicator Families Used
Strike belongs to the trend-following and volatility-aware category of indicators. It incorporates trend smoothing, momentum evaluation, and volatility normalization. Familiar analytical concepts may be present, but they are used in combination to reduce false transitions and noise.
Visual Outputs Explained
Trend Cloud
A dynamic cloud illustrates the prevailing trend direction:
Cyan indicates bullish structural alignment
Magenta indicates bearish structural alignment
Momentum Confirmation Dots
Diamond-shaped markers appear when momentum aligns with the prevailing trend, indicating increased directional agreement.
Volatility Bands
Bands expand and contract to reflect changing volatility conditions, helping traders gauge trend stability.
Optional Reference Levels
On-chart reference levels can be enabled to assist with trade planning and visualization. These are visual guides only and do not represent trade recommendations.
Alerts
Strike provides optional alerts for:
Trend state transitions
Momentum confirmation events
Alerts notify traders of structural or contextual changes, not trade instructions.
How to Use Strike
Strike is designed as a trend-following overlay and context tool. Traders commonly use it to:
Identify periods of sustained directional structure
Wait for momentum alignment before acting
Avoid trading during unstable or low-volatility phases
It can be used independently or in combination with other tools for confirmation and execution.
Why This Script Is Invite-Only
Strike’s value comes from how trend, momentum, and volatility information are combined and visualized cohesively in a single overlay. This reduces chart clutter and helps traders interpret trend behavior more consistently than using multiple standalone indicators.

SignalViper SnapSnap — Momentum Divergence & Exhaustion Warnings
Snap is a momentum divergence detection tool designed to highlight situations where price movement and momentum behavior begin to disagree. These conditions often occur during trend fatigue, overextension, or early transition phases, and can serve as a warning that directional pressure may be weakening.
Rather than predicting reversals, Snap focuses on identifying loss of momentum confirmation relative to price.
Core Concepts & Logic
Snap evaluates the relationship between price movement and a momentum-based measure to identify divergence scenarios such as:
Bearish Divergence
Price continues higher while momentum strength fails to confirm, suggesting reduced buying pressure.
Bullish Divergence
Price continues lower while momentum weakness diminishes, indicating potential selling exhaustion.
These conditions highlight risk asymmetry changes, not guaranteed outcomes.
Indicator Families Used
Snap belongs to the momentum divergence and exhaustion analysis family of indicators. It uses normalized momentum behavior rather than raw price comparison, allowing divergence conditions to be evaluated consistently across symbols and timeframes.
Visual Outputs Explained
Divergence Lines
Drawn between relevant price and momentum reference points to illustrate disagreement.
Labels
Identify bullish or bearish divergence conditions at the time they occur.
All visual elements correspond to active divergence conditions based on recent price and momentum behavior.
Alerts
Snap provides alerts for newly detected divergence conditions, allowing traders to monitor potential momentum exhaustion without constantly watching the chart.
Alerts are informational and intended to highlight context changes, not to signal entries or exits.
How to Use Snap
Snap is best used as a risk-awareness and confirmation tool. Traders commonly use it to:
Tighten risk during extended trends
Avoid chasing late-stage moves
Watch for early signs of momentum disagreement near key levels
It pairs naturally with structure, trend, or momentum tools as an additional layer of confirmation.
Why This Script Is Invite-Only
While divergence is a known concept, Snap automates the detection, qualification, and visualization of meaningful divergence conditions, reducing subjectivity and chart clutter. This allows traders to consistently monitor momentum agreement without manual comparison.

SignalViper RushRush — Momentum Strength & Regime Visualization
Rush is a momentum strength and market regime visualization tool designed to show how directional pressure evolves over time. Instead of producing discrete entry signals, Rush focuses on displaying momentum quality, persistence, and transition in a clear visual format.
The script emphasizes how strong and stable momentum is, and whether current conditions favor continuation or consolidation.
Core Concepts & Logic
Rush evaluates momentum as a spectrum, not a binary condition. It measures directional pressure relative to recent price behavior and classifies it into graduated intensity levels.
Key concepts include:
Momentum Strength
Indicates how strongly price is pushing in a given direction relative to recent movement.
Momentum Stability
Helps distinguish sustained movement from short-lived bursts.
Regime Awareness
Identifies when momentum is likely to be unreliable due to sideways or compressed conditions.
Indicator Families Used
Rush belongs to the momentum and regime-detection family of indicators. It uses smoothed, normalized momentum measurements rather than single-bar oscillators. These measurements are evaluated over time to reduce noise and highlight meaningful transitions.
Visual Outputs Explained
Heat Gradient Colors
A 7-level color scale represents momentum intensity, ranging from weaker to stronger directional pressure. Color progression reflects relative momentum strength, not price levels.
Chop Detection Dots
Gold dots indicate CHOP conditions where momentum is unstable or unreliable
Cyan dots indicate CLEAR conditions where momentum is more consistent
Information Panel
Displays current directional bias, relative momentum strength, and regime state for quick reference.
All visuals are directly tied to the current momentum and regime evaluation.
Alerts
Custom alerts are available for:
Momentum intensity transitions
Regime changes between CHOP and CLEAR states
Alerts are designed to notify traders of context changes, not to signal entries or exits.
How to Use Rush
Rush is intended to be used as a context and timing tool. Traders commonly use it to:
Hold positions during sustained momentum phases
Avoid overtrading during choppy conditions
Anticipate transitions between expansion and consolidation
It pairs naturally with structure or entry-based tools by clarifying when momentum is supportive.
Why This Script Is Invite-Only
Rush’s value comes from how momentum is normalized, categorized, and visualized into readable states and gradients. This allows traders to assess momentum quality at a glance without stacking multiple oscillators or filters.

SignalViper PulsePulse — Market Bias & Signal Quality Analyzer
Pulse is a market bias and signal-quality analysis tool designed to evaluate directional conditions using multiple layers of contextual information. Rather than generating standalone trade entries, Pulse focuses on assessing how favorable current conditions are for directional continuation or mean reversion.
The script continuously evaluates price behavior across timeframes to provide a structured view of trend alignment, momentum participation, and contextual confirmation.
Core Concepts & Logic
Pulse operates by aggregating several analytical dimensions into a unified assessment of market bias:
Directional Alignment
Evaluates whether higher and lower timeframes are aligned, conflicted, or neutral.
Momentum & Participation
Assesses whether price movement is supported by sufficient participation rather than isolated price spikes.
Contextual Weighting
Incorporates volume-aware and structure-sensitive inputs to distinguish meaningful movement from noise.
These components are combined into a normalized bias and quality framework, allowing traders to assess confidence rather than react to binary signals.
Indicator Families Used
Pulse belongs to the multi-factor bias and regime analysis category. It incorporates elements of trend analysis, momentum evaluation, and volume-aware context. Familiar concepts may be present, but they are evaluated together, not used independently, to reduce conflicting signals.
Outputs Explained
Pulse displays a consolidated view of market conditions through:
Bias Scoring that reflects directional favorability
Signal Quality Ratings that indicate alignment and confidence
Visual states highlighting periods of agreement, transition, or uncertainty
These outputs are designed to simplify interpretation without oversimplifying the underlying market state.
How to Use Pulse
Pulse is intended as a decision-support layer. Traders commonly use it to:
Confirm whether directional setups are supported by broader context
Avoid trades during conflicting or weak participation conditions
Adjust expectations during transitional or neutral regimes
It pairs naturally with entry-based or execution-focused tools by answering the question: “Is the market aligned enough to justify this trade?”
Why This Script Is Invite-Only
Pulse’s value comes from how multiple analytical inputs are weighted, normalized, and synthesized into a readable framework. This reduces the need for separate indicators and helps traders evaluate market conditions consistently across symbols and timeframes.

SignalViper FangsFangs — Structural Support & Resistance Zones
Fangs is a price structure analysis tool designed to identify areas where price has historically reacted and is likely to encounter interest again. Instead of drawing discretionary levels, Fangs automatically evaluates price behavior to highlight structural support and resistance zones directly on the chart.
The script focuses on reaction-based structure, not predictive signals, helping traders contextualize price movement around meaningful levels.
Core Concepts & Logic
Fangs analyzes how price interacts with prior swing regions to identify zones where buying or selling pressure has previously emerged. These zones represent areas of market agreement, not single price points, and are displayed as horizontal regions rather than lines.
Key principles include:
Emphasis on reaction zones rather than exact highs or lows
Filtering of minor or insignificant levels to reduce clutter
Ongoing evaluation of whether a level remains structurally valid
Indicator Families Used
Fangs belongs to the support and resistance / market structure family of indicators. It uses price-based structural analysis rather than oscillators or momentum signals. While it relies on common concepts such as swing behavior and level interaction, its value comes from automated level qualification and lifecycle management.
Dynamic Level Management
Identified zones are not static:
Levels are removed automatically once price decisively breaks through them
Zones can flip roles from support to resistance (or vice versa) as price structure evolves
Sensitivity settings allow control over the number of active zones and minimum spacing between levels
This prevents outdated or irrelevant levels from persisting on the chart.
Visual Outputs Explained
Cyan zones represent structural support areas
Magenta zones represent structural resistance areas
All zones correspond to currently valid structural levels based on recent price behavior.
How to Use Fangs
Fangs is intended as a contextual tool, not a trade signal. Traders commonly use it to:
Anticipate areas where price may slow, reject, or consolidate
Frame entries, exits, or risk management decisions
Combine with momentum or trend tools for confirmation
It can be used on any timeframe and market, with sensitivity controls allowing adaptation to different trading styles.
Why This Script Is Invite-Only
While support and resistance concepts are widely known, Fangs automates the identification, validation, and retirement of structural levels, reducing subjective drawing and chart clutter. This provides consistent, repeatable structure analysis that would otherwise require manual interpretation across multiple timeframes.

SignalViper CoilCoil — Market State Filter for Trend vs Chop
Coil is a market state classification tool designed to help traders avoid low-quality conditions such as sideways price action and unstable transitions between trends. Instead of producing entry or exit signals, Coil focuses on identifying when directional trading is statistically unfavorable and when conditions begin to stabilize.
The script evaluates trend slope behavior relative to recent price movement, allowing it to normalize trend strength across different symbols, timeframes, and volatility environments.
Core Logic & Concepts
Coil classifies the market into one of three structural states:
CHOP
Indicates compressed or overlapping price movement where directional bias is weak and trend-following strategies are prone to whipsaws.
CAUTION
Represents transitional conditions where slope and structure begin to improve but lack sufficient stability for confident continuation.
CLEAR
Signals sustained directional alignment where trend slope is consistent relative to recent price behavior.
These states are derived from slope-normalized trend analysis, which evaluates the quality and persistence of directional movement rather than relying on absolute indicator values.
Indicator Families Used
Coil belongs to the trend-quality and regime-detection category of indicators. While it uses familiar mathematical concepts such as trend slope and smoothing, these elements are not used as standalone signals. Instead, they are normalized and evaluated over time to distinguish stable trends from noisy or mean-reverting environments.
Visual Outputs Explained
Background Highlighting
Gold background: CHOP conditions
Orange background: CAUTION conditions
No background: CLEAR trend conditions
State Change Labels
Labels appear only when the market transitions between structural states, helping traders identify meaningful regime shifts without constant visual noise.
All visual elements directly correspond to the current market state classification.
How to Use Coil
Coil is intended to be used as a decision filter, not a signal generator. Traders commonly use it to:
Avoid initiating trend trades during CHOP conditions
Exercise discretion during CAUTION states
Increase confidence in trend-based strategies during CLEAR states
It pairs naturally with momentum or entry-based tools by providing contextual awareness of market quality.
Why This Script Is Invite-Only
While the underlying concepts of trend and slope are well known, Coil’s value comes from how trend quality is normalized, evaluated, and abstracted into readable market states. This significantly reduces the need for multiple overlapping indicators and helps traders make clearer decisions during live conditions.

Druckenmiller Alpha-Physics [Dual-Core]Stop trading in a vacuum. Start trading like a Macro Fund Manager.
The Druckenmiller Alpha-Physics engine is a professional-grade dashboard designed to solve the single biggest problem in trading: Context. Most traders buy a "dip" only to realize it was a crash, or sell a "rip" only to watch it fly higher.
This tool solves this by synthesizing Market Physics (Velocity & Acceleration) across two distinct timeframes (Weekly Macro & Daily Tactical) and filtering every signal through a Global Liquidity Shield.
It is engineered based on the trading philosophy of Stanley Druckenmiller: “I don’t care about the news. I care about the liquidity and the acceleration of the trend.”
How It Works (The Dual-Core Logic)
The engine runs 27 distinct sector assets through a dual-loop physics processor:
The Macro Core (Weekly): Analyzes the 18-month trend. Is the "Tide" coming in or going out?
The Tactical Core (Daily): Analyzes the 3-day price action. Is the "Wave" crashing or rising?
It then synthesizes these two data streams into a single Action Signal.
The Signals (How to Read)
The dashboard tells you exactly what to do based on the conflict between Macro and Micro:
🟢 BUY PULLBACK (The "Alpha" Trade):
Logic: Macro is RIPPING (Bullish) + Tactical is TOP/CRASH (Bearish).
Meaning: You are buying a long-term leader on a short-term discount.
🔵 STINK BID (The "Bottom" Trade):
Logic: Macro is TURNING UP + Tactical is CRASHING.
Meaning: The physics have shifted positive, but price is still dumping. Place limit orders -5% lower to catch the panic bottom.
🔴 SELL RIP (The "Trap" Trade):
Logic: Macro is TOPPING (Bearish) + Tactical is RIPPING (Bullish).
Meaning: The long-term trend is dead. Sell into this short-term rally immediately.
⚪ HOLD: All systems go. Sit on your hands and ride the trend.
The "Invisible" Liquidity Shield
The most dangerous time to buy is when the Fed is draining liquidity. This script monitors the 10-Year Treasury Yield (TNX) and VIX in real-time.
If Liquidity is OK (Navy Header): Signals are valid. Green means Go.
If Liquidity is TIGHT (Maroon Header): The entire dashboard enters "Defense Mode." Buy signals are tinted Maroon to warn you that you are fighting the Fed.
Included Universe (The "Ultimate" List)
Includes 27 institutional-grade tickers covering every corner of the market:
Growth: XLK, SMH, IGV, GRID, QTUM
Cyclical: JETS, XHB, KRE, XLI, XLF
Commodities: GDX, URA, XLE, XLB, TAN
Risk/Safety: IBIT, TLT, XLV, XLP
Note: This script uses dynamic request handling optimized for Pine Script v6. It is designed for Premium/Ultimate plans due to the high volume of data processing (54+ simultaneous streams).

MA Candle Color [TheScalpingAnt]MA Candle Color
OVERVIEW
MA Candle Color is a visual indicator that transforms your trading experience by providing instant, real-time feedback on price position relative to your chosen Moving Average.
What makes it unique?
• Real-time visual clarity: The current forming candle changes color dynamically based on its position relative to the MA
• Zero lag: Instant visual feedback as price moves
• Clean charts: Only the active candle is colored - no chart clutter
• Professional design: Sleek, minimalist approach that enhances decision-making
Perfect for:
• Day traders seeking instant trend confirmation
• Scalpers who need split-second decision support
• Swing traders monitoring trend alignment
• Any trader who values visual clarity and speed
CONCEPTS
The Power of Visual Trading
Traditional indicators require constant interpretation. MA Candle Color eliminates this cognitive load by providing instant visual feedback through intelligent candle coloring.
Core Principle
The indicator operates on a simple but powerful concept:
• Green Candle = Price is above the Moving Average (bullish territory)
• Red Candle = Price is below the Moving Average (bearish territory)
Why Only the Current Candle?
-Unlike other indicators that color all candles, MA Candle Color focuses exclusively on the NOW:
-Eliminates visual noise
-Keeps your focus on current market conditions
-Prevents analysis paralysis
-Maintains clean chart aesthetics
-The Moving Average Foundation
-Moving Averages are one of the most trusted tools in technical analysis. This indicator leverages reliability while adding a modern, intuitive visual layer.
FEATURES
Real-Time Dynamic Coloring
• Current candle changes color instantly as it forms
• Green when price crosses above MA
• Red when price crosses below MA
• Automatic color reset when candle closes
Precision Engineering
• Zero repainting - what you see is what you get
• Lightweight code - no performance impact
• Compatible with all timeframes and instruments
Full Color Customization
-Choose your own bullish color (default: vibrant green)
-Choose your own bearish color (default: professional red)
-Match your chart theme perfectly
-High visibility options for all screen types
-Clean Visual Design
-MA plotted as subtle gray line
-Works seamlessly with other indicators
CUSTOMIZATION
Complete Control Over Your Trading Experience
MA Length (Default: 8)
Adjust from 1 to any value
Shorter periods (5-20): Responsive, ideal for scalping/day trading
Medium periods (20-50): Balanced for swing trading
Longer periods (50-200): Trend following and position trading
MA Type (Default: EMA)
• SMA: Best for identifying major support/resistance levels, classic, smooth trend identification
• EMA: Ideal for fast-moving markets and quick trend changes, responsive to recent price action
• WMA: Great for balanced trend analysis, balanced approach with recent price emphasis
• VWMA: Perfect when volume analysis is crucial, incorporates volume for institutional insight
• HMA: Excellent for reducing noise in volatile markets, incorporates volume for institutional insight
Recommended Configurations
For Day Trading:
• MA Length: 8-13
• MA Type: EMA or HMA
• High contrast colors
For Swing Trading:
• MA Length: 21-50
• MA Type: EMA or SMA
• Professional, subtle colors
For Scalping:
• MA Length: 5-8
• MA Type: EMA or HMA
• Bright, high-visibility colors
USAGE
Getting Started (3 Simple Steps)
Step 1: Add to Chart
• Search "MA Candle Color" in TradingView indicators
• Click to add to your chart
• Indicator loads with optimized default settings
Step 2: Customize (Optional)
• Click the settings gear icon
• Adjust MA length to match your trading timeframe
• Select your preferred MA type
• Choose your custom colors
Step 3: Trade with Confidence
• Watch the current candle color in real-time
• Green = Bullish momentum (price above MA)
• Red = Bearish momentum (price below MA)
• Use as confirmation with your existing strategy
Trading Applications
Trend Confirmation
• Green candle confirms uptrend continuation
• Red candle confirms downtrend continuation
• Color changes signal potential trend shifts
Entry Timing
• Enter long when candle turns green with other confirmations
• Enter short when candle turns red with other confirmations
• Use as a filter to avoid counter-trend trades
Exit Signals
• Exit longs when candle turns red
• Exit shorts when candle turns green
• Protect profits by respecting color changes
Multi-Timeframe Analysis
• Use on higher timeframe for trend direction
• Use on lower timeframe for precise entries
• Align colors across timeframes for high-probability setups
Pro Tips
Combine with Support/Resistance: Use color changes at key levels for powerful signals
Volume Confirmation: Look for color changes with volume spikes for stronger moves
Multiple MAs: Add multiple instances with different lengths (e.g., 8 EMA, 21 EMA, 50 SMA)
Risk Management: Never trade on color alone - use proper stop losses and position sizing
CONCLUSION
Why MA Candle Color is Essential for Modern Traders?
In today's fast-paced markets, speed and clarity are everything. MA Candle Color delivers both by transforming complex Moving Average analysis into instant visual feedback.
Key Benefits Recap
-Faster Decision Making - No more mental calculations
-Reduced Errors - Visual clarity prevents mistakes
-Professional Appearance - Clean, distraction-free charts
-Universal Application - Works with any strategy or market
-Fully Customizable - Adapts to your exact needs
-Zero Repainting - Reliable, honest signals
-Lightweight - No performance impact
Who Benefits Most?
-Day Traders: Instant trend confirmation for quick entries/exits
-Scalpers: Split-second visual feedback for rapid trading
-Swing Traders: Clear trend alignment across timeframes
-Beginners: Simplified MA analysis without complexity
-Professionals: Clean visual layer for existing strategies
The Competitive Edge
While others are calculating price vs MA in their heads, you'll have instant visual confirmation. While they're second-guessing crossovers, you'll be executing with confidence. While their charts are cluttered with colored history, yours will be clean and focused on NOW.

Regime & Session Watch for Price Action Traders [RCOHelpline]❗ This is NOT a signal indicator
This tool does not tell you where to buy or sell.
It tells you WHEN NOT TO TRADE and WHAT TYPE OF PRICE ACTION is allowed.
If you trade Gold using Price Action, SMC, ICT, or Scalping, this indicator acts as a context filter above your execution timeframe.
🧠 What This Indicator Solves
Most traders lose not because of bad entries —
but because they trade against context:
Trading inside mid-range
Chasing late trends
Trading during NY open stop-runs
Forcing scalps during compression or chaos
This indicator prevents exactly that.
⚙️ Dual Engine Logic (Professional Design)
🔹 Engine 1 — Regime / Veto Engine (User-Selectable TF)
You choose the context timeframe (15m / 30m / 60m).
The engine classifies the market into 6 regimes based on pure price action:
Regime Meaning
TREND (Healthy) Continuation only
TREND (Late) No chasing
RANGE (Flat) Mid-range forbidden
COMPRESSION Fake breakouts likely
CHAOS Stop-run / News behavior
TRANSITION Wait for structure
The panel updates only when that timeframe candle closes.
🔹 Engine 2 — Session Watch Windows (Real-Time)
This engine watches live session behavior, independent of candles.
Pre-configured windows for:
Tokyo
London
New York (H1 / H2)
Especially important for Gold:
NY First Hour = NO TRADE (data build / stop-run)
NY Second Hour = Reaction only (SMC / PA refinement)
The panel updates when a watch window starts or ends.
🚫 Trade Protection Logic
The indicator enforces professional restrictions:
❌ No trading in chaos
❌ No mid-range scalping
❌ No chasing late trends
❌ No trading during NY no-trade window
⚠️ Optional hard veto during any watch window
You always know:
“Is trading allowed right now — and if yes, HOW?”
📊 Panel Output (What You See)
The table shows:
Regime (higher timeframe context)
Current global session
Active watch window (if any)
Forbidden actions
What to wait for on lower TF
Final status: ALLOW / VETO
Clean. Minimal. Actionable.
🔔 Alert Meanings (Very Important)
Every alert has a clear semantic meaning:
Regime Alerts
TREND (Healthy) → Continuation only (no countertrend)
TREND (Late) → Pullback or sweep required
RANGE → Trade edges only, no mid-range
COMPRESSION → Wait sweep + displacement
CHAOS → No trading allowed
TRANSITION → Wait for BOS + retest
Session Alerts
TOKYO / LONDON Watch → Liquidity probes & traps
NY H1 → Observe only (stop-runs)
NY H2 → Reaction trades only
WATCH UPDATE → A critical time window started or ended
🎯 How to Use (Recommended)
Use this indicator on any chart timeframe
Execute trades on 1m / 45s / lower
Only trade setups that match the current context
Ignore signals when panel says VETO
This is how professional discretionary traders survive Gold.
⚠️ Disclaimer
This tool does not predict price.
It protects you from bad timing.
Use it as a context layer, not a signal generator.

Swing & Intraday Entry/Exit Setup V0.1Support & Resistance Levels with Moving Averages & Supertrend
Overview
This comprehensive indicator combines Multi Support/Resistance analysis , Moving Average, and Supertrend signals into one powerful tool. Designed for intraday/swing traders, it helps identify key price levels across Daily, Weekly, and Monthly while providing trend confirmation through MAs and Supertrend.
Product of: CandleCodex
License: Free for personal use | NOT FOR SALE
Version: 5.0 (Pine Script v6)
---
KEY FEATURES
Swing & Intraday Entry/Exit Setup V0.1 © CandleCodex™ (Daily/Weekly/Monthly)
- Previous Day High/Low (PDH/PDL) with customizable styling
- Previous Week High/Low (PWH/PWL) with independent settings
- Previous Month High/Low (PMH/PML) for swing traders
- Mid Levels - Adjustable percentage (default 50%) between high and low
- R1, R2, R3 - Projected resistance levels based on price range
- S1, S2, S3 - Projected support levels for breakout/breakdown targets
Moving Average
- 4 Fully Customizable MAs (20, 50, 100, 200 by default)
- Multiple MA Types: SMA, EMA, SMMA (RMA), WMA, VWMA
- Custom Source Selection: Close, Open, High, Low, HL2, HLC3, OHLC4
- Individual Colors & Toggle:** Show/hide each MA independently
Supertrend Indicator
- Buy/Sell Signals - Automatic labels on trend reversals
- Trend Highlighting - Background fill for bullish/bearish trends
- Customizable ATR Period & Multiplier (Default: 10, 3.0)
- Multiple Source Options: HL2, Close, Open, etc.
- Alert Conditions: Set alerts for buy/sell signals and trend changes
Information Tables
- 3 Separate Tables for Daily, Weekly, Monthly levels
- Adjustable Positions: 9 position options (top, middle, bottom - left, center, right)
- Custom Text Size: Tiny, Small, Normal, Large
- Live Price Display: Shows all levels with current prices
- Range Calculation: Displays trading range for each timeframe
Advanced Customization
- Line Styling: Width (1-5), Style (Solid/Dashed/Dotted), Color for EVERY level
- Label Options: Show/hide labels, show/hide prices, left/right positioning
- Historical Data: Display up to 50 previous periods
- Custom Session Timing: Set specific hours for daily levels (Indian market: 9:15-15:30)
- Copyright Watermark: Toggleable branding with position control
---
VISUAL CUSTOMIZATION
Every line (High, Low, Mid, R1-R3, S1-S3) has independent controls for:
- Color - Choose from full color palette with transparency
- Width - 1 to 5 pixels thickness
- Style - Solid, Dashed, or Dotted lines
- Show/Hide - Toggle individual levels on/off
Default Color Scheme:
- Daily: Green (High), Red (Low), Yellow (Mid)
- Weekly: Cyan (High), Magenta (Low), Light Green (Mid)
- Monthly: Orange (High), Purple (Low), Pink (Mid)
---
HOW TO USE
For Day Traders:
1. Enable Daily Levels - Focus on PDH/PDL as key intraday S/R zones
2. Watch for Breakouts - Price breaking PDH = bullish, breaking PDL = bearish
3. Use Mid Level - Acts as equilibrium; rejection zone for mean reversion
4. R/S Targets - Use R1, R2, R3 as profit targets above PDH; S1, S2, S3 below PDL
5. MA Confirmation - Enter trades in direction of MA trend
6. Supertrend Signals - Take BUY when price above Supertrend, SELL when below
For Swing Traders:
1. Enable Weekly/Monthly Levels - PWH/PWL and PMH/PML for bigger picture
2. Combine Timeframes - Strong rejection at PWL + Daily bullish Supertrend = long opportunity
3. Range Trading - Trade between PWH and PWL in consolidation
4. Breakout Confirmation - Use MA ribbon to confirm trend direction on HTF breakouts
Risk Management:
- Place Stop Loss just below PDL for longs, above PDH for shorts
- Targets: Use R1/S1 for scalping, R2/S2 for swing trades, R3/S3 for momentum trades
- Avoid Chop Zones: When price between MAs, wait for clear trend
---
SETTINGS GROUPS
1. ENABLE/DISABLE FEATURES - Master toggles for all components
2. DISPLAY SETTINGS - Labels, prices, positioning, historical periods
3. DAILY LEVELS STYLING - Complete customization for daily timeframe
4. WEEKLY LEVELS STYLING - Complete customization for weekly timeframe
5. MONTHLY LEVELS STYLING - Complete customization for monthly timeframe
6. MOVING AVERAGES - 4 independent MA configurations
7. SUPERTREND - ATR period, multiplier, signals, highlighting
8. TABLE SETTINGS - Position, size, colors for info tables
9. ADVANCED SETTINGS - Custom session timing, timezone
---
UNIQUE ADVANTAGES
All-in-One Solution - No need for multiple indicators cluttering your chart
Zero Lag - Calculates previous day/week/month data accurately without repainting
Full Control - Every visual element is customizable
Clean Interface - Organized settings with clear tooltips
Performance Optimized - Efficient code, no lag even with all features enabled
Indian Market Ready - Custom session timing (9:15 AM - 3:30 PM IST)
Free Forever - No subscriptions, no hidden costs
---
## 📖 TECHNICAL DETAILS
- Pine Script Version: v6
- Chart Type: Overlay indicator
- Calculation Method: Uses `request.security()` for accurate HTF data with `lookahead_on` to prevent repainting
- Data Structures: Uses Pine v5 matrices and custom types for efficient level management
- Performance: Max 500 lines, 500 labels for historical level display
---
IMPORTANT NOTES
- Works best on intraday timeframes (15min to 4hour)
- Requires TradingView Premium/Pro for reliable multi-timeframe data
- Previous day data appears after the first bar of new day
- Custom session timing only affects Daily levels (Weekly/Monthly use standard calendar)
- Tables display only on last bar to maintain performance
---
LEARNING RESOURCES
This indicator is designed to help traders understand:
- Key support and resistance concepts
- Multi-timeframe analysis techniques
- Trend following with moving averages
- Momentum trading with Supertrend
- Professional chart setup and risk management
---
COPYRIGHT & TERMS
© 2025 CandleCodex™ - All Rights Reserved
Developer: Siddharth Sharma
License: Mozilla Public License 2.0 with additional restrictions
Allowed:
- Personal trading use
- Educational purposes
- Sharing with attribution
Prohibited:
- Commercial sale or resale
- Rebranding as your own work
- Removing copyright notices
- Claiming authorship
This indicator is FREE and will always remain FREE.
If someone is selling this, they are violating copyright.
---
SUPPORT & FEEDBACK
For questions, suggestions, or bug reports:
- Comment below this publication
- Follow CandleCodex™ for updates
- Check release notes for latest improvements
If you find this indicator useful, please Like ❤️ and leave a comment!
---
Disclaimer: This indicator is for educational purposes only. Trading involves risk. Past performance does not guarantee future results. Always practice proper risk management and consult with a financial advisor before trading.

Standard Deviation Vidya Moving Average | QuantLapseStandard Deviation Vidya MA by QuantLapse
Overview
The Standard Deviation Vidya MA indicator by QuantLapse is an dynamic and unique trend-following tool that leverages Variable Index Dynamic Average (VIDYA) along with a statistical measure of standard deviation to assess trend strength, direction and volatility. By utilizing adaptive smoothing and volatility adjustment this indicator provides a more responsive and robust signal framework for traders.
______
Technical Composition, Calculation, Key Components & Features
📌 VIDYA (Variable Index Dynamic Average)
An adaptive moving average that automatically adjusts its sensitivity based on prevailing market volatility.
Employs a volatility-weighted smoothing constant derived from standard deviation ratios, allowing the average to respond faster during high-momentum phases and slow down during consolidation.
Reduces lag during trend expansion while suppressing noise in low-volatility environments.
Provides clearer trend structure and regime awareness compared to fixed-length moving averages.
Serves as a dynamic baseline for volatility envelopes and trend-state classification within the system.
📌 Volatility Adjustment – Standard Deviation
The system constructs a volatility-adaptive envelope around the VIDYA baseline using standard deviation, allowing band width to expand and contract dynamically with changing market conditions.
VIDYA’s smoothing factor is adjusted by comparing short-term and longer-term standard deviation, increasing responsiveness during volatility expansion and dampening noise during compression.
Upper and lower bands are calculated by applying a configurable standard deviation multiplier to the VIDYA value, creating a proportional volatility boundary rather than a fixed offset.
Price movement beyond these bands confirms volatility-supported momentum, while price contained within the bands signals consolidation or transitional phases.
📌 Trend Signal Calculation
A bullish trend state is triggered when price closes above the upper standard deviation band, indicating sustained upward momentum with volatility confirmation.
A bearish trend state is triggered when price closes below the lower band, confirming downside momentum under expanding volatility.
Once established, the trend state persists until an opposing volatility break occurs, reducing whipsaw and improving regime stability.
Trend direction is visually reinforced through dynamic color-coding of the VIDYA line and its envelope, providing immediate directional context at a glance.
______
How It Works in Trading
✅ Trend Strength Detection – Evaluates cumulative price movement over a defined window to assess directional conviction.
✅ Noise Reduction – Applies adaptive smoothing techniques to minimize whipsaws during choppy conditions.
✅ Dynamic Thresholding – Utilizes volatility-aware bands to define customizable trend continuation and invalidation levels.
✅ Color-Coded Visualization – Enhances chart readability by clearly distinguishing bullish, bearish, and neutral states.
______
Visual Representation
Trend Signals on Moving Average and Background Color:
🟢 Green/Teal Moving Average – Strong Uptrend
🔴 Red/Pink Candles – Strong Downtrend
✅ Long & Short Labels can be turned on or off for trade signal clarity.
📊 Display of entry & exit points based on entry and exit criteria's.
📊 Display of Indicators equity and buy and hold equity to compare performance.
______
Features and User Inputs
The Standard Deviation Vidya MA framework incorporates a flexible set of user-defined inputs designed to balance adaptability, clarity, and analytical control.
VIDYA Configuration – Customize the Variable Index Dynamic Average length and price source to control trend responsiveness based on volatility-adjusted smoothing.
Volatility & Deviation Controls – Adjust standard deviation lookback periods and multipliers to fine-tune adaptive upper and lower thresholds used for trend qualification.
Backtesting & Date Filters – Define a start date for historical evaluation and enable range filtering to analyze performance during specific market periods.
Display & Visualization Options – Toggle labels, equity curves, and visual overlays to tailor the chart presentation to personal trading preferences.
Color Customization – Fully configurable buy/sell colors for both trend signals and equity curves, allowing intuitive visual differentiation between bullish and bearish phases.
______
Practical Applications
The Standard Deviation VIDYA MA is designed for traders seeking an adaptive trend-following framework that dynamically responds to changing market volatility. By combining VIDYA’s volatility-sensitive smoothing with standard deviation–based thresholds, the indicator offers a robust approach to directional analysis across multiple market conditions.
Key applications include:
Adaptive Trend Identification – Detect sustained bullish and bearish trends using a volatility-adjusted moving average that automatically accelerates or slows based on market activity.
Volatility-Aware Entry & Exit Signals – Utilize standard deviation bands to define dynamic breakout and invalidation zones, helping reduce false signals during low-volatility consolidation phases.
Noise-Filtered Trend Participation – Avoid whipsaws by requiring price expansion beyond adaptive deviation thresholds before confirming trend direction.
Systematic Backtesting & Evaluation – Analyze historical trend performance using built-in equity curves and date filters to assess effectiveness across different market regimes.
Visual Trend Confirmation – Leverage color-coded VIDYA lines, deviation zones, and optional labels to clearly interpret trend state and momentum strength in real time.
This framework bridges volatility analysis with adaptive trend logic, providing a disciplined and data-driven method for trend participation while maintaining clarity and interpretability in live trading environments.
______
Conclusion
The Standard Deviation VIDYA MA by QuantLapse represents a modern evolution of adaptive trend analysis, blending volatility-weighted smoothing with statistically driven deviation thresholds. By integrating VIDYA’s responsiveness with standard deviation-based confirmation, the system delivers clearer trend structure, reduced noise, and more reliable directional context across varying market regimes.
This indicator is particularly well-suited for traders who value adaptability, clarity, and rule-based decision-making over static moving average techniques.
🔹 Who should use Standard Deviation VIDYA MA:
📊 Trend-Following Traders – Identify and stay aligned with sustained directional moves while avoiding premature reversals.
⚡ Momentum Traders – Capture volatility-supported expansions when price breaks beyond adaptive deviation bands.
🤖 Systematic & Algorithmic Traders – Ideal as a volatility-aware trend filter for rule-based entries, exits, and portfolio frameworks.
🔹 Disclaimer: Past performance does not guarantee future results. All trading involves risk, and no indicator or methodology can ensure profitability.
🔹 Strategic Advice: Always backtest thoroughly, optimize parameters responsibly, and align settings with your personal risk tolerance, timeframe, and market conditions before deploying the indicator in live trading.
