Greer EPS Yield📘 Script Title
Greer EPS Yield – Valuation Insight Based on Earnings Productivity
🧾 Description
Greer EPS Yield is a valuation-focused indicator from the Greer Financial Toolkit, designed to evaluate how efficiently a company generates earnings relative to its current stock price. This script calculates the Earnings Per Share Yield (EPS%), using the formula:
EPS Yield (%) = Earnings Per Share ÷ Stock Price × 100
This yield metric provides a quick snapshot of valuation through the lens of profitability per share. It dynamically highlights when the EPS yield is:
🟢 Above its historical average (potentially undervalued)
🔴 Below its historical average (potentially overvalued)
🔍 Use Case
Quickly assess valuation attractiveness based on earnings yield.
Identify potential buy opportunities when EPS% is above its long-term average.
Combine with other indicators in the Greer Financial Toolkit for a fundamentals-driven investment strategy:
📘 Greer Value – Tracks year-over-year growth consistency across six key metrics
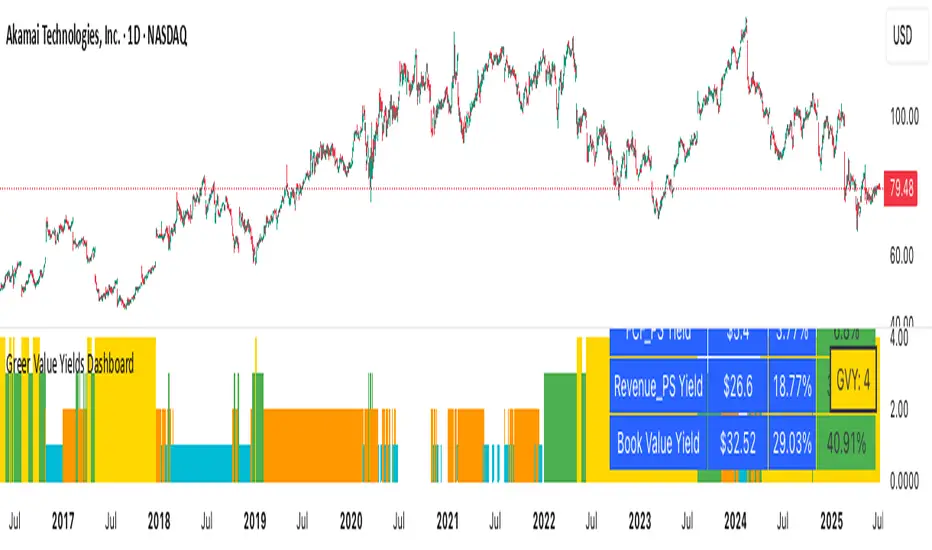
📊 Greer Value Yields Dashboard – Visualizes valuation-based yield metrics
🟢 Greer BuyZone – Highlights long-term technical buy zones
🛠️ Inputs & Data
Uses fiscal year EPS data from TradingView’s built-in financial database.
Tracks a static average EPS Yield to compare current valuation to historical norms.
Clean, intuitive visual with automatic color coding.
⚠️ Disclaimer
This tool is for educational and informational purposes only and should not be considered financial advice. Always conduct your own research before making investment decisions.
Indicador Pine Script®