Inside Candle DivergenceStudy Material: Inside Candle Divergence Indicator (aiTrendview)
1. Introduction
The Inside Candle Divergence Indicator is a custom tool built on TradingView using Pine Script. It is designed to help traders identify potential reversal points or trend continuations using a mix of candlestick analysis, RSI (Relative Strength Index), VWAP (Volume Weighted Average Price), Pivot Points, and Volume analytics. The tool also provides a dashboard table on the chart, summarizing all key values in a single glance for traders and analysts.
This indicator is not just a signal generator but also an educational framework—explaining how different concepts in technical analysis combine to build a systematic approach for market entries and exits.
________________________________________
2. Core Concepts Behind the Tool
A. Inside Candle Pattern
An Inside Candle forms when the current candle’s high is lower than or equal to the previous candle’s high, and the low is higher than or equal to the previous candle’s low.
• This means the entire price action of the current candle is "inside" the range of the previous candle.
• A bullish inside candle occurs when the close is higher than the open.
• A bearish inside candle occurs when the close is lower than the open.
This pattern shows market indecision but also sets up potential breakouts or trend reversals.
________________________________________
B. RSI (Relative Strength Index)
The indicator calculates RSI using the formula from the ta.rsi() function in TradingView. RSI helps measure momentum in the market.
• A low RSI (below 25) signals an oversold zone → possible buy.
• A high RSI (above 75) signals an overbought zone → possible sell.
By combining RSI with the Inside Candle, the indicator ensures that signals are triggered only when momentum and price patterns confirm each other.
________________________________________
C. Buy & Sell Signals
• Buy Signal: Triggered when RSI < Buy Level (default 25) and a bullish inside candle forms.
• Sell Signal: Triggered when RSI > Sell Level (default 75) and a bearish inside candle forms.
When triggered, the chart displays a BUY (green label below candle) or SELL (red label above candle) marker. The indicator also saves the entry price and signal bar for future reference inside the dashboard.
________________________________________
D. VWAP (Volume Weighted Average Price)
VWAP is calculated using the typical price (H+L+C)/3 and weighting it by volume.
• VWAP shows the average trading price weighted by volume, widely used by institutions.
• The tool calculates the distance of price from VWAP in % terms.
• If price is far above VWAP, the market may be overheated (overbought). If far below, it may be undervalued (oversold).
________________________________________
E. Volume Analysis
The tool splits volume into Buy Volume and Sell Volume:
• Buy Volume: If close > open.
• Sell Volume: If close ≤ open.
• Cumulative totals are maintained, and percentages are calculated to show what proportion of total market volume is bullish vs bearish.
• A progress bar style visual (using blocks █) shows the dominance of buyers or sellers.
This allows traders to quickly measure whether buyers or sellers are controlling the market trend.
________________________________________
F. Daily Pivot Points
Pivot Points are calculated using the previous day’s high, low, and close:
• Pivot = (High + Low + Close) / 3
• R1, S1, R2, S2, R3, S3 levels are derived from this pivot.
• These levels act as support and resistance zones.
The script plots Pivot, R1, and S1 lines on the chart for easy reference.
________________________________________
G. Trend Direction
The indicator checks where the price is compared to R1 and S1:
• If price > R1 → Bullish Trend
• If price < S1 → Bearish Trend
• Otherwise → Neutral Trend
The trend direction is displayed in the dashboard with arrows (↑, ↓, →).
________________________________________
H. Price Change Calculation
The tool calculates:
• Price Change = Current Close – Previous Close
• Percentage Change = (Change / Previous Close) × 100
• Displays ▲ (green upward) or ▼ (red downward) with the exact percentage.
This gives traders a quick snapshot of intraday price movement.
________________________________________
I. Dashboard Table
One of the most powerful features is the real-time dashboard table shown on the chart. It contains:
1. Symbol & Price Info (Current ticker, price, change %)
2. RSI Reading (with color coding: green for oversold, red for overbought)
3. VWAP and Distance from VWAP
4. Volume Analysis with Progress Bar (Buy vs Sell %)
5. Pivot Levels (Pivot, R1, S1)
6. Trend Direction (Bullish, Bearish, Neutral)
7. Signal Status (Last Buy/Sell signal with entry price)
This reduces the need for multiple indicators and gives traders a command-center view directly on the chart.
________________________________________
J. Alerts
The tool generates alerts whenever a Buy or Sell condition is met. Traders can set up TradingView alerts to be notified instantly when:
• Buy Signal Alert → RSI oversold + Bullish inside candle
• Sell Signal Alert → RSI overbought + Bearish inside candle
This ensures no opportunity is missed even if you’re not actively monitoring the chart.
________________________________________
K. Background Highlights
The chart background also changes faintly (light green or light red) when a Buy or Sell condition is triggered. This gives traders visual confirmation along with signals and alerts.
________________________________________
3. Practical Use of This Tool
• Scalpers & Intraday Traders can use it for quick momentum-based entries.
• Swing Traders can use the RSI + Inside Candle + Pivot Points to find medium-term reversals.
• Analysts can use the dashboard for real-time summaries in reports.
• Volume Analysis helps understand institutional activity.
Remember: This is not a standalone holy grail. It must be used with proper risk management and confirmation from higher timeframes.
________________________________________
4. Strict Disclaimer (aiTrendview)
⚠️ Disclaimer from aiTrendview:
This indicator is designed for educational and analytical purposes only. It is not financial advice or a guaranteed trading strategy. Markets are inherently risky and unpredictable; past performance of indicators does not ensure future results. Trading involves risk of financial loss, and traders must use proper risk management, stop-loss, and independent judgment.
aiTrendview strictly follows TradingView.com rules and compliance guidelines.
Any misuse of this tool, its code, or analytical features for unauthorized commercial purposes, false promises, or misleading activities is strictly discouraged. The creators of this script and aiTrendview will not be responsible for any losses, damages, or misuse arising from its application. Always trade responsibly and only with money you can afford to lose.
________________________________________
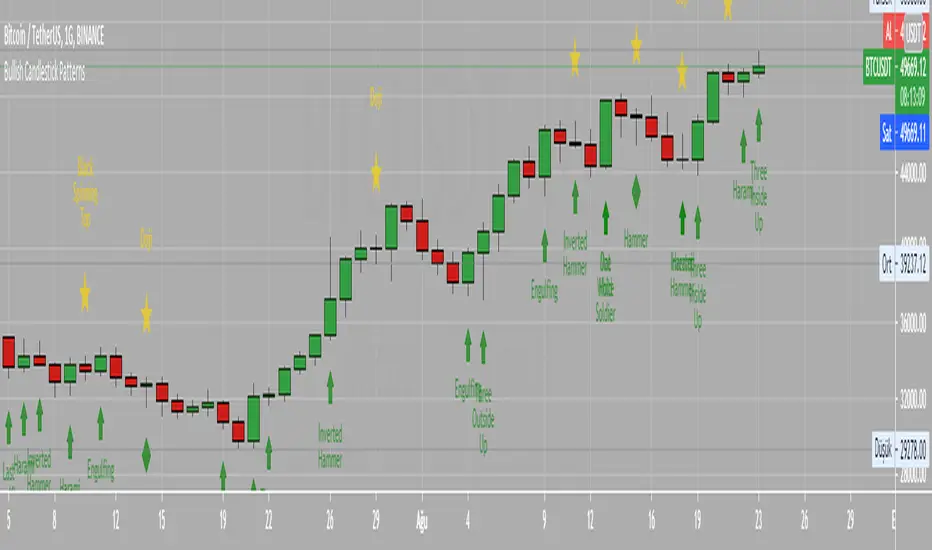
Bullishcandlestick

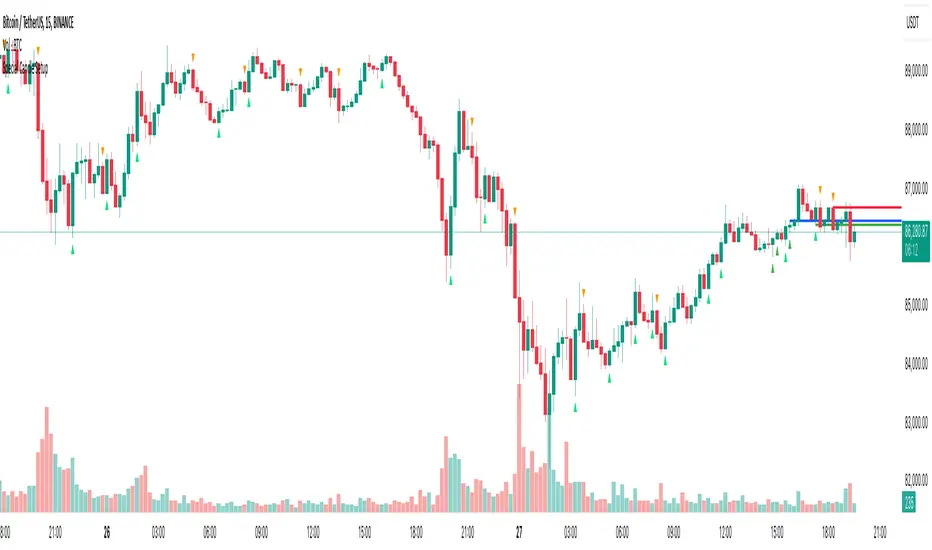
Special Candle SetupThe Special Candle Setup Indicator is designed to detect significant bearish and bullish candlestick patterns , helping traders identify potential trend shifts and key price action setups . This indicator recognizes 8 bearish patterns and 6 bullish patterns , derived from multi-candlestick formations observed across different markets, including crypto, indices, forex, and stocks.
How It Works
This indicator scans the market for specific candlestick structures that indicate potential reversals or trend continuations . It includes:
• Bearish Patterns (8 types) : Identifies candlestick structures that suggest potential downside movement.
• Bullish Patterns (6 types) : Detects formations indicating upward momentum.
• Reversal Signals : Additional patterns that highlight key turning points in price action.
• Key Level Marking : Automatically draws support and resistance levels based on detected setups.
• Expiry Signals (Optional) : Highlights patterns commonly seen on expiry days in the Indian market, but these patterns are universally applicable to other asset classes as well.
Key Features
✔ Comprehensive Candlestick Pattern Recognition – Detects 14 key bullish and bearish formations.
✔ Reversal & Trend Continuation Setups – Helps identify both potential reversals and momentum-based entries.
✔ Automated Key Level Marking – Plots dynamic blue lines for key support and resistance zones.
✔ Customizable Pattern Selection – Allows users to enable/disable specific pattern types.
✔ Non-Repainting Signals – Ensures stability by maintaining signal integrity over time.
Customization Options
• Enable/Disable Specific Patterns – Users can disable main patterns or reversal patterns based on their preference, allowing them to focus on a single type of setup if needed.
• Key Level Customization – The blue lines represent critical price levels, drawn automatically based on identified patterns. These act as reference points for potential breakouts or reversals.
• Optional Expiry Signals – Includes patterns commonly observed on expiry days, primarily for the Indian market, but they also appear in global markets like crypto, forex, and indices.
How to Use
• Trend Trading – Use bullish and bearish patterns to identify entry points within an existing trend.
• Reversal Trading – Focus on reversal signals near key levels for potential market turnarounds.
• Key Level Validation – Utilize the blue lines to confirm important price zones.
• Customization – Tailor the indicator to your strategy by selecting only the patterns that align with your trading style.
Why This Combination?
This indicator blends multiple candlestick formations, ensuring a well-rounded approach to market analysis. The integration of expiry signals, reversal structures, and key level plotting makes it adaptable for various asset classes, not just expiry-based trading.
Why It’s Worth Using?
Manually spotting multiple candlestick setups can be time-consuming and subjective. This indicator automates the process, providing structured insights into market movements with clearly defined signals and key level plotting, making it valuable for traders across different markets.
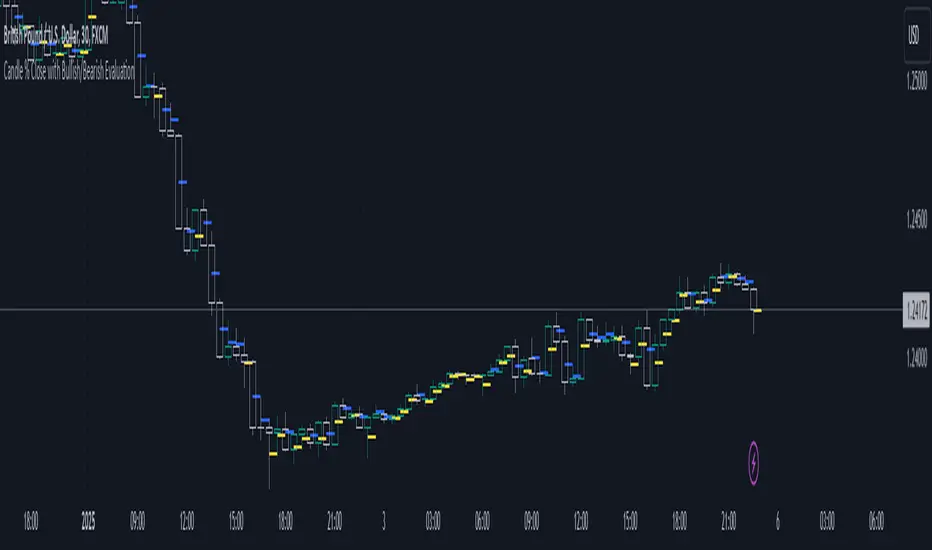
Candle % Close with Bullish/Bearish EvaluationI created the indicator to more quickly define the polarity of candles. For a large number of candles, it is straightforward to determine whether a candle is bullish or bearish. However, candles with long wicks often appear, making it uncertain whether the candle is bullish or bearish from a price action perspective. It is not a rule that a red candle is bearish and a green candle is bullish.
From a more advanced price action standpoint, how these candles close is important. Therefore, I created the 'Percent range' input. By default, it is set to 50% (high-low)/2. This way, the indicator precisely determines 50% of the candle's entire range. This allows us to determine whether a bearish candle truly closed below 50% of its range. If not, such a candle is considered bullish, even if it is a negative candle. The same applies to bullish candles, but conversely. If a positive candle closes below 50% of its range, from a price action perspective, it is considered a bearish candle.
Since in price action it is common for the price to return to 50% of the previous candle and, after filling, to continue in the established trend, I added the line extension option. Whatever high value you enter, the line extension follows the current candle. This option works only when the stop line checkbox is enabled. This way, you can plot 50% of the candle's range that the market has historically not returned to due to a strong trend. Often, this line is plotted on a candle where there is also an FVG, which can help you more easily find a point of interest.
Stop line extension : Ensures the interruption of line plotting when the candle is touched by the body or wick.
Bullish Candlestick Patterns With Filters [TradeDots]The "Bullish Candlestick Patterns With Filters" is a trading indicator that identifies 6 core bullish candlestick patterns. This is further enhanced by applying channel indicator as filters, designed to further increase the accuracy of the recognized patterns.
6 CANDLESTICK PATTERNS
Hammer
Inverted Hammer
Bullish Engulfing
The Piercing Line
The Morning Star
The 3 White Soldiers
SIGNAL FILTERING
The indicator incorporates with 2 primary methodologies aimed at filtering out lower accuracy signals.
Firstly, it comes with a "Lowest period" parameter that examines whether the trough of the bullish candlestick configuration signifies the lowest point within a specified retrospective bar length. The longer the period, the higher the probability that the price will rebound.
Secondly, the channel indicators, the Keltner Channels or Bollinger Bands. This indicator examines whether the lowest point of the bullish candlestick pattern breaches the lower band, indicating an oversold signal. Users have the flexibility to modify the length and band multiplier, enabling them to custom-tune signal sensitivity.
Without Filtering:
With Filtering
RISK DISCLAIMER
Trading entails substantial risk, and most day traders incur losses. All content, tools, scripts, articles, and education provided by TradeDots serve purely informational and educational purposes. Past performances are not definitive predictors of future results.

Bullish Candlestick PatternsBullish Abandone Baby
Bullish Above The Stomach
Bullish Belt Hold
Bullish Breakaway
Bullish Concealing Baby Swallow
Bullish Counterattack Lines
Bullish Deliberation Block
Bullish Descent Block
Bullish Doji Star
Bullish Downside Gap Two Rabbits
Bullish Dragonfly Doji
Bullish Engulfing
Bullish Hammer
Bullish Harami
Bullish Harami Cross
Bullish High Price Gapping Play
Bullish Homing Pigeon
Bullish Hook Reversal
Bullish Inverted Hammer
Bullish Island Reversal
Bullish Kicking
Bullish Ladder Bottom
Bullish Last Engulfing Bottom
Bullish Mat Hold
Bullish Matching Low
Bullish Meeting Line
Bullish Morning Doji Star
Bullish Morning Star
Bullish On Neck
Bullish One White Soldier
Bullish Piercing Line
Bullish Rising Three Methods
Bullish Rising Window
Bullish Separating Lines
Bullish Side by Side White Lines
Bullish Stick Sandwich
Bullish Takuri Line
Bullish Three Gap Downs
Bullish Three Inside Up
Bullish Three Line Strike
Bullish Three Outside Up
Bullish Three Stars in the South
Bullish Three White Soldiers
Bullish Thrusting Line During Uptrend
Bullish Tower Bottom
Bullish Tristar
Bullish Tweezers Bottom
Bullish Two Rabbits
Bullish Unique Three River Bottom
Bullish Upside Gap Three Methods
Bullish Upside Tasuki Gap