Dizzy HOLO🚀 Dizzy HOLO is an all-in-one professional trading suite designed for serious traders.
It combines Pivot Points, Opening Range Breakout (ORB), HOLO (High of Low / Low of High), Weekly Levels, SMA Thresholds, and Real-Time Alerts into a single lightweight indicator.
🔑 Key Features:
✅ Pivot Points (Fibonacci & Camarilla) – Automatic support & resistance with labels.
✅ Opening Range Breakout (ORB) – Custom session ORB with historical data and breakout alerts.
✅ HOLO Strategy – Daily High/Low, Highest H1 Open, Lowest H1 Close with dynamic buy/sell zones.
✅ Weekly Levels – Previous Week High/Low/Open/Close with extended dotted projections.
✅ SMA Threshold Zones – Dynamic SMA with gray zone filter and trend-based candle coloring.
✅ Multi-Timeframe Analysis – Auto-switching pivots & real-time confirmation.
✅ Smart Alerts – Pivot breakouts, ORB levels, HOLO crosses, and Weekly breaks.
🎯 Why Use Dizzy HOLO?
This indicator is built for breakout, reversal, and trend traders. It provides clear market structure, liquidity zones, and actionable alerts so you never miss important setups.
🛠️ Best Suited For:
Intraday scalpers
Swing traders
Breakout traders
HOLO strategy followers
Multi-timeframe traders
Indicadores de Banda

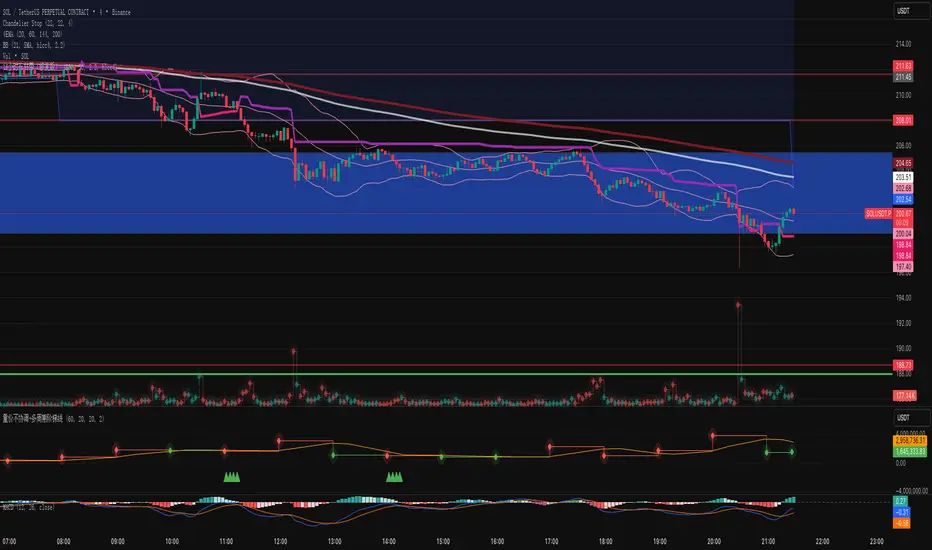
Long-short energy ratio /多空能量比值This indicator calculates the relative strength of bulls and bears by measuring the average candle body movement within a user-defined window (default: 50 bars).
Bull Energy = average percentage change of all bullish candles in the lookback period
Bear Energy = average percentage change of all bearish candles in the lookback period
Energy Ratio = Bull Energy ÷ Bear Energy
The ratio is plotted as a curve around the baseline of 1:
Ratio > 1 → Bull side shows stronger momentum
Ratio < 1 → Bear side shows stronger momentum
Ratio ≈ 1 → Balanced market conditions
This tool helps visualize short-term shifts in buying and selling pressure, offering a simple mean-reversion perspective or a confirmation of trend strength depending on the context.


EMA & HMA with ShadingA simple indicator you can use to shade the area between an EMA and HMA for easier visualization. Hope you find it useful in your trading.


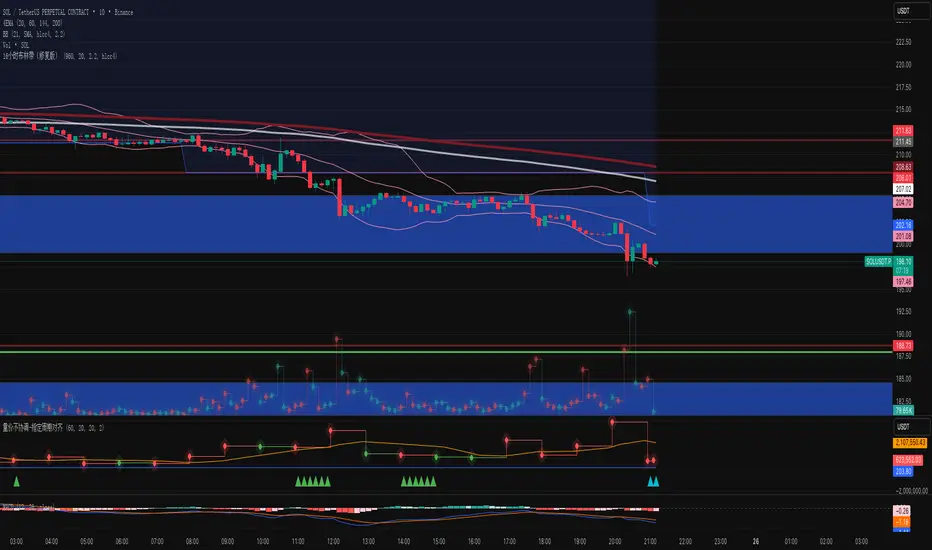
Volume-Price Divergence Indicator V3Description:
This indicator helps you identify volume-price divergences and potential trend weakness across any specified timeframe.
Features:
Volume bars with moving average – green for bullish, red for bearish, with orange SMA to detect low-volume situations.
Custom OBV calculation with divergence detection – highlights when price makes new highs/lows but OBV does not.
VWAP deviation alerts – signals when price moves far from VWAP while volume remains low, indicating potential fake breakouts.
Fully configurable – select any reference timeframe, adjust volume MA, OBV period, and VWAP deviation threshold.
Visual markers – easily spot bullish/bearish divergences and volume-price mismatches directly on your chart.
Use case:
Spot early trend exhaustion points.
Identify fake breakouts or weak rallies/drops.
Combine with your existing trading strategy for more informed entries and exits.
Volume-Price Divergence Indicator V2Description:
This indicator helps you identify volume-price divergences and potential trend weakness across any specified timeframe.
Features:
Volume bars with moving average – green for bullish, red for bearish, with orange SMA to detect low-volume situations.
Custom OBV calculation with divergence detection – highlights when price makes new highs/lows but OBV does not.
VWAP deviation alerts – signals when price moves far from VWAP while volume remains low, indicating potential fake breakouts.
Fully configurable – select any reference timeframe, adjust volume MA, OBV period, and VWAP deviation threshold.
Visual markers – easily spot bullish/bearish divergences and volume-price mismatches directly on your chart.
Use case:
Spot early trend exhaustion points.
Identify fake breakouts or weak rallies/drops.
Combine with your existing trading strategy for more informed entries and exits.
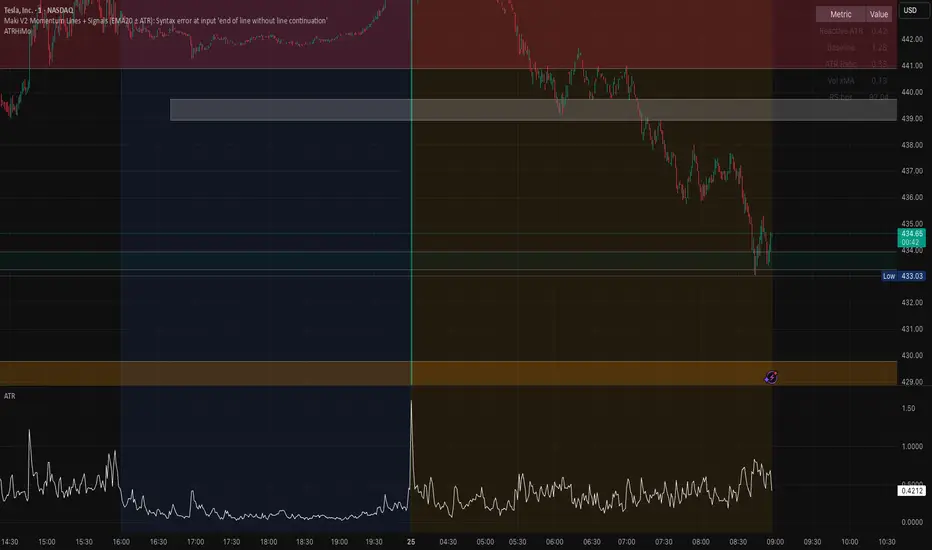
Opening ATR + High Momentum (10/30/60)this is a custom momentum indicator using atr
A fixed, compiling Pine v5 script is below with the three issues corrected: no plots in local scope, a ≤10-character shorttitle, and cleaned ternaries/formatting that remove the “end of line without line continuation” error.
MACD COM PONTOS//@version=5
indicator(title="MACD COM PONTOS", shorttitle="MACD COM PONTOS")
//Plot Inputs
res = input.timeframe("", "Indicator TimeFrame")
fast_length = input.int(title="Fast Length", defval=12)
slow_length = input.int(title="Slow Length", defval=26)
src = input.source(title="Source", defval=close)
signal_length = input.int(title="Signal Smoothing", minval = 1, maxval = 999, defval = 9)
sma_source = input.string(title="Oscillator MA Type", defval="EMA", options= )
sma_signal = input.string(title="Signal Line MA Type", defval="EMA", options= )
// Show Plots T/F
show_macd = input.bool(true, title="Show MACD Lines", group="Show Plots?", inline="SP10")
show_macd_LW = input.int(3, minval=0, maxval=5, title = "MACD Width", group="Show Plots?", inline="SP11")
show_signal_LW= input.int(2, minval=0, maxval=5, title = "Signal Width", group="Show Plots?", inline="SP11")
show_Hist = input.bool(true, title="Show Histogram", group="Show Plots?", inline="SP20")
show_hist_LW = input.int(5, minval=0, maxval=5, title = "-- Width", group="Show Plots?", inline="SP20")
show_trend = input.bool(true, title = "Show MACD Lines w/ Trend Color", group="Show Plots?", inline="SP30")
show_HB = input.bool(false, title="Show Highlight Price Bars", group="Show Plots?", inline="SP40")
show_cross = input.bool(false, title = "Show BackGround on Cross", group="Show Plots?", inline="SP50")
show_dots = input.bool(true, title = "Show Circle on Cross", group="Show Plots?", inline="SP60")
show_dots_LW = input.int(5, minval=0, maxval=5, title = "-- Width", group="Show Plots?", inline="SP60")
//show_trend = input(true, title = "Colors MACD Lines w/ Trend Color", group="Show Plots?", inline="SP5")
// MACD Lines colors
col_macd = input.color(#FF6D00, "MACD Line ", group="Color Settings", inline="CS1")
col_signal = input.color(#2962FF, "Signal Line ", group="Color Settings", inline="CS1")
col_trnd_Up = input.color(#4BAF4F, "Trend Up ", group="Color Settings", inline="CS2")
col_trnd_Dn = input.color(#B71D1C, "Trend Down ", group="Color Settings", inline="CS2")
// Histogram Colors
col_grow_above = input.color(#26A69A, "Above Grow", group="Histogram Colors", inline="Hist10")
col_fall_above = input.color(#B2DFDB, "Fall", group="Histogram Colors", inline="Hist10")
col_grow_below = input.color(#FF5252, "Below Grow", group="Histogram Colors",inline="Hist20")
col_fall_below = input.color(#FFCDD2, "Fall", group="Histogram Colors", inline="Hist20")
// Alerts T/F Inputs
alert_Long = input.bool(true, title = "MACD Cross Up", group = "Alerts", inline="Alert10")
alert_Short = input.bool(true, title = "MACD Cross Dn", group = "Alerts", inline="Alert10")
alert_Long_A = input.bool(false, title = "MACD Cross Up & > 0", group = "Alerts", inline="Alert20")
alert_Short_B = input.bool(false, title = "MACD Cross Dn & < 0", group = "Alerts", inline="Alert20")
// Calculating
fast_ma = request.security(syminfo.tickerid, res, sma_source == "SMA" ? ta.sma(src, fast_length) : ta.ema(src, fast_length))
slow_ma = request.security(syminfo.tickerid, res, sma_source == "SMA" ? ta.sma(src, slow_length) : ta.ema(src, slow_length))
macd = fast_ma - slow_ma
signal = request.security(syminfo.tickerid, res, sma_signal == "SMA" ? ta.sma(macd, signal_length) : ta.ema(macd, signal_length))
hist = macd - signal
// MACD Trend and Cross Up/Down conditions
trend_up = macd > signal
trend_dn = macd < signal
cross_UP = signal >= macd and signal < macd
cross_DN = signal <= macd and signal > macd
cross_UP_A = (signal >= macd and signal < macd) and macd > 0
cross_DN_B = (signal <= macd and signal > macd) and macd < 0
// Condition that changes Color of MACD Line if Show Trend is turned on..
trend_col = show_trend and trend_up ? col_trnd_Up : trend_up ? col_macd : show_trend and trend_dn ? col_trnd_Dn: trend_dn ? col_macd : na
//Var Statements for Histogram Color Change
var bool histA_IsUp = false
var bool histA_IsDown = false
var bool histB_IsDown = false
var bool histB_IsUp = false
histA_IsUp := hist == hist ? histA_IsUp : hist > hist and hist > 0
histA_IsDown := hist == hist ? histA_IsDown : hist < hist and hist > 0
histB_IsDown := hist == hist ? histB_IsDown : hist < hist and hist <= 0
histB_IsUp := hist == hist ? histB_IsUp : hist > hist and hist <= 0
hist_col = histA_IsUp ? col_grow_above : histA_IsDown ? col_fall_above : histB_IsDown ? col_grow_below : histB_IsUp ? col_fall_below :color.silver
// Plot Statements
//Background Color
bgcolor(show_cross and cross_UP ? col_trnd_Up : na, editable=false)
bgcolor(show_cross and cross_DN ? col_trnd_Dn : na, editable=false)
//Highlight Price Bars
barcolor(show_HB and trend_up ? col_trnd_Up : na, title="Trend Up", offset = 0, editable=false)
barcolor(show_HB and trend_dn ? col_trnd_Dn : na, title="Trend Dn", offset = 0, editable=false)
//Regular Plots
plot(show_Hist and hist ? hist : na, title="Histogram", style=plot.style_columns, color=color.new(hist_col ,0),linewidth=show_hist_LW)
plot(show_macd and signal ? signal : na, title="Signal", color=color.new(col_signal, 0), style=plot.style_line ,linewidth=show_signal_LW)
plot(show_macd and macd ? macd : na, title="MACD", color=color.new(trend_col, 0), style=plot.style_line ,linewidth=show_macd_LW)
hline(0, title="0 Line", color=color.new(color.gray, 0), linestyle=hline.style_dashed, linewidth=1, editable=false)
plot(show_dots and cross_UP ? macd : na, title="Dots", color=color.new(trend_col ,0), style=plot.style_circles, linewidth=show_dots_LW, editable=false)
plot(show_dots and cross_DN ? macd : na, title="Dots", color=color.new(trend_col ,0), style=plot.style_circles, linewidth=show_dots_LW, editable=false)
//Alerts
if alert_Long and cross_UP
alert("Symbol = (" + syminfo.tickerid + ") TimeFrame = (" + timeframe.period + ") Current Price (" + str.tostring(close) + ") MACD Crosses Up.", alert.freq_once_per_bar_close)
if alert_Short and cross_DN
alert("Symbol = (" + syminfo.tickerid + ") TimeFrame = (" + timeframe.period + ") Current Price (" + str.tostring(close) + ") MACD Crosses Down.", alert.freq_once_per_bar_close)
//Alerts - Stricter Condition - Only Alerts When MACD Crosses UP & MACD > 0 -- Crosses Down & MACD < 0
if alert_Long_A and cross_UP_A
alert("Symbol = (" + syminfo.tickerid + ") TimeFrame = (" + timeframe.period + ") Current Price (" + str.tostring(close) + ") MACD > 0 And Crosses Up.", alert.freq_once_per_bar_close)
if alert_Short_B and cross_DN_B
alert("Symbol = (" + syminfo.tickerid + ") TimeFrame = (" + timeframe.period + ") Current Price (" + str.tostring(close) + ") MACD < 0 And Crosses Down.", alert.freq_once_per_bar_close)
//End Code

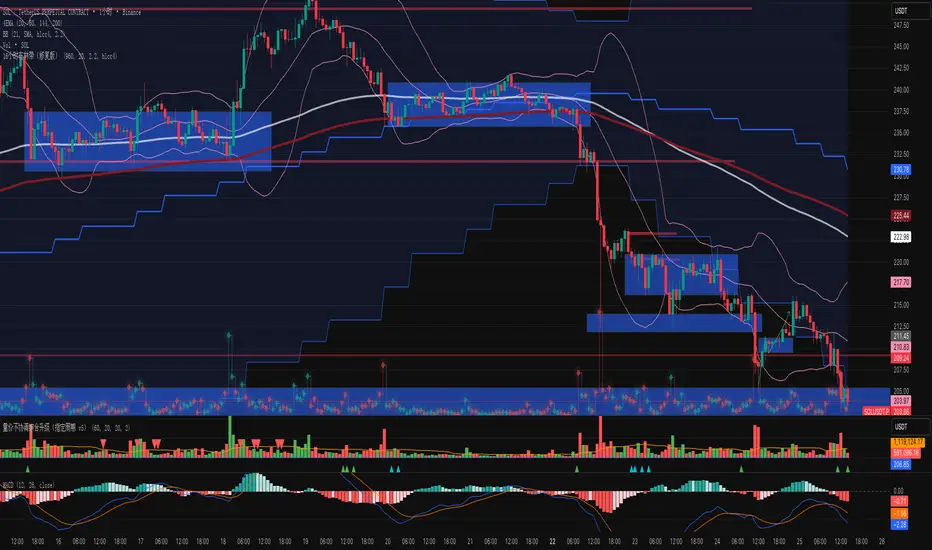
Initial Balance SMC-V3
Initial Balance SMC-V3 – An Advanced Mean Reversion Indicator for Index Markets
The Initial Balance SMC-V3 indicator is the result of continuous refinement in mean reversion trading, with a specific focus on index markets (such as DAX, NASDAQ, S&P 500, etc.). Designed for high-liquidity environments with controlled volatility, it excels at precisely identifying value zones and statistical reversal points within market structure.
🔁 Mean Reversion at Its Core
At the heart of this indicator lies a robust mean reversion logic: rather than chasing extreme breakouts, it seeks returns toward equilibrium levels after impulsive moves. This makes it especially effective in ranging markets or corrective phases within broader trends—situations where many traders get caught in false breakouts.
🎯 Signals Require Breakout + Confirmation
Signals are never generated impulsively. Instead, they require a clear sequence of confirmations:
Break of a key level (e.g., Initial Balance high/low or an SMC zone);
Price re-entry into the range accompanied by a crossover of customizable moving averages (SMA, EMA, HULL, TEMA, etc.);
RSI filter to avoid entries in overbought/oversold extremes;
Volatility filter (ATR) to skip low-volatility, choppy conditions.
This multi-layered approach drastically reduces false signals and significantly improves trade quality.
📊 Built-in Multi-Timeframe Analysis
The indicator features native multi-timeframe logic:
H1 / 15-minute charts: for structural analysis and identification of Supply & Demand zones (SMC);
M1 / M5 charts: for precise trade execution, with targeted entries and dynamic risk management.
SMC zones are calculated on higher timeframes (e.g., 4H) to ensure structural reliability, while actual trade signals trigger on lower timeframes for maximum precision.
⚙️ Advanced Customization
Full choice of moving average type (SMA, EMA, WMA, RMA, VWMA, HULL, TEMA, ZLEMA, etc.);
Revenge Trading logic: after a stop loss is hit without reaching the 1:1 breakeven level, the indicator automatically prepares for a counter-trade;
Dynamic ATR-based stop loss with customizable multiplier;
Session filters to trade only during optimal liquidity windows (e.g., European session).
🧠 Who Is It For?
This indicator is ideal for traders who:
Primarily trade indices;
Prefer mean reversion strategies over pure trend-following;
Seek a disciplined, rule-based system with multiple confluence filters;
Use a multi-timeframe approach to separate analysis from execution.
In short: Initial Balance SMC-V3 is more than just an indicator—it’s a complete trading framework for mean reversion on index markets, where every signal emerges from a confluence of statistical, structural, and temporal factors.
Happy trading! 📈

Volume-Price Divergence Indicator (OBV + VWAP, Multi-Timeframe)Description:
This indicator helps you identify volume-price divergences and potential trend weakness across any specified timeframe.
Features:
Volume bars with moving average – green for bullish, red for bearish, with orange SMA to detect low-volume situations.
Custom OBV calculation with divergence detection – highlights when price makes new highs/lows but OBV does not.
VWAP deviation alerts – signals when price moves far from VWAP while volume remains low, indicating potential fake breakouts.
Fully configurable – select any reference timeframe, adjust volume MA, OBV period, and VWAP deviation threshold.
Visual markers – easily spot bullish/bearish divergences and volume-price mismatches directly on your chart.
Use case:
Spot early trend exhaustion points.
Identify fake breakouts or weak rallies/drops.
Combine with your existing trading strategy for more informed entries and exits.
Volume (Custom Timeframe & Color)This indicator displays volume data from a custom timeframe, regardless of the current chart resolution.
The bar color is determined by the price movement of the selected timeframe (green for bullish, red for bearish).
Features:
- Select any custom timeframe for volume (e.g., 5m, 15m, 1h, 1D).
- Volume bars are painted according to the candle direction of that timeframe.
- Useful for multi-timeframe analysis and detecting higher timeframe volume trends.
Inspired by TradingView’s built-in Volume indicator, but enhanced with custom timeframe and consistent coloring.

Stiffness IndexStiffness Index Indicator
Overview
The Stiffness Index is a technical analysis indicator created by Markos Katsanos and first introduced in the November 2018 issue of Technical Analysis of Stocks & Commodities magazine. This indicator attempts to recognize strong price trends by counting the number of times price was above the 100-day moving average during the indicator period.
Core Philosophy
The premise is the fewer number of times price penetrates the MA, the stronger the trend. The philosophy behind this indicator is that traders should trade when the trend is at its strongest point - when the trend is at its "stiffest". Based on the observation that in strong long-lasting uptrends, price seldom penetrates the 100-bar simple moving average, this indicator helps assess the quality and strength of an uptrend.
How It Works
The Stiffness Index operates through several key components:
1. Moving Average Baseline: Uses a 100-period moving average as the primary reference level
2. Volatility Threshold: Includes a volatility threshold to eliminate minor movements - typically 0.2 standard deviations to reject minimal penetrations above the moving average
3. Counting Mechanism: Calculates the stiffness coefficient as the ratio of the number of times the price has closed above the moving average during the indicator period to the length of that period
4. Smoothing: Applies additional smoothing to the final result for cleaner signals
Key Components
Input Parameters
- Period 1 (100): The moving average period for the baseline calculation
- MA Method 1: Type of moving average for the baseline (SMA, EMA, SMMA, LWMA)
- Summation Period (60): The lookback period for counting closes above the moving average
- Period 2 (3): Smoothing period for the final signal line
- MA Method 2: Smoothing method for the signal line
- Threshold Level (80): Reference level for identifying strong trends
Visual Elements
- Blue Signal Line: The main stiffness reading showing trend strength
- Dotted Line: Adjustable threshold level for reference
Interpretation and Trading Applications
Signal Readings
- High Values (Above Threshold): Indicates a "stiff" trend where price consistently stays above the moving average with minimal penetrations
- Low Values (Below Threshold): Suggests a weaker trend with frequent penetrations of the moving average
- Original threshold levels mentioned in research range from 75-95
Trading Strategy
The original strategy suggests entering long positions when the stiffness reading reaches 90 or higher, with exits when the reading drops below 50. Some implementations use a threshold of 75 for entry confirmation.
Key Characteristics
- Designed primarily for stocks and instruments with upward bias
- Trades infrequently - typically about once per year when using strict parameters
- Best suited for trend-following strategies in strongly trending markets
Advantages
- Trend Quality Assessment: Quantifies the "stiffness" or quality of trends
- Volatility Filtering: Built-in volatility threshold reduces false signals from minor price movements
- Objective Measurement: Provides a numerical assessment of trend strength
- Customizable: Multiple parameters allow adaptation to different markets and timeframes
Best Practices
- Use in conjunction with baseline trend indicators for confirmation
- Most effective in markets with strong directional bias
- Consider the low frequency of signals when developing trading strategies
- May not be suitable for instruments that "twitch up and down" frequently
*Note: This indicator is specifically designed to identify and trade the strongest trending periods, which naturally results in fewer but potentially higher-quality trading opportunities.*

Multi Momentum 10/21/42/63 — Histogram + 2xSMAMY MM INDICATOR INDIRED BY KARADI
It averages four rate-of-change snapshots of price, all anchored at today’s close.
If “Show as %” is on, the value is multiplied by 100.
Each term is a simple momentum/ROC over a different lookback.
Combining 10, 21, 42, 63 bars blends short, medium, and intermediate horizons into one number.
Positive MM → average upward pressure across those horizons; negative MM → average downward pressure.
Why those lengths?
They roughly stack into ~2× progression (10→21≈2×10, 21→42=2×21, 63≈1.5×42). That creates a “multi-scale” momentum that’s less noisy than a single fast ROC but more responsive than a long ROC alone.
How to read the panel
Gray histogram = raw Multi-Momentum value each bar.
SMA Fast/Slow lines (defaults 12 & 26 over the MM values) = smoothing of the histogram to show the trend of momentum itself.
Typical signals
Zero-line context:
Above 0 → bullish momentum regime on average.
Below 0 → bearish regime.
Crosses of SMA Fast & Slow: momentum trend shifts (fast above slow = improving momentum; fast below slow = deteriorating).
Histogram vs SMA lines: widening distance suggests strengthening momentum; narrowing suggests momentum is fading.
Divergences: price makes a new high/low but MM doesn’t → potential exhaustion.
Compared to a classic ROC
A single ROC(20) is very sensitive to that one window.
MM averages several windows, smoothing idiosyncrasies (e.g., a one-off spike 21 bars ago) and reducing “lookback luck.”
Settings & customization
Lookbacks (10/21/42/63): you can tweak for your asset/timeframe; the idea is to mix short→medium horizons.
Percent vs raw ratio: percent is easier to compare across symbols.
SMA lengths: shorter = more reactive but choppier; longer = smoother but slower.
Practical tips
Use regime + signal: trade longs primarily when MM>0 and fast SMA>slow SMA; consider shorts when MM<0 and fast

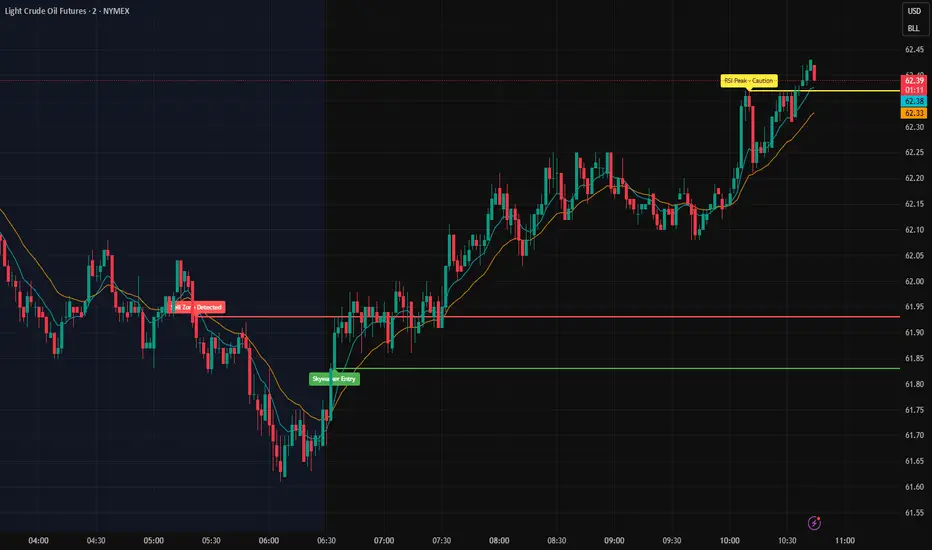
Skywalker Strong Signals The Skywalker Scanner is a technical analysis tool designed to help traders evaluate market conditions by combining multiple signals into a single system.
Key Features:
EMA Trend Tracking – Fast and slow EMAs visually highlight bullish and bearish market zones.
RSI Alerts – Provides warnings when RSI reaches overbought or oversold levels to help identify potential momentum shifts.
Volume Filter – Signals are confirmed only when volume exceeds a moving average threshold.
Buy & Sell Conditions – Alerts trigger when EMA crossovers align with RSI thresholds, MACD momentum, and candle confirmation.
How It Works:
Instead of relying on a single indicator, the Skywalker Scanner filters setups so that buy or sell signals only appear when multiple conditions agree. This aims to reduce false positives and provide traders with clearer potential trade opportunities.
Usage:
Suitable across multiple timeframes, from scalping to swing trading.
Can be used standalone or as a confirmation tool alongside other strategies.
Does not guarantee results; intended for educational purposes only.
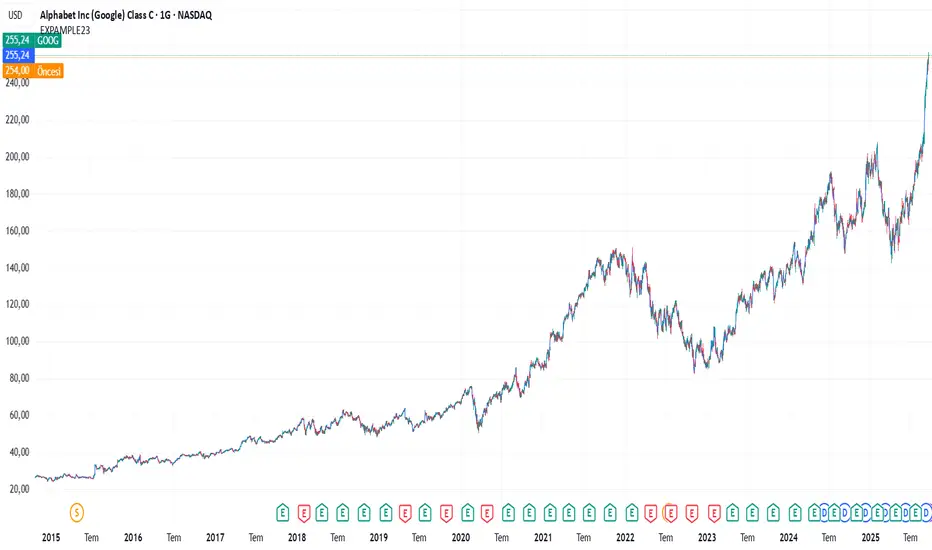
Financial Success Indicator Financial Success Indicator (Guiding with Fundamental Analysis from Macro to Micro)

Finansal Başarı Göstergesi Finansal Başarı Göstergesi (Makro'dan Mikro'ya Temel Analizlerle Yol Gösterici)
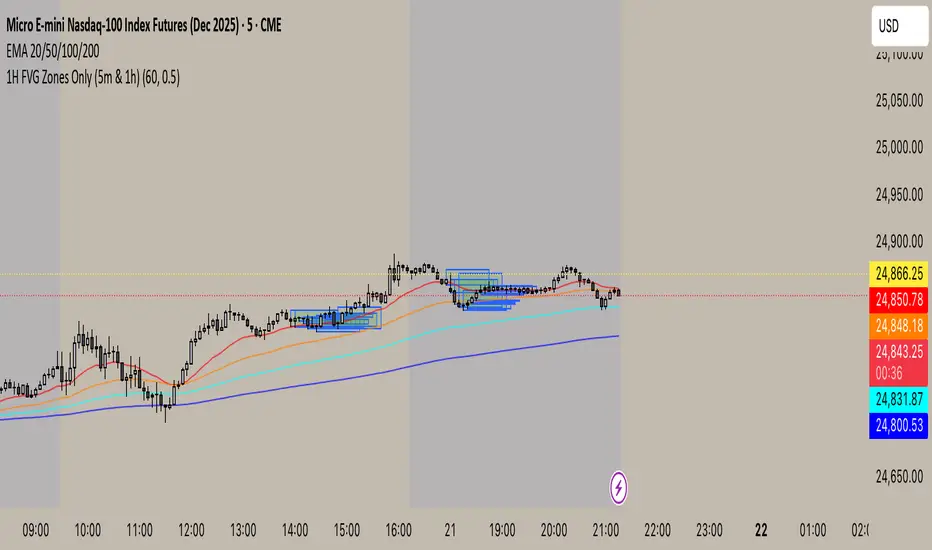
1H FVG Zones Only (5m & 1h)new uses trend anaylosis. takes 15 min chart and breaks into 1hr chart fvg gaps

KA Intradia 2025This indicator plots horizontal levels based on the Daily Open price, providing intraday reference zones for traders.
Each line extends from the day’s open across the chart, and every level is labeled precisely at the right side of the chart for easy visibility—without overlapping the price scale.
The extension length, label positioning, colors, and percentage levels are fully customizable, ensuring the levels remain consistent across all timeframes.


Phato Candle ProjectionsPhato Candle ProjectionsPhato Candle ProjectionsPhato Candle ProjectionsPhato Candle ProjectionsPhato Candle ProjectionsPhato Candle ProjectionsPhato Candle ProjectionsPhato Candle ProjectionsPhato Candle Projections

Relative Sector Index Benchmarking by QuantxQuantX Relative Strength helps traders identify whether a stock is outperforming or underperforming NIFTY. It uses a clean histogram with background highlights and a trend line to spot market leaders, laggards, and strength reversals quickly.
