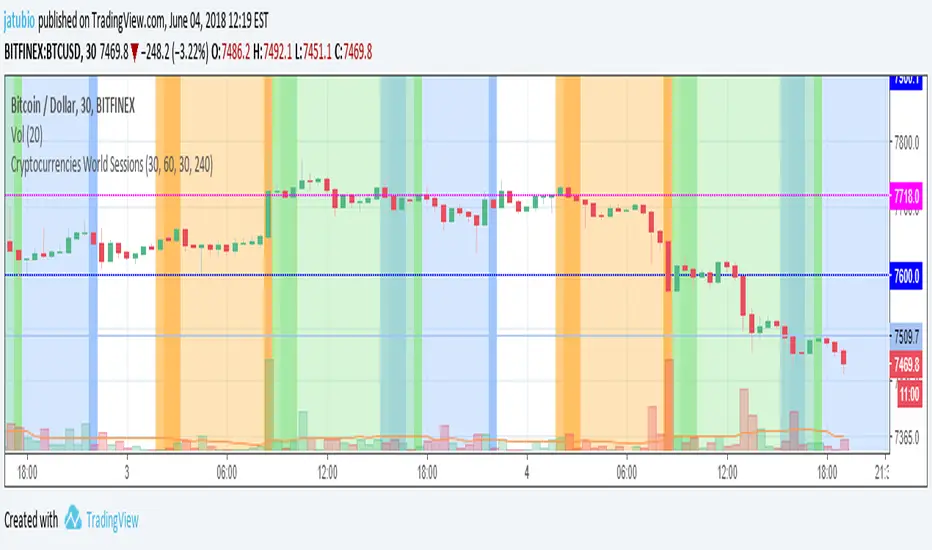
Cryptocurrencies World SessionsEste indicador cambia los colores del fondo para identificar zonas horarias relacionadas con las sesiones de trading en criptomonedas.
Se muestran las sesiones de: America (Nueva York), Europa (Londres) y Korea (Seúl)
Además de mostrar la duración de la sesión, se pueden configurar intervalos para resaltar (en minutos): Antes de la apertura, después de la apertura y antes del cierre.
-----------------------------------------------------------------------------------
This indicators show background colours to identify world timezones about to cryptocurrencies trading sessions
These sessions are shown: USA (New York), Europe (London) and Korea (Seoul).
In addition to show the duration of the session, you can set intervals to be highlighted (in minutes): Before opening, after opening, before closing.
Bitcoin (Criptomoeda)


Simple profitable trading strategyThis strategy has three components.
Philakones EMAs are a sequence of five fibonacci EMAs. They range from 55 candles (green) to 8 candles (red) in length. A strong trend or breakout is marked by the emas appearing in sequence of their length from 8 to 55 or vice versa. These EMAs are also used to signal an exit. Only two EMAs are used for exit signals - when the 13 EMA crosses over/under the 55 EMA.
RSI gives a bullish signal when 40 > rsi > 70. Exit signals are oversold (30) or overbought (70)
Stochastics give a bullish signal when stoch < 80 and an exit signal when > 95.
Results include 3 ticks of slippage and taker fees of .002. Provides a pretty smooth equity curve with a 73% win rate and beats buy and hold by than 10x (returns about 60x overall) since start of 2017.

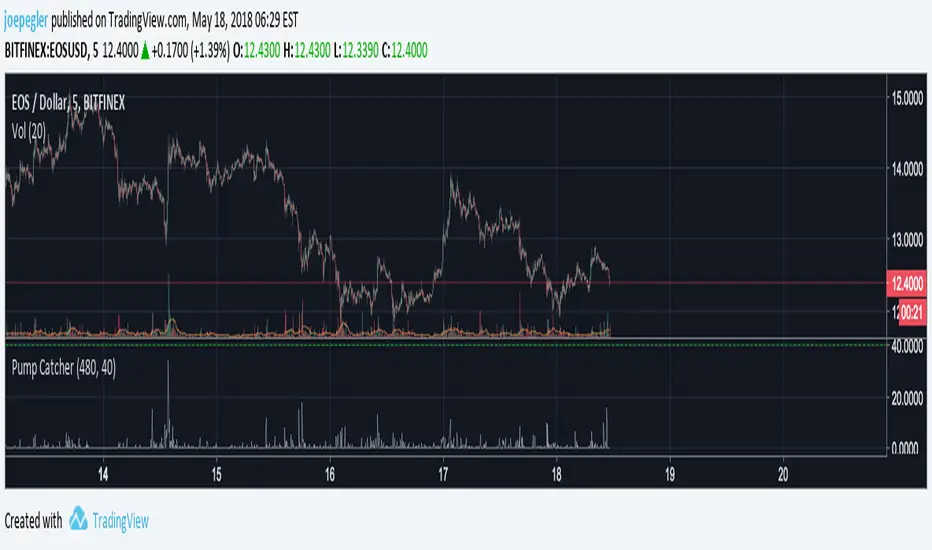
Pump CatcherThis indicator attempts to detect moments of abnormal and accelerating increase in volume. Because pumps happen over short time frames, this script is potentially better used on smaller timeframes (1 - 15 minutes). It takes two inputs: The length of the lookback for the volume rate of change (vroc) calculation (default=20), and The threshold over which a pump is determined to have happened (0-100, default=50). The vroc has been normalised to a result between 0 (no rate of change) and 100 (maximum rate of change the asset has ever undergone to date).

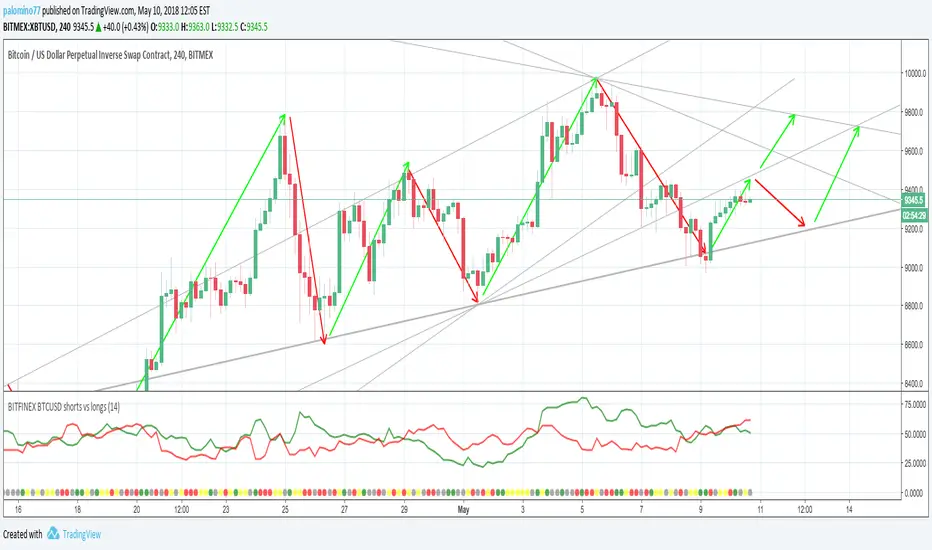
BITFINEX BTCUSD shorts vs longsA simple script to get an RSI of BTCUSD SHORTS and LONGS on Bitfinex.
(Forked from an open sourced script)
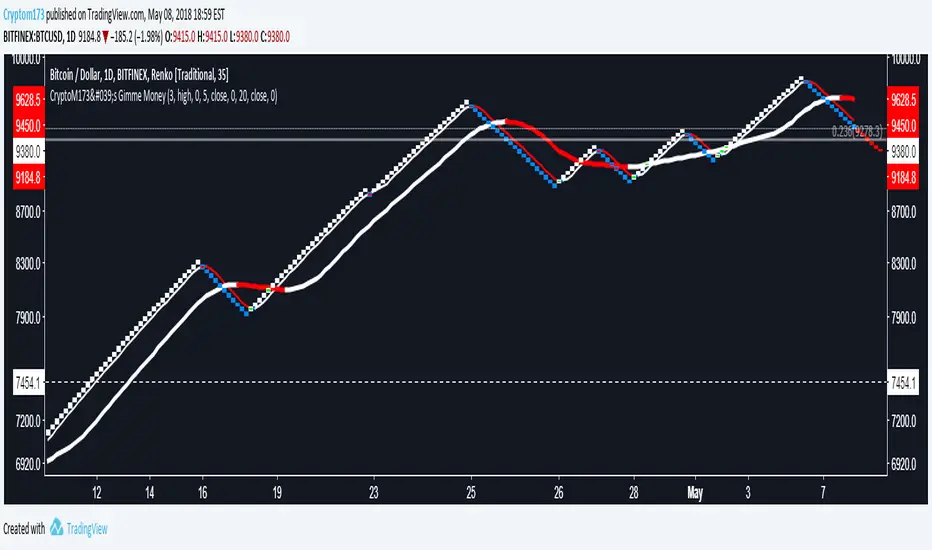
CryptoM173's Gimme MoneyLatest version. Nobody gave me feedback and managing requests to add people became a PITA. Enjoy.
I like money, you like money, this set up has the potential to make a LOT of it. That being said, I do NOTmake any warranties of this making you money, nor do I guarantee you will NOT lose money. In the end, you're the one configuring it and interpreting the results. Providing that you DO set it up correctly and it makes you obscene amounts of money, donations are always welcome (addresses below).
Before you start, it's probably you read EVERYTHING below.
You'll have to do some tweaking of the MA's to find a strat that best suits your needs. It is an indicator you're welcome to use to assist in your trading decisions. I made this script for renko charts and trading bitcoin -1.64% because the standard strat wasn't working out. if you find you're getting a lot of consecutive colored bars or crosses on Renko, you may need to switch from ATR 14 to something like Traditional 50. You will need to adjust the "box value" for traditional renko to fit the asset you're working with, on the time frame you're trading on. Smaller values (i.e. on bitcoin -1.64% I use a box value of 50 on 4hr and 1D with absurd success) but you need to make sure they're not too small, otherwise small moves may appear larger than they are, resulting in a bunch of break-even trades. If you're going to be trading cryptocurrency, it's easiest to switch back to ATR14 to get an idea of the Average Trading range to have a reference point to start from trading btc -1.64% (i.e .000034 rather than 50).
It's a great tool if you're looking to carry both swap and futs positions and keep an eye on the short term swap opportunities while monitoring the status of your futs position and help decide whether or not to close a long at a correction or not and while this strategy has been most effective for me with Renko bars, it's been very useful for monitoring futs positions on traditional charts.
For access, feel free to DM -0.34% me on twitter, @CryptoM173
If you're the generous type, feel free to donate Bitcoin to: 3BMEXWz6Es7iLdi9zAyMWWHHZPNbMKPqrV

EnaCrypto / MA50-EMA144-MA200// Special Thanks to EnaCrypto. This is his idea on bullish graphs.
// How to understand if the graph is bullish?
// 1.MA50 must be at top.
// 2.MA200 must be at the bottom.
// Strategy
// In 4H Graph when the MA50-EMA144-MA200 is int he right order, sell if the price is below MA50. Otherwise hodl.

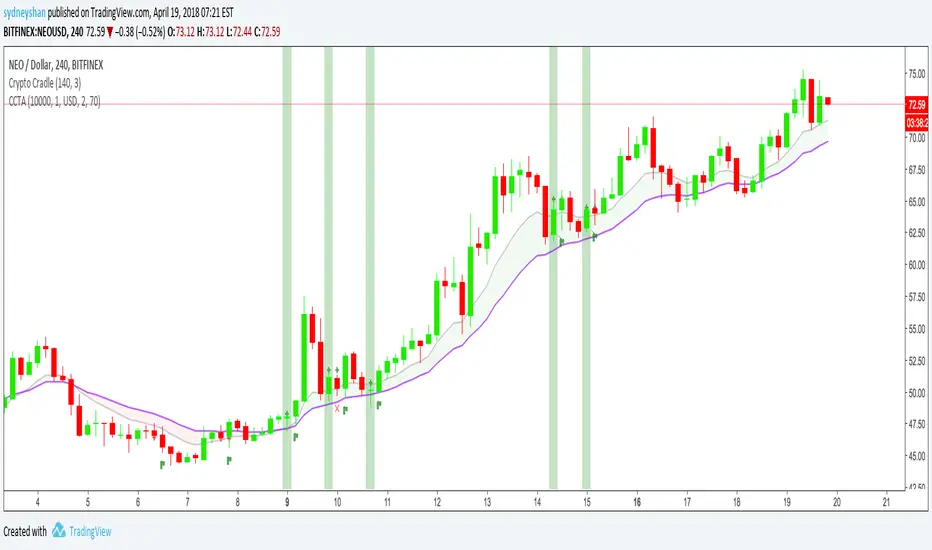
Crypto Cradle Trade AssistantThis indicator compliments the Crypto Cradle indicator by providing your entry, stop, 1:1 scale-out price, trade amount, and potential profit based on your target and scale-out strategy.
1. Ensure you have added the Crypto Cradle and Crypto Cradle Trade Assistant indicators to your chart
2. Click the cog icon to configure this indicator
3. Enter in your account balance and the % you are willing to risk on this trade (default: 1%).
3. Set your target price
4. Tweak the Trade Pair and Precision (Decimals) if required (USD/USDT only BTC & ETH coming soon)
5. Click on the 'Data Window' icon on the right-hand side of the screen and scroll down to CCTA
6. Hover over a highlighted crypto cradle candle (green for long, red for short) and a series of values will appear
Entry price
Stop price
1:1 scale out price
Amount to buy/sell (ie NEO)
Amount in traded currency (ie USD)
Target price (that you set)
Profit based on selling 50% of your bought amount when your reward equals your risk (1:1 scale-out)
Profit based on risking 1% of your portfolio
For more about the Crypto Cradle strategy, visit www.tradercobb.com
CryptoShadows V1The first Diagonal Support and Resistance indicator. Best for bitcoin and cryptocurrencies

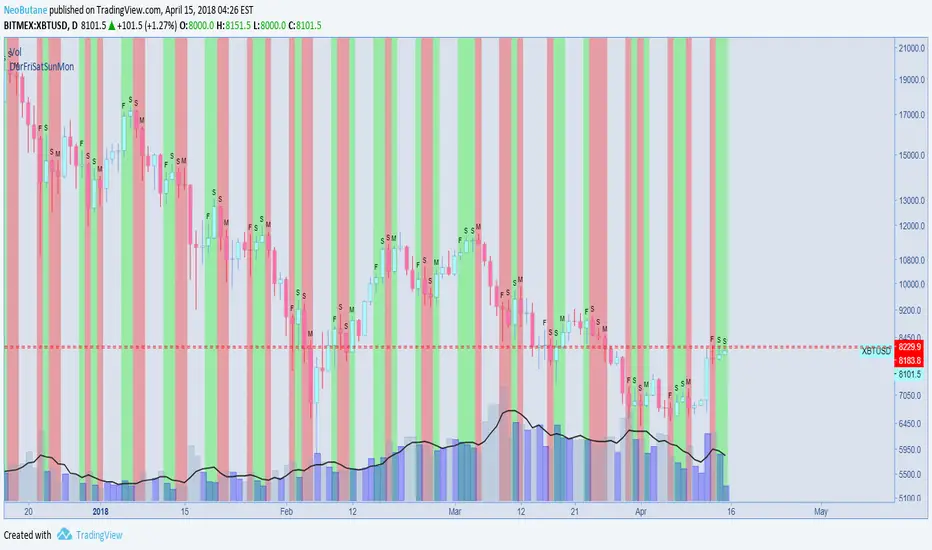
DurFriSatSunMonShows green if close > open on a given day, red is close < open.
Dur is for Thursday, which is optional.
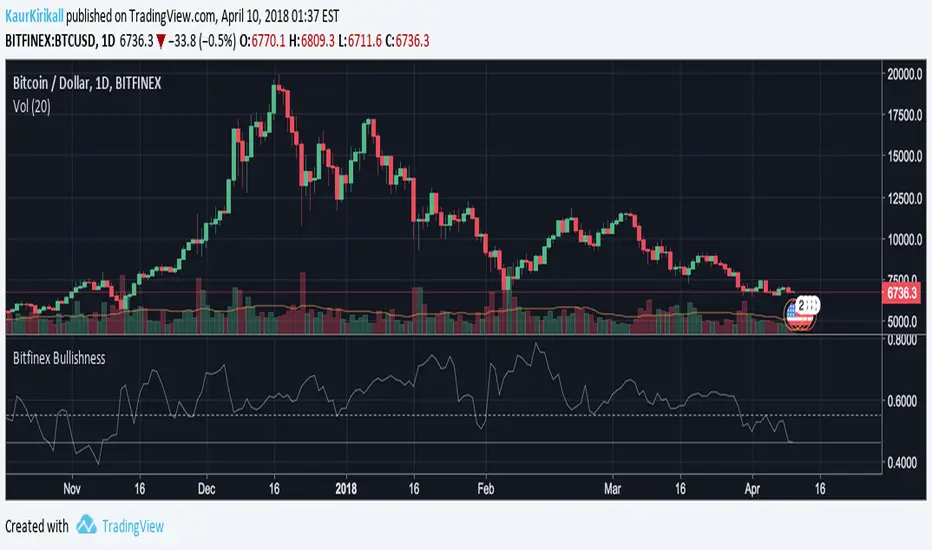
Bitfinex Bitcoin BullishnessBased on contrary opinion in futures, I've adjusted this to Bitcoin, more thoroughly Bitfinex margin longs & shorts. Those unfamiliar with the concept, contrary opinion illustrates the psychological sentiment in the market by determining the degree of bullishness or bearishness among participants in the market.
The principle holds that when the majority of people agree on anything, they are generally wrong, so following the principle you would analyse and look to take the other side of the trades.
Consider this, once the market is extremely bullish, all bulls have already entered the market to an extent that one can't commit any more funds to the position. Even though Bitfinex margin positions are not like future trading, that every short must have someone taking the long side, one should understand that the majority of people do not make money on the market, so whenever this indicator goes too low or too high, one should look for a trend reversal.
This indicator is in the range of 0 to 1 and the neutral position for a "healthy" market is 0.55ish. Some adjustments should probably be made according to the cryptocurrency markets and I might add this in the future updates, but as of now it's a good indicator for forecasts and to get a bigger picture on a timeframe of 1 DAY or longer charts.
The base of the indicator is simple, amount of longs divided by the sum of shorts and longs.
Also you can see, how only now, 10th of April, we are hitting new lows in the bearishness of the market.
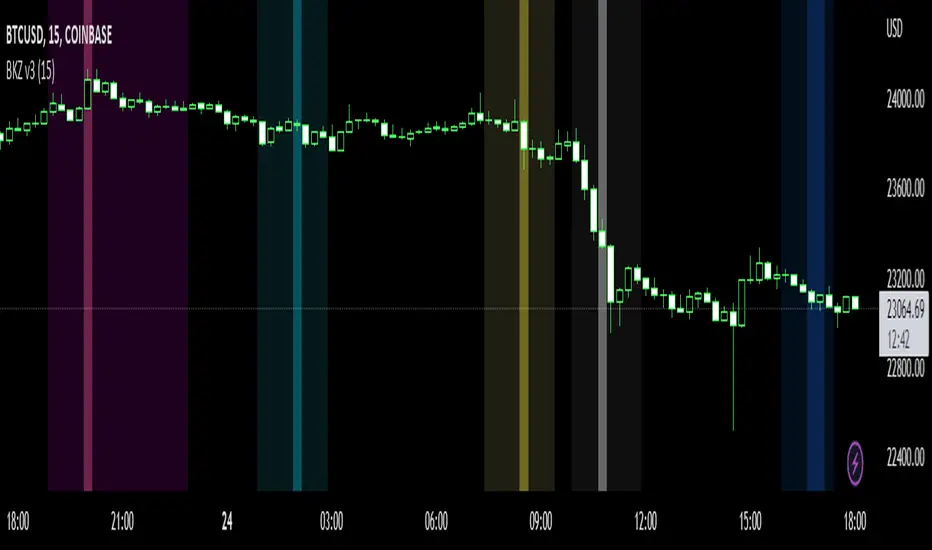
Bitcoin Kill Zones v2 |7Day| [oscarvs] [xeno]This edit adds weekends to Bitcoin Kill Zones v2 by oscarvs and other contributors. Bit of an experiment. Enjoy.
Bitmex Funding BarsFor XBTUSD bitmex perpetual contract. Times adjusted for 1hour chart. Shows the hour before funding in a subtle grey highlight.
-Xeno


Dual EMAI figured you'd like a dual EMA option as well, so here it is. GDAX 12/26 by default. I don't really use EMA but you can change the values and colors to whatever you want.

Custom Time ranges
Description:
This script colours the background of any time range you specify, including weekend periods.
It can be useful for spotting patterns on Bitcoin (recurring times of buying or selling).
Checkboxes to switch on and off. Inputs to specify time and day of week.
Monday = 2
Tuesday = 3
Wednesday = 4
Thursday = 5
Friday = 6
Saturday = 7
Sunday = 1
Example 1:
1500-1800:2
This will colour the background between 3pm and 6pm on Mondays.
Example 2:
0000-0600:247
This will colour the background between midnight and 6am on Mondays, Wednesdays, and Saturdays.
Any questions you may have, please leave in comments below and I'll respond when I have time.


2x Multi Time Frame Exponential Moving Average2x Multi Time Frame Exponential Moving Average
Allows you to see longer EMA while viewing shorter time frames.

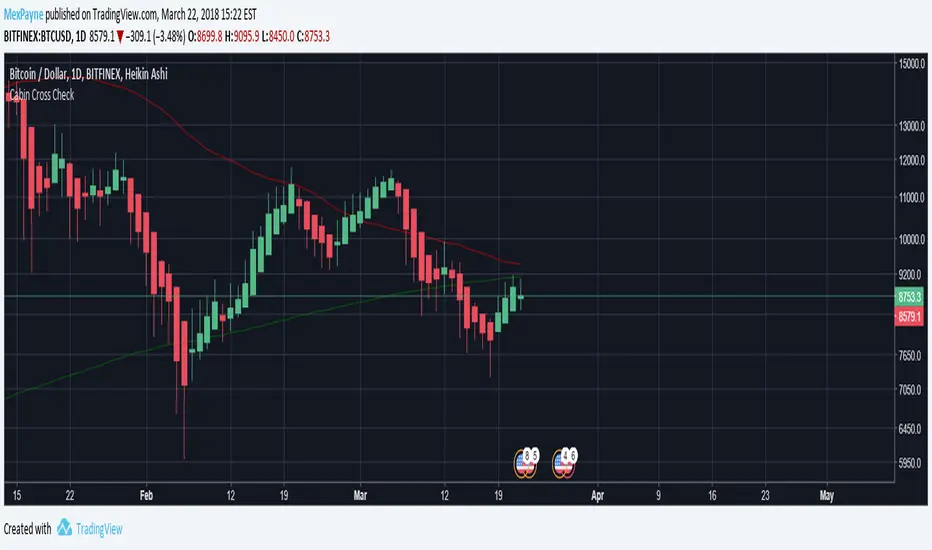
Death Cross - 200 MA / 50 Cross CheckerBITFINEX:BTCUSD
You can check if 200 day MA crossed by 50 day MA. Nuff said.
BTC CorrelationA simple script to display how correlated the current ticker is to Bitcoin.
Inputs are the number of bars to check correlation for (default 10) and the the ticker to use for BTC comparison (default is BITFINEX:BTCUSD)
Values of 1 are highly correlated (i.e. bitcoin moves up, so does your current ticker), values of -1 are inversely correlated (i.e. bitcoin moves up, your current ticker moves down).
See: www.babypips.com for some more details on correlation
