OPEN-SOURCE SCRIPT
Atualizado Horizontal Lines from Current Price
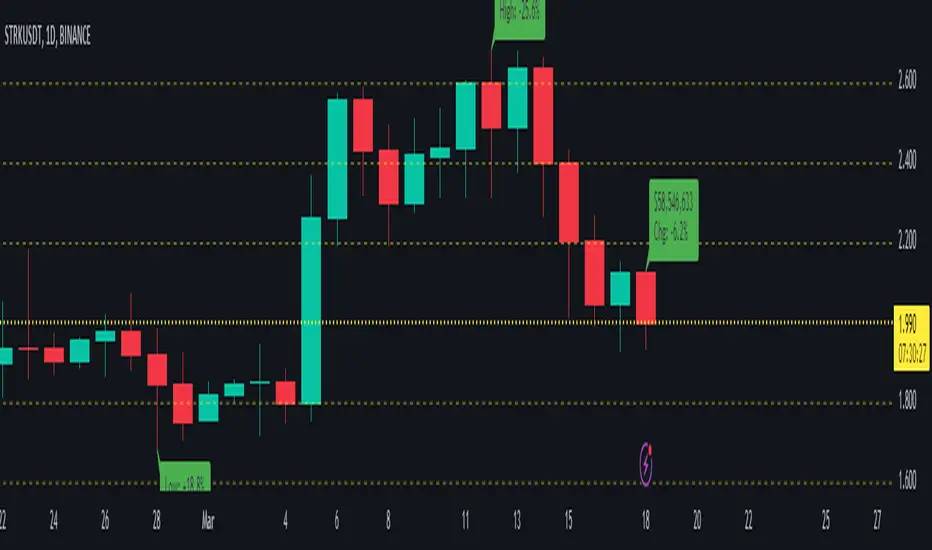
This indicator will help traders track price fluctuations in smaller time frames more conveniently than ever before.
Here's how it works:
Additionally, we also provide volume display (measured in USD) at the current candle position to assist traders in keeping track of market momentum more closely.
Installation guide for indicators:
Here's how it works:
Starting from the current price, the indicator will draw horizontal lines spaced 10% apart.
Now, whenever zooming in or out of the chart, traders can visually determine the level of price volatility more easily.
Additionally, we also provide volume display (measured in USD) at the current candle position to assist traders in keeping track of market momentum more closely.
Installation guide for indicators:
After installing the indicator, make sure that the indicator is merged with the price chart.
Secondly, ensure that the scale bar of the indicator merges with the scale bar of the price chart.
Notas de Lançamento
Update default inputsNotas de Lançamento
Clean source code & InputsNotas de Lançamento
➕ Added the feature to view the highest and lowest price changes of the current bar compared to the previous bars.⚡⚡⚡Notas de Lançamento
Clean source code 🚧🚧🚧Notas de Lançamento
➕ Added the feature to view the changes in the current price bar.⚡⚡⚡Notas de Lançamento
Clean source code 🚧🚧🚧Notas de Lançamento
Update display current price 🚧🚧🚧Notas de Lançamento
Fix bug 🚧🚧🚧Notas de Lançamento
Fix bug 🚧🚧🚧Notas de Lançamento
Fix bug 🚧🚧🚧Notas de Lançamento
Fix bug 🚧🚧🚧Notas de Lançamento
Fix bug 🚧🚧🚧Notas de Lançamento
Fix bug 🚧🚧🚧Notas de Lançamento
Fix bug 🚧🚧🚧Script de código aberto
Em verdadeiro espírito do TradingView, o criador deste script o tornou de código aberto, para que os traders possam revisar e verificar sua funcionalidade. Parabéns ao autor! Embora você possa usá-lo gratuitamente, lembre-se de que a republicação do código está sujeita às nossas Regras da Casa.
Aviso legal
As informações e publicações não se destinam a ser, e não constituem, conselhos ou recomendações financeiras, de investimento, comerciais ou de outro tipo fornecidos ou endossados pela TradingView. Leia mais nos Termos de Uso.
Script de código aberto
Em verdadeiro espírito do TradingView, o criador deste script o tornou de código aberto, para que os traders possam revisar e verificar sua funcionalidade. Parabéns ao autor! Embora você possa usá-lo gratuitamente, lembre-se de que a republicação do código está sujeita às nossas Regras da Casa.
Aviso legal
As informações e publicações não se destinam a ser, e não constituem, conselhos ou recomendações financeiras, de investimento, comerciais ou de outro tipo fornecidos ou endossados pela TradingView. Leia mais nos Termos de Uso.