OPEN-SOURCE SCRIPT
Sharpe Ratio
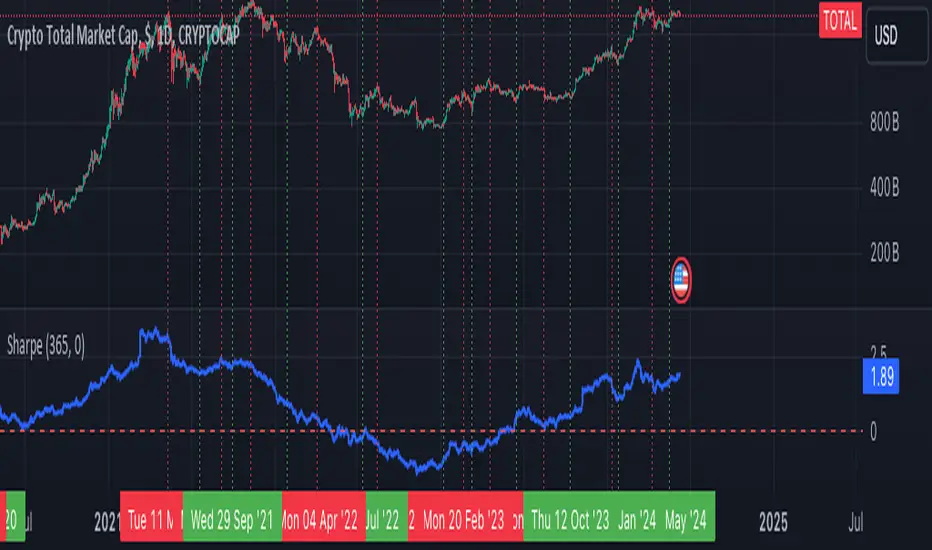
The Sharpe Ratio Indicator is a widely-used tool designed to measure the risk-adjusted performance of an asset. The Sharpe Ratio helps investors understand how much excess return they are receiving for the extra volatility endured for holding a riskier asset. By comparing the return of an investment to the risk-free rate and accounting for the volatility of the investment's returns, the Sharpe Ratio provides a clear metric for evaluating the return on investment per unit of risk.
Features:
Calculation Period Input: Allows users to specify the period over which the Sharpe Ratio is calculated, making it flexible and adaptable to various trading strategies and time frames.
Risk-Free Rate Input: Users can set a specific risk-free rate, enabling a customized risk-return analysis based on prevailing market conditions or individual investment preferences.
Daily Returns Calculation: The indicator calculates daily returns, which are used to determine the mean return and standard deviation.
Sharpe Ratio Calculation: The indicator calculates the Sharpe Ratio by dividing the excess return (mean return minus risk-free rate) by the standard deviation of returns and annualizing the result (assuming 252 trading days in a year).
Visual Plot: The Sharpe Ratio is plotted on the chart, with a reference zero line to help users quickly assess whether the asset's returns are favorable relative to the risk-free rate.
How to Use:
Add the Indicator to Your Chart: Copy the script into the Pine Script editor on TradingView and add it to your chart.
Specify the Calculation Period: Adjust the Calculation Period input to match your desired time frame for the Sharpe Ratio calculation.
Set the Risk-Free Rate: Input the current risk-free rate (e.g., the yield on 10-year government bonds) to customize the risk-return analysis.
Interpret the Sharpe Ratio: A higher Sharpe Ratio indicates better risk-adjusted performance, while a ratio below zero suggests that the asset has underperformed relative to the risk-free rate.
Script de código aberto
Em verdadeiro espírito do TradingView, o criador deste script o tornou de código aberto, para que os traders possam revisar e verificar sua funcionalidade. Parabéns ao autor! Embora você possa usá-lo gratuitamente, lembre-se de que a republicação do código está sujeita às nossas Regras da Casa.
Aviso legal
As informações e publicações não se destinam a ser, e não constituem, conselhos ou recomendações financeiras, de investimento, comerciais ou de outro tipo fornecidos ou endossados pela TradingView. Leia mais nos Termos de Uso.