PROTECTED SOURCE SCRIPT
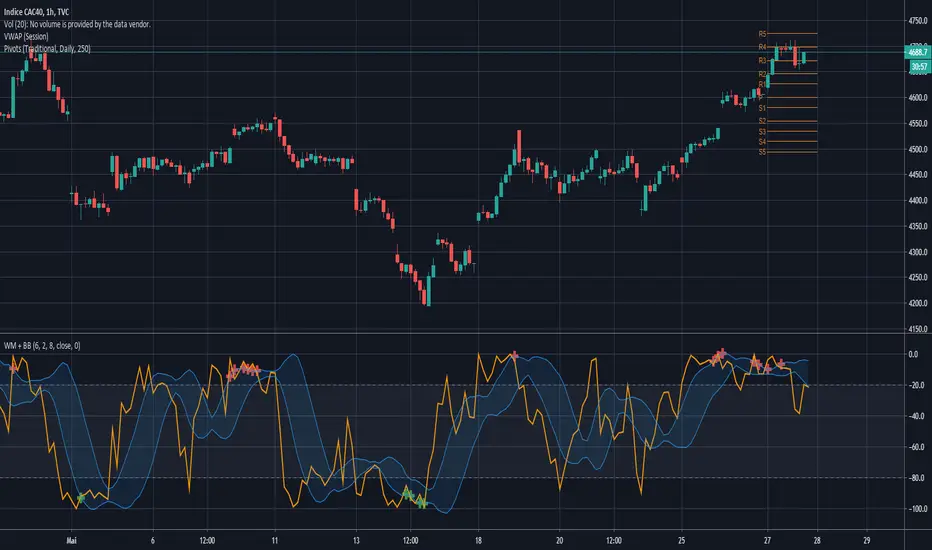
Williams + BB Buy Sell signal

Williams %R with Bollinger Bands
This script can help traders to determine if there is a buy or sell signal.
It indicates when the Williams %R crosses the Bollingers bands levels at the overbought and oversold areas.
Red cross: when the Williams crosses the upper level of BB in the overbought area, that can be considered as a double confirmation to sold.
Green cross: when the Williams crosses the lower level of BB in the oversold area, that can be considered as a double confirmation to buy.
Configuration:
This indicator gives accurate signals with this configuration:
Williams %R: period length 12
MA period: period length 8
Bollinger bands: period length 6
Script protegido
Esse script é publicada como código fechado. No entanto, você pode gerenciar suas escolhas de bate-papo. Por favor, abra suas Configurações do perfil
Aviso legal
As informações e publicações não se destinam a ser, e não constituem, conselhos ou recomendações financeiras, de investimento, comerciais ou de outro tipo fornecidos ou endossados pela TradingView. Leia mais nos Termos de Uso.