OPEN-SOURCE SCRIPT
RSI Accumulation/Distribution [M]
Atualizado
Hello everyone,
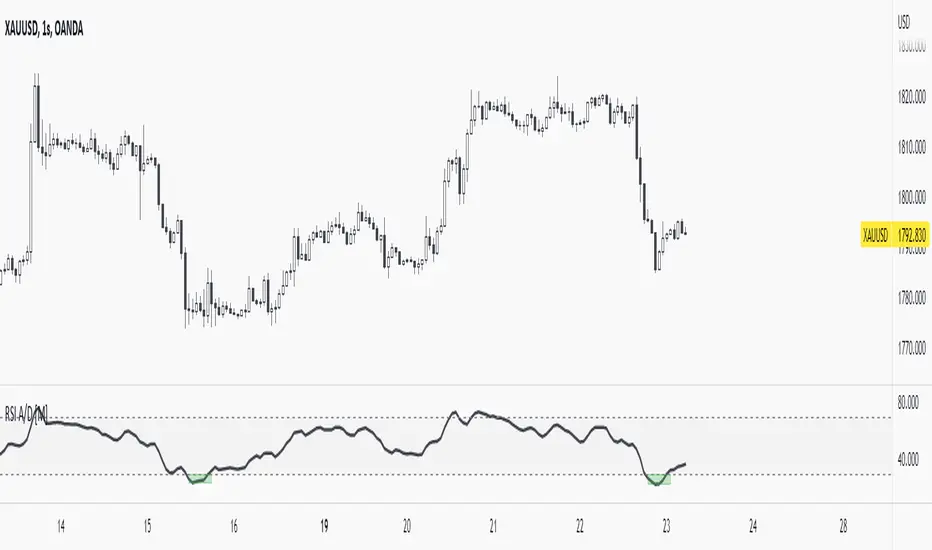
After my long tests, I observed that the rate of change of direction of the price was high after the periods when the RSI spent a long time outside the band. As a result of my observations, I prepared this indicator.
This indicator shows you the accumulation and distribution areas that occur outside the rsi band.
There are 3 different levels available.
Level 1 = 5 Bars
Level 2 = 7 Bars
Level 3 = 9 Bars
For example, if the RSI spends more than 9 bars below the 30 level or above the 70 level, it will paint that area red. Levels can be changed from the indicator settings. The rsi is smoothed with simple moving average to reduce fake signals.
Using the RSI A/D indicator with different indicators or patterns will increase your success rate.
Examples:
Notas de Lançamento
+Alert addedScript de código aberto
No verdadeiro espírito do TradingView, o autor desse script o publicou como código aberto, para que os traders possam compreendê-lo e analisá-lo. Parabéns ao autor! Você pode usá-lo gratuitamente, mas a reutilização desse código em publicações é regida pelas Regras da Casa. Você pode favoritá-lo para usá-lo em um gráfico.
Aviso legal
As informações e publicações não devem ser e não constituem conselhos ou recomendações financeiras, de investimento, de negociação ou de qualquer outro tipo, fornecidas ou endossadas pela TradingView. Leia mais em Termos de uso.